
Dynatrace Cloud Native Full Stack injection for Kubernetes, now officially released, provides unparalleled flexibility and scale for onboarding teams to AI-powered observability. By taking advantage of native Kubernetes standards, Dynatrace Cloud Native Full Stack injection empowers you to precisely provide the data that your teams need in exceptionally fast and automated ways.
Built for large enterprises, Dynatrace Cloud Native Full Stack injection provides an alternative to our recommended Classic Full Stack injection, offering a handful of advantages that are applicable to many situations:
- Application and infrastructure teams can onboard team members to Dynatrace in minutes using new namespace selectors for fine-grained control.
- Observability data coming from one or many Kubernetes clusters can be easily segmented across Dynatrace SaaS and Managed clusters, either located in the cloud or on-premises.
- Common race conditions that prevent observability instrumentation and Kubernetes autoscaling are solved using the new Dynatrace mutating webhook pod.
Flexible automation for Kubernetes observability
For years, enterprises managed observability data on a team-by-team basis, using a combination of ticketing systems and configuration management tools. This approach is costly and error prone. From a cost perspective, internal customers waste valuable time sending tickets to operations teams asking for metrics, logs, and traces to be enabled. The resulting configuration changes are complicated to implement and require coordinated changesets across dependent componentry.
To solve this problem, Dynatrace offers a fully automated approach to infrastructure and application observability including Kubernetes control plane, deployments, pods, nodes, and a wide array of cloud-native technologies.
Dynatrace furthers this automated approach by providing unprecedented flexibility for organizations that need to onboard teams as quickly as possible. The foundation of this flexibility is the Dynatrace Operator¹ and its new Cloud Native Full Stack injection deployment strategy.
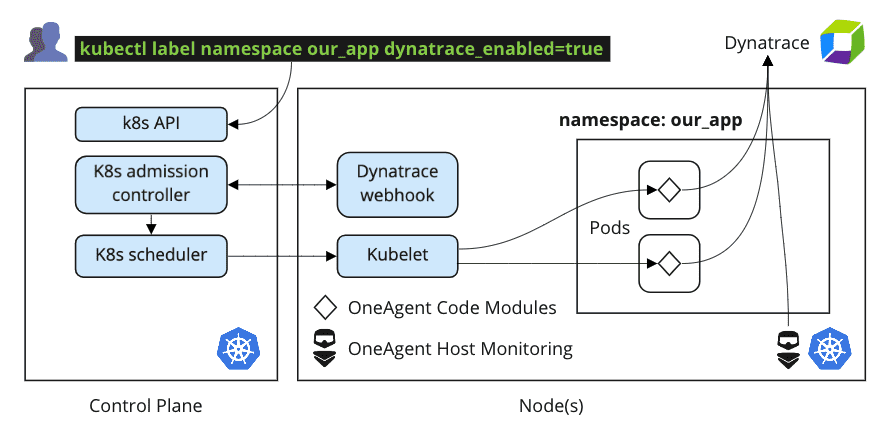
Onboarding teams is now as easy as labeling their Kubernetes namespaces using a standard selector. A team looking for metrics, traces, and logs no longer needs to file a ticket to get their app monitored in their own environments. Instead, using Dynatrace Cloud Native Full Stack injection, a team can help themselves with a standard Kubernetes label command such as:
kubectl label namespace our_app dynatrace-injection=enabled
Embracing cloud native best practices to increase automation
Onboarding teams using self-service Kubernetes selectors is one of the best examples of how Dynatrace embraces cloud native technologies to increase automation, reduce bureaucracy, and encourage agility. The technicalities are simple to understand. After a namespace is labeled, special instructions are sent from the Kubernetes admission controller to the Dynatrace mutating webhook pod. The result is an automatically enhanced deployment manifest that includes OneAgent, its requisite configurations, and references to secured tokens and API endpoints.
None of this complexity is exposed to application and infrastructure teams. Just label your namespace and the Dynatrace Kubernetes webhook does the rest. Activating Kubernetes observability is now both easy and incremental. Adding new teams no longer requires intervention or “big bang” changes to the cluster.
Easy segmentation of observability across environments, teams, and org boundaries
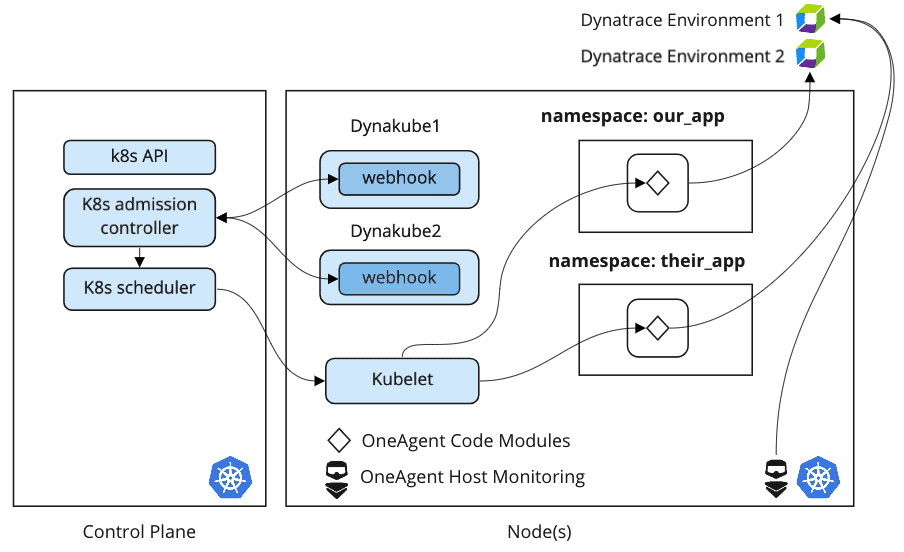
In addition to quick and incremental onboarding, Cloud Native Full Stack Injection also provides flexibility for directing observability data to separate Dynatrace environments. This is especially important for organizations that require separate Dynatrace Clusters for regulatory or privacy concerns. If, for example, two lines of business that share the same Kubernetes cluster cannot share the same Dynatrace environments, then they can use Cloud Native Full Stack injection to split the data.
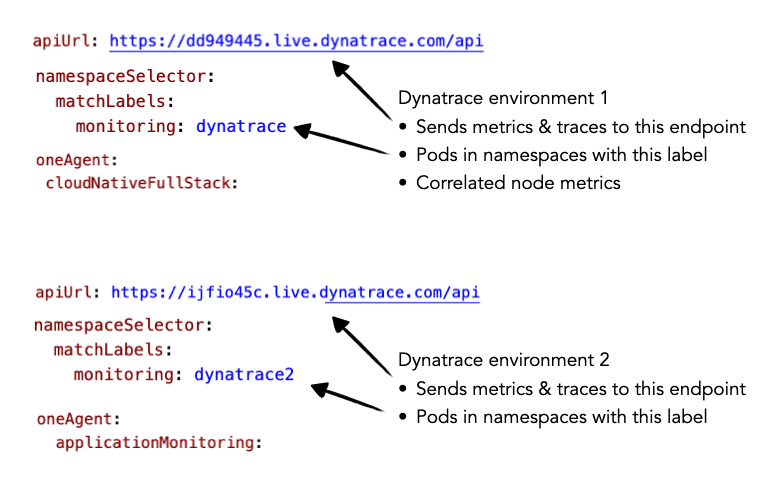
Splitting metrics and traces by namespace to different Dynatrace environments is equally easy to implement. Instead of deploying a single custom resource (a “Dynakube”), the Dynatrace Operator deploys a second or third Dynakube that targets separate Dynatrace environment API endpoints. Just as with quick onboarding, namespace selectors are the mechanism for choosing which namespaces target each environment.
Solving race conditions for Kubernetes node autoscaling
Node autoscaling is one of the reasons Kubernetes has become such a popular platform for running applications. But sometimes features like these do not work as advertised. In the case of node autoscaling, failures are usually caused by race conditions among pods that do not start reliably or in the right order.
Fortunately, Kubernetes admission controllers are one way to work around the problem of race conditions on autoscaled nodes. It is for this reason that the new Dynatrace Cloud Native Full Stack injection mutates pods on autoscaled nodes no matter what order the pods are started. Using this new mode of injection means organizations can take advantage of everything Kubernetes has to offer without worrying about monitoring outages or disruptions in service.
Classic Full Stack vs. Cloud Native injection: Which is better for your organization?
Dynatrace released Cloud Native Full Stack injection with a short list of temporary limitations—referenced in our documentation—which don’t apply to Classic Full Stack injection. For this reason, Classic Full Stack continues to be the recommended approach, though it will eventually be superseded by Cloud Native Full Stack injection. Beyond these limitations, it’s clear that Cloud Native Full Stack injection has certain advantages over Classic Full Stack injection in key situations. These situations apply to organizations that are looking to:
- Onboard teams to Kubernetes observability data as quickly as possible.
- Send metrics, logs, and traces to more than one Dynatrace environment.
- Solve common race condition problems related to node autoscaling.
Reaping the rewards of Dynatrace Cloud Native Full Stack injection
Of course, the most important aspect of activating Dynatrace on Kubernetes is the incalculable level of value the platform unlocks. Dynatrace AI-powered observability addresses the needs of everyone involved both in and around every Kubernetes cluster across the entire enterprise.
The following example makes the point. Let’s say you have a web application deployed to Kubernetes. The application consists of several microservices that are available as pod-backed services.
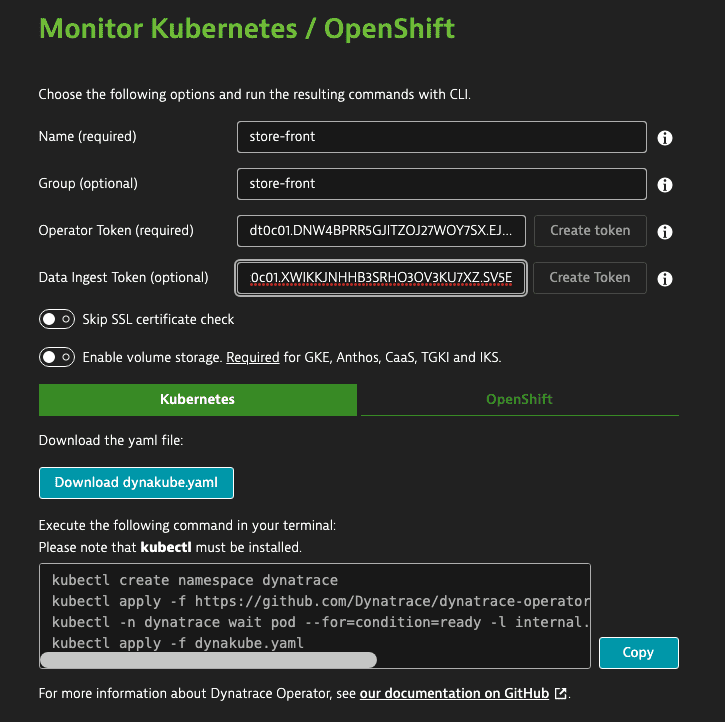
Monitoring such an application is easy. First, go to the Monitor Kubernetes/OpenShift page in the Dynatrace web UI and generate a deployment file (see the example below). This file is automatically configured with working defaults, but it can be easily modified using a code editor such as VS Code. Of course, everything is deployed using standard kubectl commands.
Adapt deployments for multiple Dynatrace environments
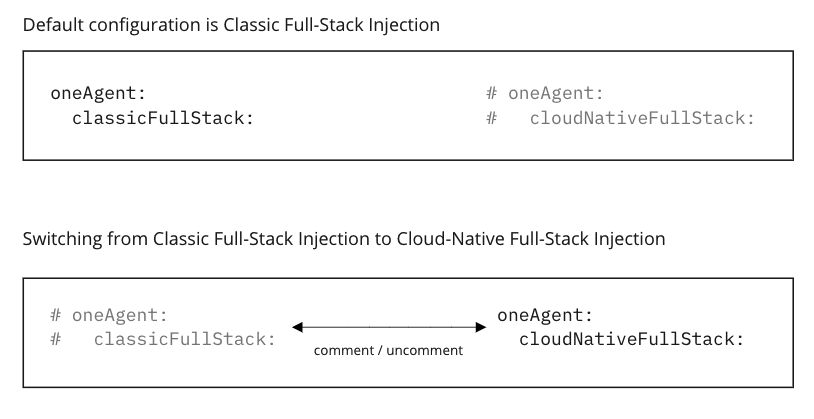
Since the default dynakube.yaml file uses Classic Full-Stack Injection, and we are interested in splitting metrics between different Dynatrace environments by namespace, we must switch the Dynakube to Cloud-Native Full-Stack Injection. As described in the documentation, as well as in the Dynatrace Operator GitHub repository, the change looks like this:
Onboard teams to Dynatrace AI-powered observability
After switching to Cloud Native Full Stack injection, we can choose to monitor different namespaces, using a selector, as follows:
namespaceSelector:
matchLabels:
monitoring: dynatrace
Finally, we add a selector to the namespaces we want to monitor with a simple command:
kubectl label namespace marketplace monitoring=dynatrace
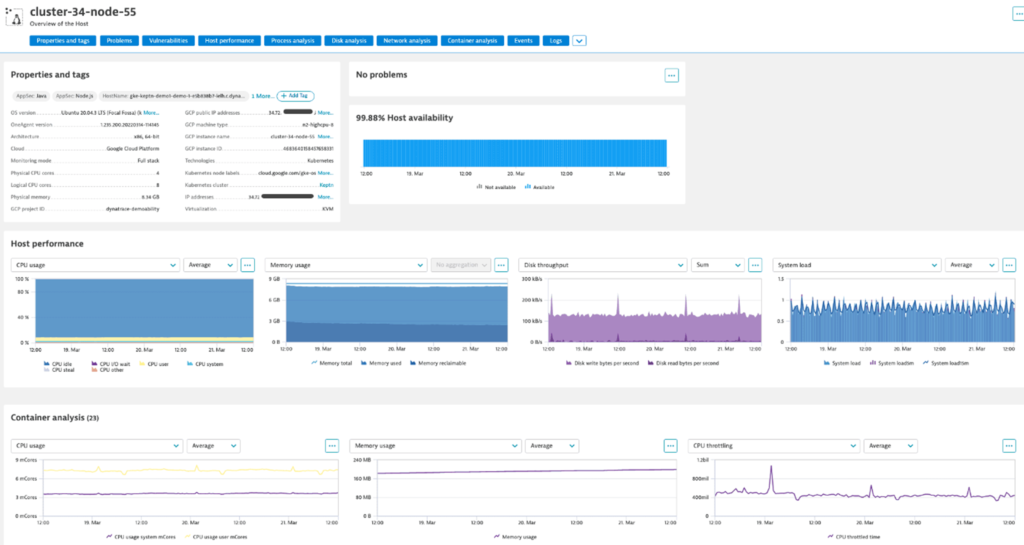
Along with selected namespaces, Dynatrace automatically monitors Kubernetes nodes. This gives us unified analytics views of node resources together with pod-level metrics such as container CPU throttling by node, which makes problem correlation much easier to analyze.
After activating Dynatrace monitoring for Kubernetes we can easily address compliance requirements by splitting observability between different Dynatrace environments. We create and deploy a second Dynakube to send observability data to a second Dynatrace environment with a different API endpoint and namespace selector.
Deploying multiple Dynakube resources is an easy way to split metrics and traces across different environments. Combining this with Dynatrace FluentD integration adds log splitting from the same sources and destinations. Examples of these configurations can be found in the Dynatrace Fluentd plugin GitHub repository.
Putting it all together
With Cloud Native Full Stack injection, combined with Fluentd integration, you get the full power of Dynatrace intelligent observability for metrics, traces, and logs, with simple onboarding by namespace, across separate Dynatrace environments. This solution offers both maximum efficiency and adherence for the toughest privacy or compliance demands.
Experiencing the value of Cloud Native Full Stack injection is especially clear when multiple application and infrastructure teams view the same unified analytics view for their workloads. In addition to logs, and events, Dynatrace surfaces logs streamed from Fluentd so that you can analyze those logs in context with traces and services.
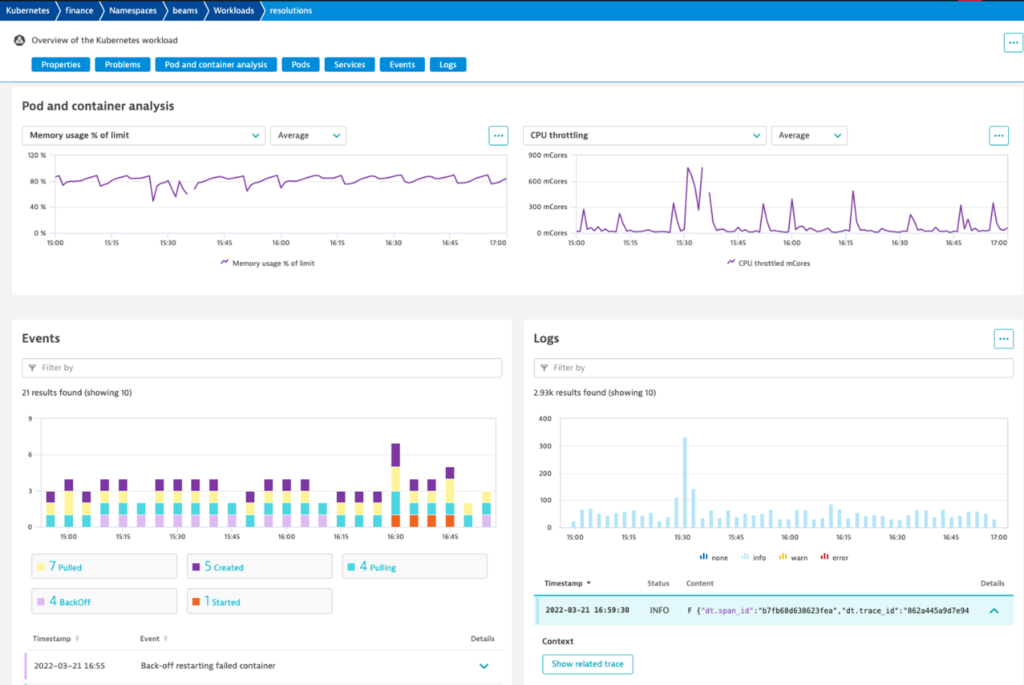
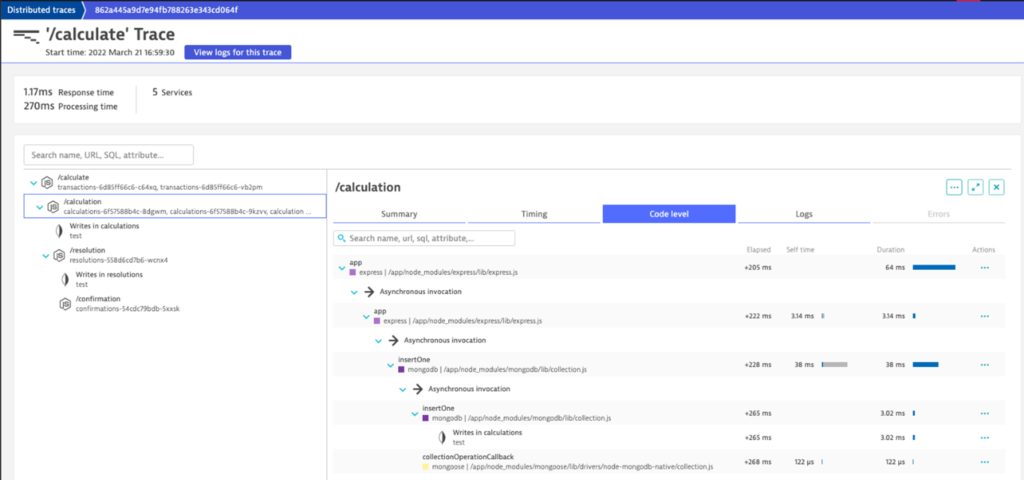
Related traces are accessed per log line using the Show related trace button, which appears in the lower right card in the screenshot above. From here we jump directly into Dynatrace Distributed traces view, shown below, to understand code-level contributions to total processing time.
Only Dynatrace provides this level of depth and breadth across Kubernetes clusters, from infrastructure level information needed by operations teams, all the way down to code-level inefficiencies that are best handled by application engineers. And now, with Cloud Native Full Stack injection, every team can be onboarded in minutes, in a regulatory compliant way that only Dynatrace can address.
A look to the future
Cloud Native Full Stack injection provides a rock-solid foundation for us to plan the next set of Dynatrace innovations. Stay tuned for more awesome Dynatrace Kubernetes announcements throughout the year.
At present, we’re working on quick and easy Kubernetes alerting configurations for common platform and application issues. Our focus is also turning towards support for signed container images in a new Dynatrace container registry and merging service versions for Kubernetes workloads. Information about each of these topics will be available in upcoming announcements.
Activate Cloud Native Full Stack injection today
Existing Dynatrace customers can activate Cloud Native Full Stack injection by using the Kubernetes deployment page and modifying the Dynakube definition according to the instructions in our documentation. If you haven’t used Dynatrace, go ahead and sign up for a free trial, activate your environments, and experience instant, automatic, and continuous observability across your Kubernetes clusters.
Kubernetes in the wild report 2023
This Kubernetes survey shows how organizations actually use Kubernetes in production. The study analyzes factual Kubernetes production data from thousands of organizations worldwide that are using the Dynatrace Software Intelligence Platform to keep their Kubernetes clusters secure, healthy, and high performing.

__________
¹ The Dynatrace Operator replaces the OneAgent Operator, which is now officially deprecated. There is no functional difference between these two operators for Classic Full Stack injection, although the newer operator can deploy containerized ActiveGates, while the older operator can’t. The Dynatrace Operator also supports Cloud Native Full Stack injection, while the older operator does not. For migration instructions, see the topic Migrate from OneAgent Operator to Dynatrace Operator in Dynatrace documentation.


Looking for answers?
Start a new discussion or ask for help in our Q&A forum.
Go to forum