
Drowning under endless data? Having access to large data sets can be helpful, but only if organizations are able to leverage insights from the information. Exploratory analytics with collaborative analytics capabilities can be a lifeline for CloudOps, ITOps, site reliability engineering, and other teams struggling to access, analyze, and conquer the never-ending deluge of big data. These analytics can help teams understand the stories hidden within the data and share valuable insights.
In a Dynatrace Perform 2023 session, Dynatrace colleagues Phillip Kastner, senior product manager, and Paul Schumacher, senior principal product manager, illustrate how Dynatrace Notebooks can tame the complexity of applications. The interactive dashboards allow users to parse through increased data volumes with straightforward, intuitive visualizations of data in context for easy collaboration between siloed teams.
Here’s more insight into the benefits exploratory analytics and collaborative analytics can offer organizations.
Problems arise when data is disjointed
When dealing with vast amounts of data, complexity increases, data silos form, and collaboration across the organization takes a hit. It becomes a challenge for teams to understand, share, and act on the insights derived from their data and to optimize cloud operations, enhance application security, and accelerate the delivery of new innovations.
“The struggle we have today is that access to data is really gated and siloed and also lacks context,” says Schumacher. “It’s become this team’s microservices architecture, that team’s multicloud deployment, another team’s data that they store, process, ingest, etc., and only they have access.”
To be successful, organizations need to provide access to data, while also providing tools to explore that data. “That is what exploratory analytics is for,” Schumacher explains.
Simple, fast access and user flows are crucial
To tackle this problem, Dynatrace has introduced Notebooks, a new interactive capability that enables IT, development, security, and business users to collaborate using code, text, and rich media to build, evaluate, and share insights for exploratory analytics.
It doesn’t matter if it’s traces, logs, events, or entities; Dynatrace Notebooks offer simple, fast user flows so teams can access data and explore it as fast as possible. “If the data is not there, we built an easy way for you to fetch external data and then integrate that into your explorative journey,” says Schumacher. Additional benefits of exploratory analytics include the ability to:
- Create meaningful workflows with automation and applied AI
- Access all Dynatrace data in one place with data lakehouse, Grail
- Slice and dice data, for example, break it down into smaller parts for different viewpoints
- Add flexibility and versatile filtering with variables
- Maintain auto-discovered context of data with intent-based segmentation
Exploratory analytics use cases
“The idea of Notebooks is really that you have those ad hoc questions that come up during your analysis journey like ‘I want to analyze a specific this to create a specific report’ or ‘I want to create a security postmortem.’ It could be basically anything,” says Schumacher.
Starting with an empty document, organizations can then start exploring the data they have available. Exploratory analytics use cases powered by Dynatrace Notebooks include ad hoc data exploration, reports creation, and queries and functions prototyping.
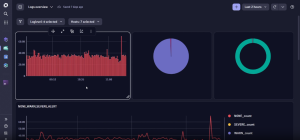
Using Dashboards, teams can configure their tiles. Tiles are a flexible layout that enables teams to use all the data that matters to them specifically in a way they can share it easily. “We really try to level up the dashboard experience for you,” Schumacher notes. Two common use cases of exploratory analytics powered by Dynatrace Dashboards are observing data regularly over time and creating flexible layouts to present on big screens.
Interact with results in Dynatrace Notebooks
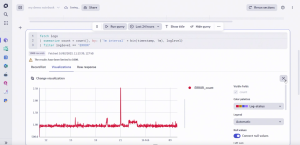
A unique feature of Dynatrace Notebooks is that organizations can interact with and collaborate on the results of analysis and investigation. In addition to tables, teams can also interact directly with the charts.
For example, say a team is interested in a specific number of logs and then decides they’re actually interested in just the error logs. They can interact with the chart by clicking on the left side and filtering for error logs. “The query gets refined and automatically executed for you so that you really have instant results and can look at the data,” Schumacher explains.
“Let’s say I want to look at the error logs during the last 24 hours,” he continues. “I just change the time frame and run it again. You can see there is actually a spike. So that might be something we would like to look into. I can just add a comment here and say, OK, we should look at error log spike, and maybe I will mention Paul, to share so he can have a look.”
In Notebooks, data is stored and persisted. Regardless of how much time has passed, organizations can access the same information today and see what was analyzed back then. All the data that appears in the results remains in the Notebook. Accordingly, no data gets lost or ages out.
View data in context with exploratory analytics
With a data lakehouse approach — and dynamic variables based on Dynatrace Query Language (DQL) queries — all data is captured in one place while retaining its semantic details and context.
Kastner describes the capabilities in more detail. “I could, for example, fetch a list of whole studies based on a specific tag or filter,” he explains. “An operating system, hypervisor, whatever. This filter would then be automatically populated. We can use JavaScript and TypeScript snippets that return my few tribute or variable values.”
“You see the sky is the limit here and maybe we have a look, actually, at what we did with this log level,” Kastner adds. “This is a dynamic filter where we check the logs level fields, and I can then automatically get these dynamic filter options for the data I have on the dashboard.”
Grail and Notebooks give you the tools to explore and analyze your data and learn by directly interacting with the data in the visualizations. This enables you to manipulate queries and create data-driven stories, documents, reports, and so on in an intuitive, collaborative way. For example, a whole team can work on the same Notebook.
Solve problems in less time with easier collaboration
Dynatrace Notebooks provide user-friendly visualizations of the unruly petabytes of observability, application security, and business data that are overwhelming organizations today. The exploratory analytics and collaborative analytics capabilities of the Grail data lakehouse platform allow teams to write simple queries in DQL. They can then immediately share a table or chart with others to gain a better understanding of the problem and more quickly resolve critical issues.

Looking for answers?
Start a new discussion or ask for help in our Q&A forum.
Go to forum