
6 Observability Design Patterns for Microservices Every CTO Should Know
With benefits like scalability, elasticity, reliability, and resiliency, microservices have become the de-facto standard for software architecture. However, building your system with microservices also means the system may have hundreds of distributed components, meaning many potential points of failure.
With such a scale and complexity, getting full-stack visibility into microservices using traditional design patterns is next to impossible. The conventional methods must be more comprehensive to find the root cause of system issues.
Observability allows developers to explore the unknown issues lying among various microservice components. It also lets developers know what’s happening inside the production environment so they can shorten the delivery cycle, prevent downtime, and optimize performance.
Now, there are several design patterns available through which you can incorporate observability into microservices. This article discusses the 6 most useful observability design patterns for microservices that every CTO can benefit from.
Let’s dive in!
6 Observability Design Patterns for Microservices
Adopting observability design patterns is not just about collecting telemetry data such as logs, metrics, and traces. Instead, it’s more about working with a data-driven approach during debugging and establishing a concrete feedback system to improve an app’s performance and security.
Here are the 6 most helpful observability design patterns for microservice architecture:
1. Distributed Tracing
Trace is a unique component that distinguishes observability from other monitoring mechanisms. Distributed tracing tracks application requests as they flow from frontend devices to backend services and databases. It helps SRE/DevOps teams quickly understand and scrutinize the technical glitches that cause infrastructure disruption.
Some core benefits of distributed tracing are:
- Provides information about various service dependencies in a microservice architecture
- Ensures resiliency and fault tolerance in case of system failures
- Ensures end-to-end visibility across distributed infrastructure
How does distributed tracing facilitate observability?
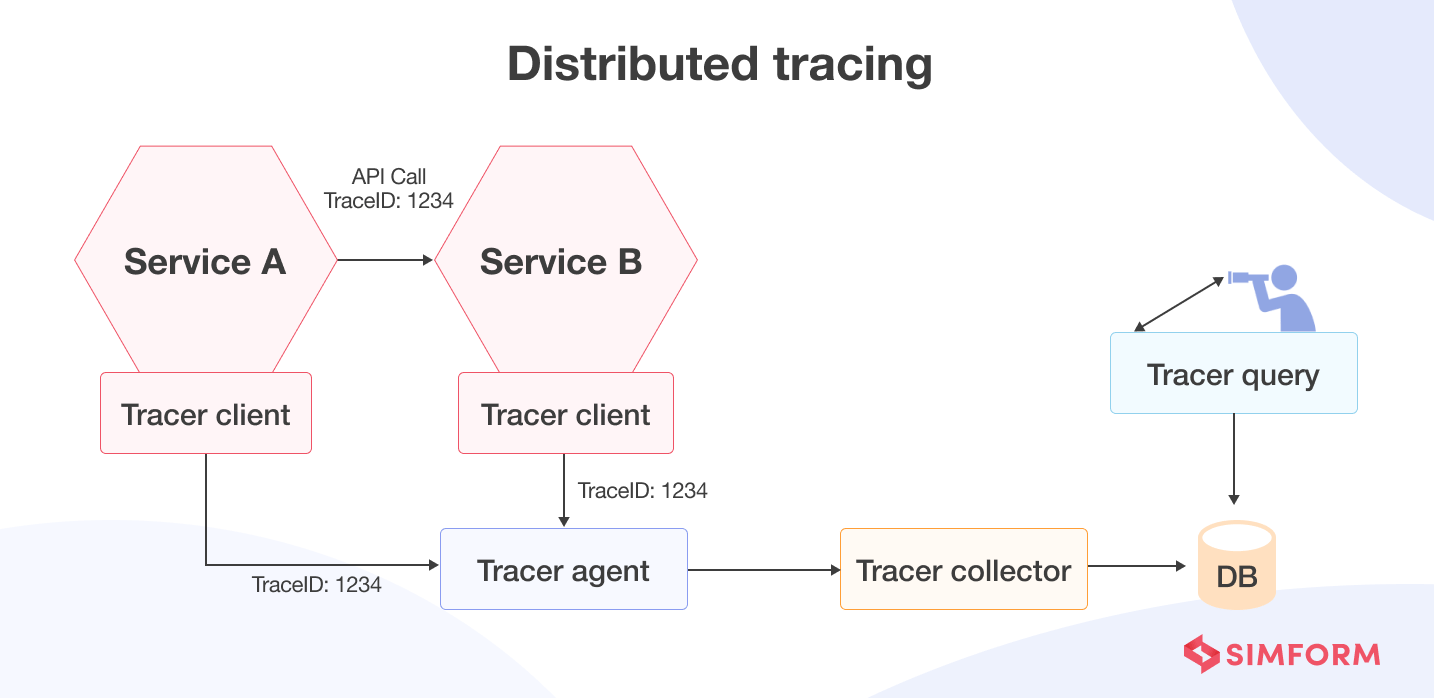
Microservices scale independently. Therefore, there are usually multiple iterations of a single service running across different servers. Because hundreds of such services run simultaneously, getting visibility into each interaction becomes nearly impossible. As a result, evaluating whether the services are running correctly becomes a challenging task.
Distributed tracing solves this problem by automatically tracking requests through each service or module and providing end-to-end visibility through distributed infrastructure. Software analysts, SRE professionals, or someone from the DevOps team can then observe each iteration to find the root cause of the issue affecting the performance of microservices.
Let us try understanding how distributed tracing facilitates observability with an example of an online video game system.
A gaming system is the epitome of a microservice-based architecture with millions of users interacting with various services. Distributed tracing helps to understand users’ journeys and how they interact with each service. It traces all the touchpoints, including every user’s location, their interaction with other players, every item they acquire, the times they start and end the game, etc.
Based on these touchpoints and detailed tracing through microservices, SREs can find the root cause of issues as soon as they arise, thus ensuring high availability and peak performance of the system. Root cause analysis is one of the core promises of observability, and distributed tracing does precisely that.
2. Health Check API
Sometimes, it may happen that a particular service instance is running but is incapable of processing any request. Such services can be termed “unhealthy.” Whenever an instance of an unhealthy service occurs, monitoring systems should generate an alert.
Another example of an unhealthy service would be an instance that started recently but might have frozen due to a software bug. A service running but not functioning correctly because of a loss of connection with the database would also be considered an unhealthy service.
Development teams have begun to implement health check APIs to mitigate the problems arising from unhealthy services.
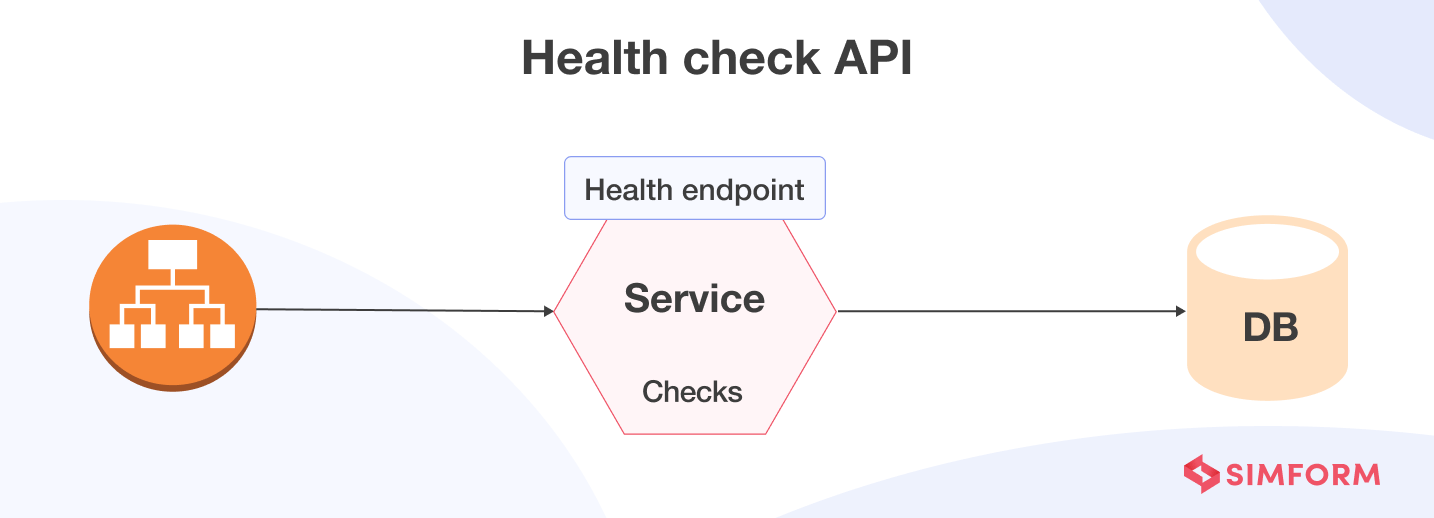
A health check API is a REST service implemented within microservice components. It returns the operational status of a service and the service’s ability to connect with other dependent services. This way, the health check API helps developers know whether the microservices are working as desired or if troubleshooting is necessary. It also ensures the services are available most of the time.
How does health check API facilitate observability?
The ideal health check API mechanism would continually find the “unheathy” services and stops rerouting traffic to those instances. Implementing health check APIs also automates the recovery process. If the health check of a service fails, the automated recovery process terminates or recreates the affected service. Lastly, it notifies the deployment infrastructure whether the service is ready to handle the traffic after troubleshooting.
Whether it’s the dependencies, system properties, database connections, endpoint connections, or resource availability, a health check can evaluate everything a typical microservice requires. A microservice is considered available only when all the health checks configured within it are successful. If one or more checks fail, that particular microservice is considered unavailable.
Let’s understand how health checks facilitate observability with an example of banking applications.
Millions of end users are logging into banking apps all the time, and transactional activities are going on 24*7. So, it’s paramount for banking applications to always remain available. So their development teams set up separate health checks for each service to ensure high availability and performance. For example, separate health checks are configured on the login microservice, the balance transfer microservice, the bill pay microservice, etc.
If these checks fail, developers can automate the recovery and restart the service through the respective health check API. That’s how most large-scale, microservices-based applications mitigate downtime arising from unhealthy services.
By constantly monitoring the health of all the services in a distributed application and taking corrective action for their recovery, health check APIs have become one of the most important design patterns to facilitate observability.
3. Log Aggregation
Logging is an essential part of effective troubleshooting. It’s an ongoing record of all the events in an application. When a service encounters an issue, a log message can help you find out the specific event that caused the disruption by describing what happened in the system and when. So, with the help of logging, IT teams can quickly identify the event that may have disrupted the production environment.
However, retrieving information about service instances isn’t easy in the case of microservices architecture with thousands of distributed components. The log entries get spread across multiple services, each with its own log files. Also, a service instance only lasts for a short time. So when it shuts down, you can’t access its log files.
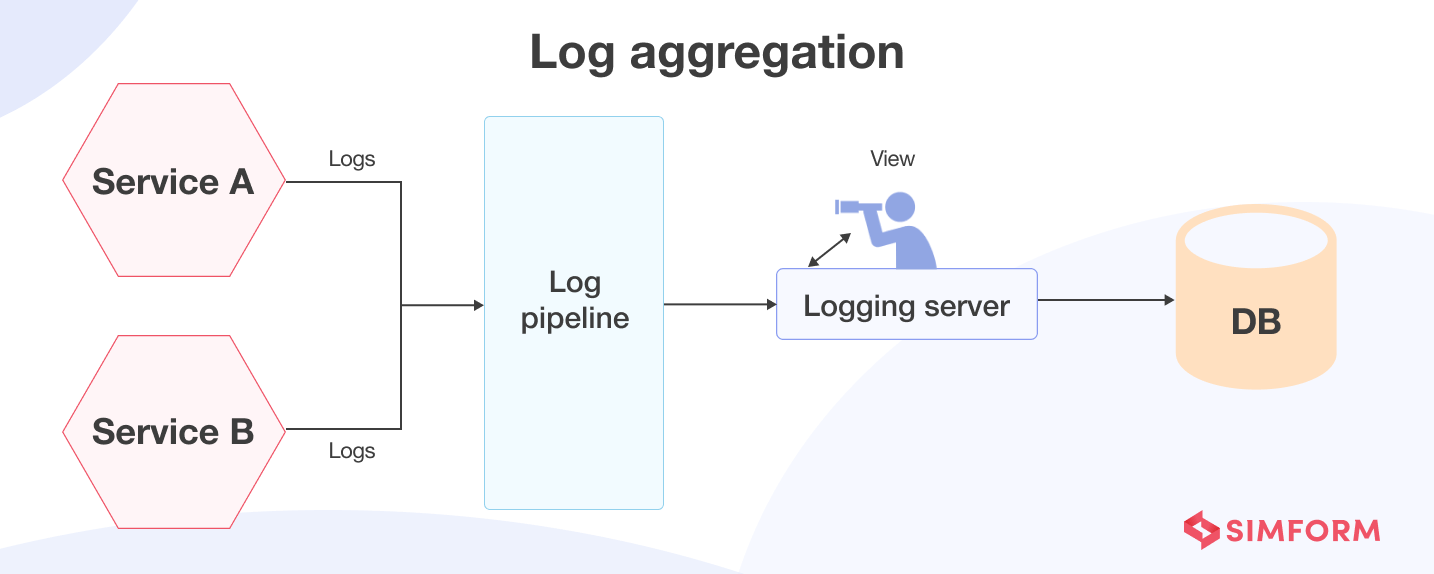
To overcome these challenges, development teams have adopted log aggregation as a microservices design pattern. Log aggregation uses a centralized log service that accumulates log files from every service instance. IT teams can retrieve, visualize, and analyze logs through the centralized log service.
How does log aggregation facilitate observability?
Log aggregation makes it easier for the development team to manage and coordinate essential log data. Maintaining a central log repository also helps investigate specific problems and correlate them with individual services. For example, developers can easily search and analyze any log files and set automated alerts when certain pre-defined messages appear in logs.
Thus, accurate logging and aggregating log files provide full-stack visibility into the production environment. And so, observability-driven development becomes easier with the log aggregation design pattern.
4. Audit Logging
Audit logging (auditing) records all user activities in the database. An audit log comprises an event that occurs as a result of a user activity, the user’s identity, the action taken by them, the time at which they took action, and the entity affected by the event.
Audit logs are different from the general system logs we discussed above. While regular system logs are recorded to help developers troubleshoot any errors, audit logs are maintained to keep a sequential record of user activity within the organization to ensure compliance with relevant industry regulations and your organization’s business policies.
How does audit logging facilitate observability?
There are a few ways you can audit microservices-
- Adding audit logging code to business logic: Each service method creates an audit log entry to save it in the database.
- Aspect-oriented programming (AOP): Define advice that intercepts every service call and creates an audit log using an AOP framework.
- Utilize event sourcing: Capture every change made to the application state in an event object so that it’s easier to roll back to the previous state in case of failure.
Audit logs equip IT teams with valuable information about admin activities, data access and modifications, log-in failures or user denials, and system-wide changes. Reviewing audit logs enables SRE teams to investigate security breaches, ensure compliance with regulatory requirements, and analyze user activity.
Getting to the thick of things and finding the fundamental reason behind an issue is a core feature of observability, and audit logs significantly help the development teams achieve that objective.
5. Exception Tracking
An exception may sometimes occur despite building highly reliable systems with zero bugs. When it does, it’s crucial to find its root cause and fix the problem.
In a monolithic app, exceptions are traditionally recorded and analyzed in log files, but it doesn’t work for a distributed architecture like microservices. A better approach to managing exceptions in microservices is to use an exception-tracking service that works as a centralized repository of all the recorded exceptions. It de-duplicates exceptions, generates alerts, and informs developers to take appropriate action.
There are two exception types you may need to deal with-
- Checked exceptions: These exceptions are caught at compile time. Examples of checked exceptions are SQLException and ClassNotFoundException.
- Unchecked exceptions: These exceptions are spotted during the run time. Examples of unchecked exceptions are NullPointerException and IllegalArgumentException.
How does exception tracking facilitate observability?
Exception tracking offers a way of gaining early insight into production problems. When an exception occurs, you can track it back to its root cause and resolve the problem before it can impact systems or user experience.
Any reliable exception-tracking tool can record exceptions and share them with developers for rectification. Early problem detection and a proactive approach are crucial aspects of observability, and exception tracking aligns with those principles.
6. Application Metrics
Application metrics are a numerical representation of data that determines the current state of the service or particular component. It provides a holistic view of the system’s health and performance.
Some of the common application metrics are:
- Infrastructure-level metrics: such as CPU, memory, and disk utilization
- Application-level metrics: such as service request latency and several requests
- End-user metrics: such as application load times
How do application metrics facilitate observability?
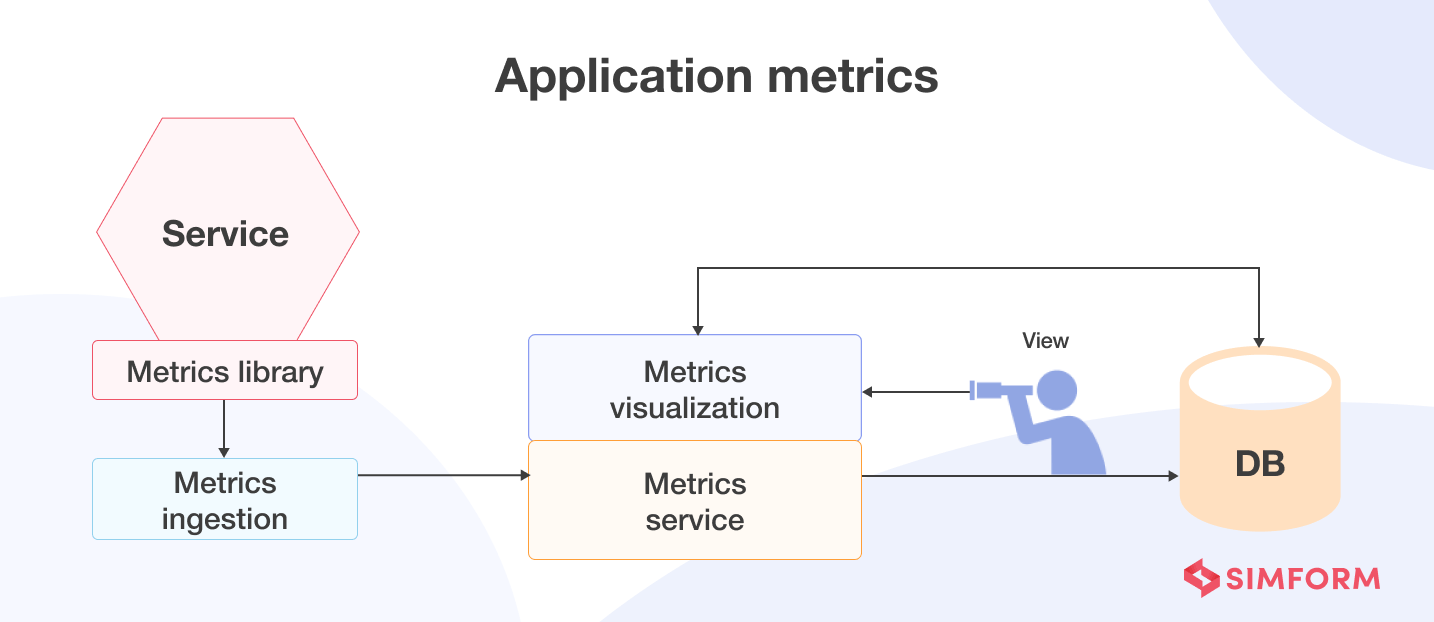
In a microservices-based application, gathering application metrics is the responsibility of developers. But, first, they need to set up instrumentation for various services to collect the required data that exposes the system’s health and performance.
There are two models for aggregating metrics from a service:
- Push: The service pushes metrics to the metrics service
- Pull: The metrics services pull metrics from the service
With the help of accurate metrics derived from either of these methods, developers or the SRE team can observe the IT system and fine-tune it for better performance.
Planning to incorporate observability design patterns for IT systems?
Most failures in microservices occur during the interactions between services. Observability makes it much easier to see what is happening when your services interact. Thus, it enables you to build a more efficient, resilient, and secure microservice architecture.
We at Simform reaped the benefits of some of these observability design patterns when we partnered with the global swimming federation to optimize their app performance and create a next-level experience for fans. Their targets were marquee events such as the Olympics, Swim Series, and Swimming World Cup.
The client’s application was based on a microservice architecture with plenty of distributed components. So, to ensure reliability and resilience, we used infrastructure observability and facilitated high values for metrics like system uptime, response time, the number of requests, etc. As a result, our client created 5x more fan engagement and end-user interactions also got faster by 70%.
Our complex engineering experts excel at crafting observable solutions that help our clients solve their problems efficiently. If you are looking for a digital engineering partner to equip your systems with observability, resilience, and reliability, we would love to chat with you! You can contact our team here, share your requirements, and our tech consultants will get in touch with you in a day or two.