Experimenting with the Server Timing API

You may be familiar with the saying “If you can’t measure it, you can’t improve it”. This saying couldn’t be more true when it comes to web performance. In our browsers today, we already have great APIs such as Navigation Timing and Resource Timing built-in, which allow us to measure the front end performance of our websites.
While these APIs provide us with the ability to measure front end performance, they don’t give us any insight as to what is happening behind the scenes - how are requests being routed? How long is the database taking to respond? In order to get a well-rounded picture of the overall performance of your website, it’s important to see the timings from the frontend right through to the backend code. Fortunately, such a feature already exists and is known as the Server Timing API.

While it is already possible to capture backend information using application performance management tools (think New Relic, AppDynamics, etc.) - using the Server Timing puts all of your information in one place, ready to access via the Developer Tools in your browser.
The Server Timing API allows the server to communicate performance metrics about the request-response cycle to the browser which can then be collected and used to improve the performance of your application. By recording the amount of time that a given event takes, you can expose these timings in the HTTP response that is returned from the server in the HTTP headers. Server Timing was published by the Web Performance Working Group as part of the W3C and is currently listed as a proposal. While this is currently being considered as a standard, there is no reason why you can’t start using it today. After all, it is just a few headers added to the HTTP response! For example, the HTTP headers might look like the text below.
Server-timing: 0=68.96; "Routing"
Let’s break the example above down in easier to understand chunks. Firstly, the HTTP response contains the server timing header. Next, the header contains the duration of the event and finally the label of the event that was recorded (“Routing” in this case).
Where I work we primarily use Node.js and Express behind the scenes to develop our web applications. There are so many useful node packages out there that have been developed by the open source community that make building for the web a breeze. I recently stumbled upon a Node.js package that allows you to easily add Server Timings to your response headers. This package takes the hard work out of writing your own code and allows you to quickly and easily add Server Timings to your HTTP responses.
If Node.js isn’t your weapon of choice - fear not - there are other libraries in different languages that have been built to support the Server Timing API. Even if this doesn’t exist for the language / framework of your choice, you can still roll your own by returning the timings in your HTTP responses.
Let’s dive into some code! In order to add the Node package, you will need to navigate to the directory of your web application and then enter the following command to install the package:
npm install server-timings --save
Once the download has completed, you need to update your code in order to start recording different parts of your backend code. In order to get an idea of this in action, let’s look at the example below.
The code above is a really basic example of how you might add server timings to your Node.js application. Firstly, you will need to include a reference to the server-timings package. Next, you need to wrap the timings function around the code that you’d like to measure. You can do this by adding a timings.start() and a timings.end() function before and after the code that you’d like to measure. Both of these functions also need to be labelled with a unique name in order for you to identify them.
Once the above code is in place, fire up your web application in the browser. You can use the developer tools of any browser to inspect the HTTP headers, but both Opera and Chrome Developer tools have added functionality that displays this information visually. If you inspect the HTTP request and response for the current URL, and head to the timing tab, you should see something similar to the image below.
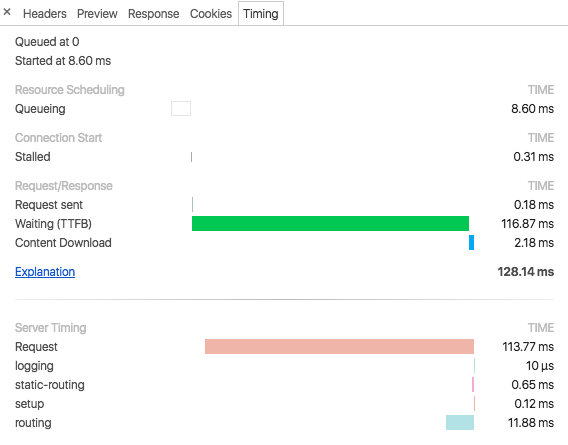
In the image above, you should see a new section added to the Timing tab entitled “Server Timing”. The image above shows the Server Timing headers that have been read in from the HTTP request and are displayed in the browser alongside the frontend load times.
If you’d like to see this in action, I recommend heading to this link where you can see these headers in action in the real world.
With these timings in place, you’ll be able to see the full picture and get a well-rounded idea of your response times from the frontend right through to the backend of your application. If you’d like to learn more about Server Timings, I recommend checking out this link for more information.