
Excessive memory allocations or leaks can harm your organization’s clusters and lead to crashes or unresponsive services. To avoid this, it’s essential to monitor your KPIs for memory allocation and object churn as measures of the performance and health of a system.
Luckily, Dynatrace provides in-depth memory allocation monitoring, which allows fine-grained allocation analysis and can even point to the root cause of a problem.
While memory allocation analysis can show wasteful or inefficient code, it can also reveal different problems, one of which we’ll examine in this blog post. This real-world use case, caused by an issue in a customer environment, illustrates how Dynatrace memory analysis capabilities can contribute to root cause analysis within a Dynatrace Cluster.
The typical ratio is about 1.5X higher, but now it’s 3X higher—why?
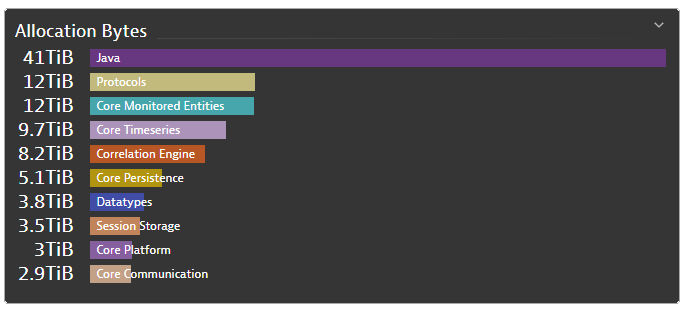
At Dynatrace, we use dashboards to get a quick overview of the status of monitored services. One such dashboard is the Allocations dashboard which gives an overview of memory usage and allocations for an entire production environment, grouped by APIs.
We recently extended the pre-shipped code-level API definitions to group logical parts of our code so they’re consistently highlighted in all code-level views. For instance, everything related to our correlations engine is dark orange, and the different protocols are mustard colored. Another benefit of defining custom APIs is that the memory allocation and surviving object metrics are split by each custom API definition. So we can easily keep track of them on the Allocations dashboard.
One day while looking at a single cluster, we saw that the memory allocations were abnormally high. While the amount of bytes allocated for the Java API is typically 1.5X the average, in this case, the allocation for the Java API was more than 3X higher than the average, 41 TiB. What could be causing this?
We looked at one of the Dynatrace instances to investigate what was going on. Garbage collection suspension and CPU usage looked healthy. We know from experience that an average value of ~1% GC suspension is healthy, so it was still unclear what was causing the high number of allocations shown on the dashboard.
In Memory profiling view, we would normally expect to see allocations for protocols and database calls at the top of the list of allocation hotspots. In this case, all the top contributors are located in the cluster platform code (as shown by the package names).
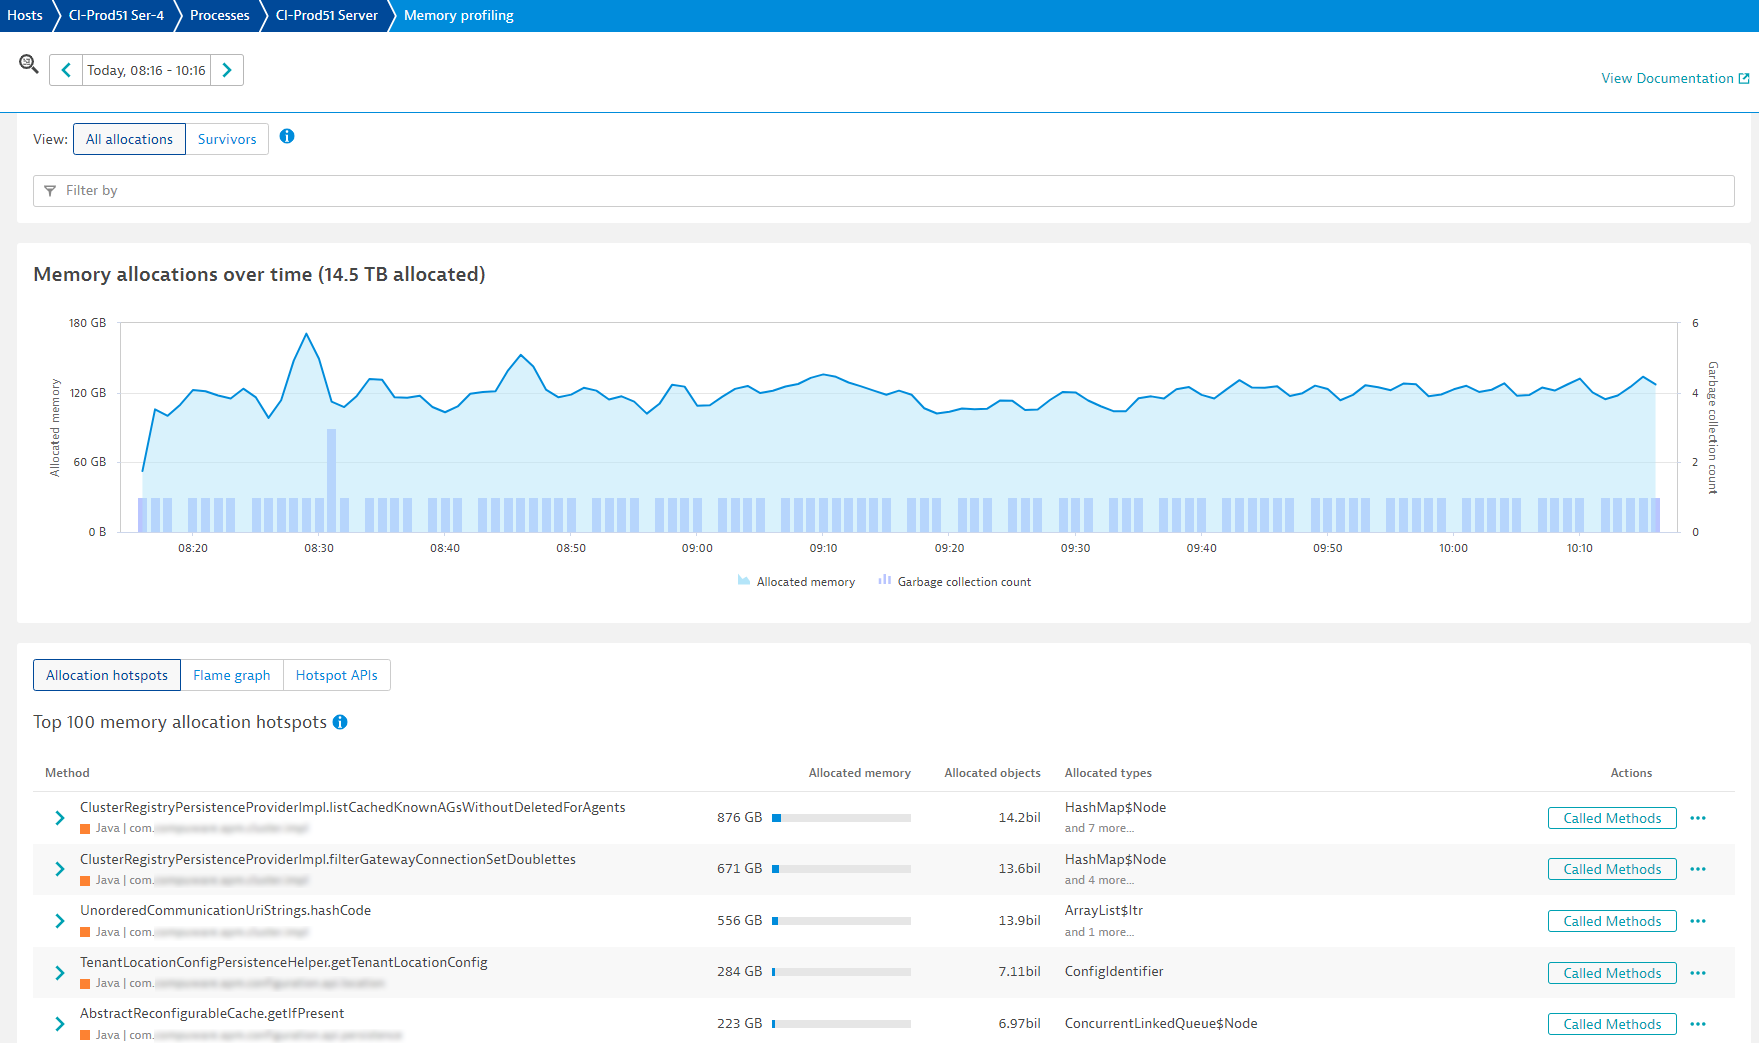
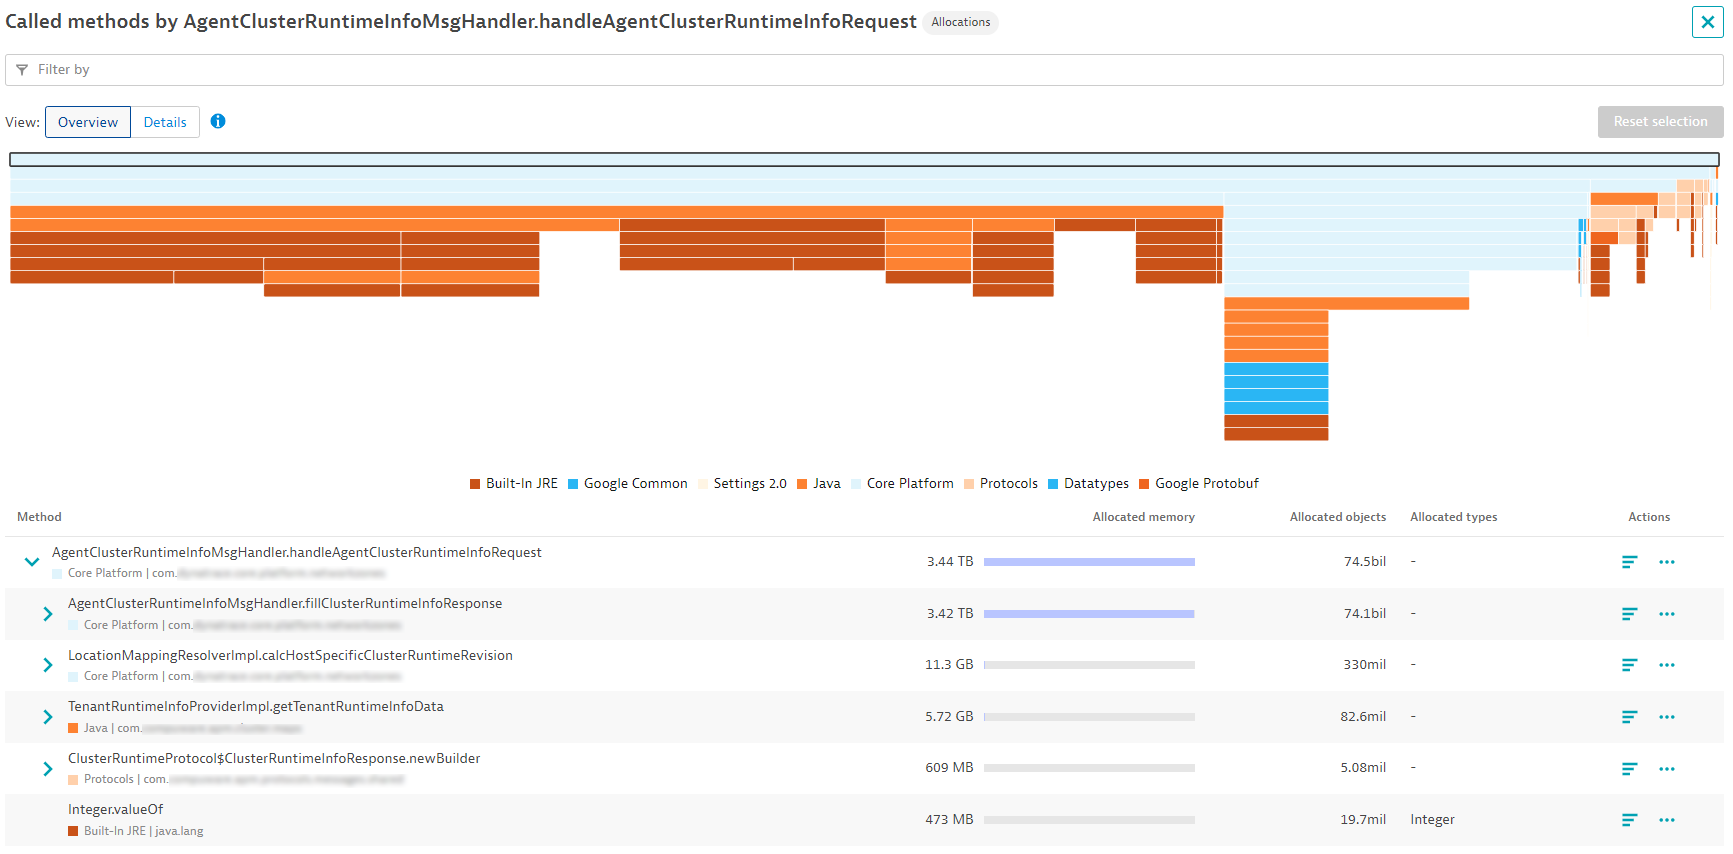
Looking at the call stack of the top allocation, a familiar message handler can be identified, AgentClusterRuntimeInfoMsgHandler. This handler is responsible for sending configuration updates regarding usable communication endpoints (in other words, available ActiveGates) to connected OneAgents. Typically, the configuration does not change, and no responses are created for the OneAgents. In this case, the server appears to be continuously building responses, which is an expensive operation that indicates either we have a bug in the revision calculation of our message handler, or the list of ActiveGates is constantly changing, forcing frequent revision recalculation.
Selecting Called Methods next to the message handler opens the profiling view, which shows the full extent of the impact. The handler is responsible for ~3.5 TiB in allocations within 2 hours, allocating and removing about 75 billion objects during the process.
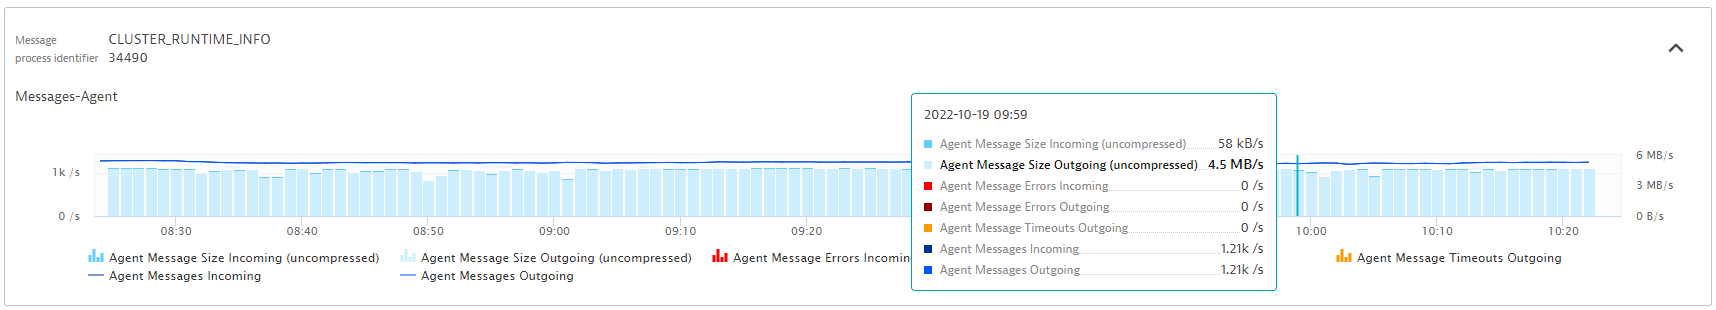
Verification with Dynatrace custom metrics
As Dynatrace also exposes key metrics about our message handler via JMX, we can use those metrics to investigate further. In Further Details on the Host page, we instantly have the confirmation we’re looking for: We were constantly sending ~4.5MiB/s of ClusterRuntimeInfo responses, while on a healthy system the response size is typically 50KiB/s or less (depending on the number of connected agents).
Since other production systems are doing fine at the same time, a bug in the code might not be the problem. Instead, we investigate to see if we have many recalculations due to constantly changing ActiveGate connections.
Luckily, we have an audit log for ActiveGate connectivity on the Dynatrace Cluster, which can be seen in the log viewer.
Finding the root cause of the problem
In the audit log file, we can see that many ActiveGate registration and deregistration activities are taking place. By adding a filter for a single ActiveGate ID and increasing the timeframe, a pattern emerges: this ActiveGate is reconnecting once per hour.
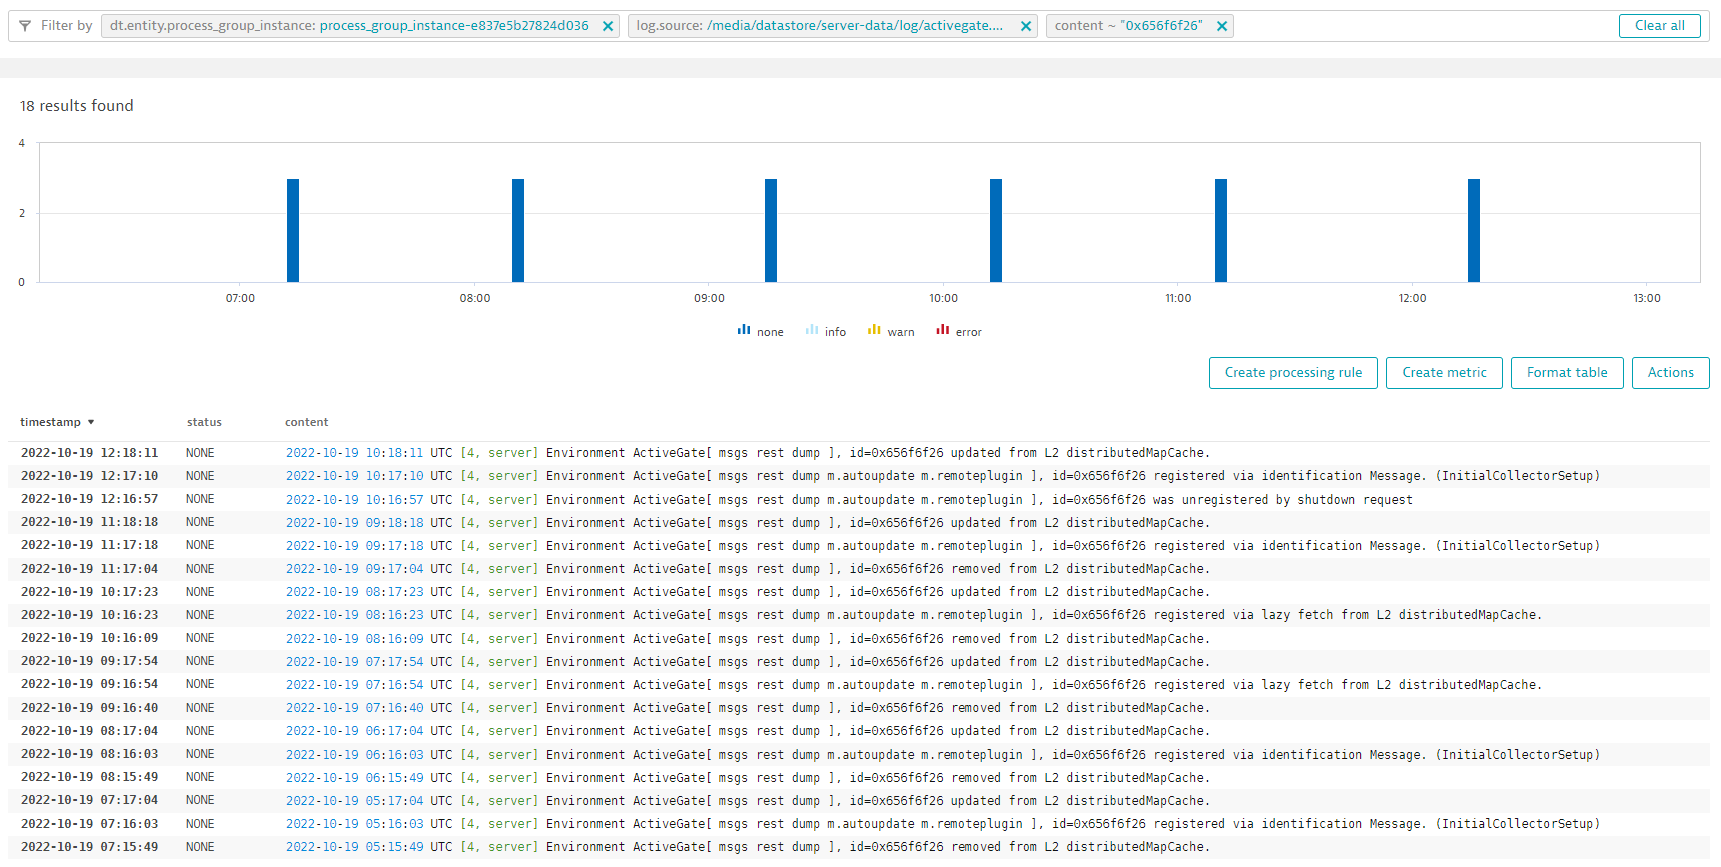
The other ActiveGates do the same at separate times, which explains the server behavior: every time an ActiveGate connects or disconnects, the endpoint list changes and so must be resent to the deployed OneAgents. The customer has more than 100 thousand OneAgents connected, which consumes many resources on the server and, more importantly, on the network. Following these insights, we contacted this customer to share our findings.
Conclusion
Memory allocation analysis can show wasteful or inefficient code, but it can also reveal unexpected problems, such as, in this case, numerous configuration updates sent out due to a problem on the customer side. Even though the server could easily handle the memory allocations (GC suspension was around 1%), the allocations showed up prominently, and they can be seen as an indicator of bugs in the system.
You can find out more about Dynatrace memory allocation analysis in our documentation:
New to Dynatrace?
Visit our trial page for a free 15-day Dynatrace trial.


Looking for answers?
Start a new discussion or ask for help in our Q&A forum.
Go to forum