
Dynatrace saves time for site reliability engineers (SREs) by bringing the full power of Davis® AI to exploratory and proactive analyses. When a negative trend arises for an important service level indicator (SLI)—for example, a slowly depleted error budget for availability, request latency, or throughput—SREs can now trigger Davis to perform exploratory analysis. Davis surfaces all signal anomalies connected to the slowly depleted error budget and provides an explanation. This allows SREs to understand the origins of unexpected changes. Davis considers all domain and topology knowledge to identify corresponding observability signals.
SREs typically start their days with meetings to ensure that various stakeholders—such as clients, IT team leaders, Kubernetes platform operations team leaders, and business leaders—that their projects are developing smoothly. Each group of SREs has different needs and goals that must align at the end of the day. To ensure continuous availability, it‘s essential to proactively analyze potential problems and optimize the environment in advance to minimize the negative impact on users and improve user experience.
With Davis, Dynatrace enables rapid MTTR for SRE and DevOps teams by identifying the path to the root causes of detected problems.
With the increasing complexity of cloud-native environments, the number of observed signals grows, as does the effort required for humans to find and analyze these signals. This increased complexity makes it impossible to analyze all relevant situations. The proper focus and best optimization level must be chosen wisely to get the most out of the available time.
Just one click to your preventive analysis
Dynatrace now goes a step further and makes it possible for SREs and DevOps to perform proactive exploratory analysis of observability signals with intelligent answers. This is done by extending our Davis AI engine with a new capability that considers domain and topology knowledge. This significantly reduces the time needed to assess and analyze potential problems and helps prevent production outages.
If one or more anomalies occur, all relevant observability data in the domain context can be displayed with just one click. This is done without the need to create custom dashboards and is complemented by efficient analysis capabilities that automatically guide SREs to potential root causes of anomalies, enabling more efficient work and freeing up time for essential workflows.
“The work of SREs and platform owners is becoming increasingly complex due to the explosion of information that we need to deal with to operate a production environment properly. With Davis exploratory analysis we can now automatically analyze thousands of signals before incidences even arise. This saves valuable time for engineers and architects for innovation.” Henrik Rexed, Open-Source Advocate
Let’s look at an example related to Kubernetes.
Example: Unintended side effects of introducing service mesh technology
With the distribution of Kubernetes, there is growing interest in using service mesh technology to add secure service-to-service communication and fine-grained management of ingress/egress traffic rules while keeping platform operations teams in the driver’s seat.
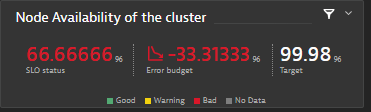
In this example, a K8s platform operator installs a service mesh that uses a sidecar container as a proxy managing the communication with the various services of the cluster. This introduces an unwanted pattern when used with CronJobs. The sidecar container remains active even when the job is already completed. Since a CronJob pod is only deleted after all containers have been stopped, such pods continue to run and block the requested resources indefinitely. These “zombie” pods are never removed without human intervention, resulting in an accumulation of blocked but unused resources. In this case, a CronJob that creates a new pod every time it runs is executed periodically, for example, once an hour. This leads to systematic growth of used resources and could lead to an unhealthy cluster where zombie pods slowly consume all the resources of the nodes and negatively impact the cluster-health SLO. The SLO provides a ratio of the number of healthy nodes to unhealthy nodes. The SRE begins investigating this issue when less than 90% of the nodes are healthy.
Avoid the zombie-pod apocalypse with Davis exploratory analysis
Now let’s look at how to diagnose and prevent such a zombie-pod apocalypse, which can occur when introducing service meshes or other tools deployed via sidecar containers. You’ll see how to prevent zombie pods and how Kubernetes best practices could have reduced the impact of this problem.
First, the SRE notices a deviation in an SLO representing the health of the K8s cluster.
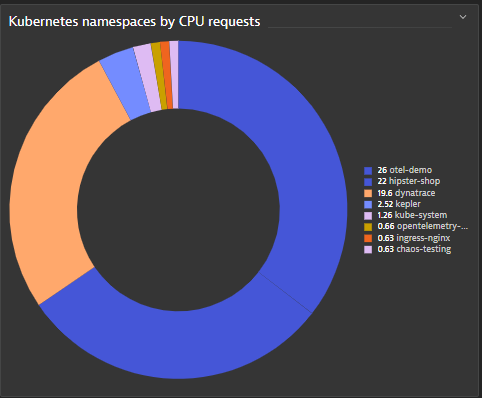
The SRE needs to identify the namespace that’s consuming this cluster CPU. Looking at the “Kubernetes cluster overview,” it’s clear that the Otel-demo namespace is the namespace allocating most of the CPU requests of the cluster.
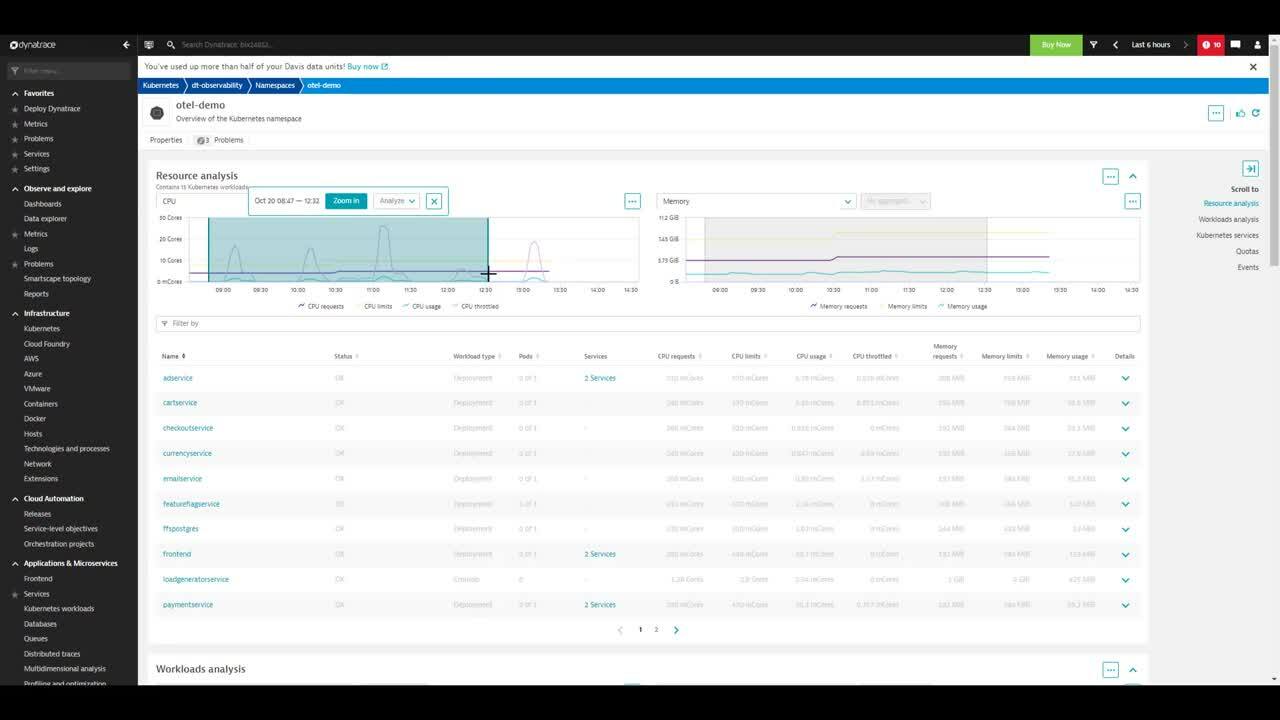
With this knowledge, the SRE analyzes the otel-demo namespace and notices a time frame during which there were multiple CPU resource spikes. The SRE selects this time frame for Davis exploratory analysis, which takes domain knowledge and topological context into account, and analyzes the problematic workload.
This workload is a CronJob, which creates new pods that run concurrently, rather than sequentially. This CronJob is responsible for the increased CPU usage due to the accumulation of running pods.
Looking at the loadgeneratorservice workload, the SRE can further analyze the reasons behind the increased number of pods. The available resources are not able to serve the increased load. At this point, the SRE contacts the K8s operator, notifying them that they need to immediately scale their nodes horizontally or vertically to remediate the issue.
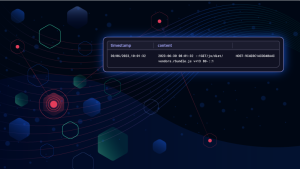
Following this initial bandaid solution of adding resources, the K8s operator can dig deeper into the problem. Using Dynatrace to analyze the details of the pod, the K8s operator understands that, while the job container has already exited successfully, the sidecar proxy injected by the service mesh is still running, which prevents the pod from stopping and being deleted.
Following additional research on this issue, the operator finds that the service mesh provides a specific endpoint for this scenario, which must be called by the CronJob before it exists. This information can be passed along to the responsible teams who can resolve this problem.
How to prevent this with K8s best practices
There are three best practices that could have drastically reduced the impact of this problem. First, the application teams responsible for CronJobs could have leveraged the activeDeadlineSeconds spec of a job, ensuring the termination of all running pods created by a job after a fixed time. In this case, the jobs would have exited with a failed status due to the sidecar still running after the timeout period.
The other recommended CronJob setting is to set concurrencyPolicy to Replace. This setting will avoid having multiple pods running and will only leave one pod for this job. With this setting, there would have been an indicator that something is not quite right and at least there wouldn’t be an accumulation of running pods consuming additional cluster resources. Adding this requirement for every job could be enforced with policy agents like Open Policy Agent or Kyverno. Another counter-measure is namespace quotas, which would have at least reduced the scope of exhausted resources to a single namespace instead of the entire cluster.
Having now explained two Kubernetes best practices for reducing the impact of this problem, it’s time to share our recommended solution, which completely solves this issue. When running CronJobs in combination with sidecar proxies, the solution is to delete the sidecar proxy running alongside the same pod at the end of your job.
But how can a proxy container be deleted? This is possible with the help of a feature implemented by most service mesh solutions in the market: An HTTP endpoint offered by the proxy container allows you to stop the container gracefully.
You can do this by sending the following:
– For istio: HTTP post http://localhost:15020/quitquitquit
– For linkerd: HTTP POST localhost:4191/shutdown
How to get started with Davis exploratory analysis
The new Davis exploratory analysis feature will be released at the beginning of November with Dynatrace SaaS version 1.254.
The new Kubernetes web UI pages shared in this blog post will be available in January 2023.
There are many more use cases
Besides avoiding a Kubernetes zombie-pod apocalypse, various other use cases for exploratory Davis Analysis exist. In fact, this new analysis feature is available not only for Kubernetes pages but also for the host overview page, services pages, queues pages, container pages, and domain-specific unified analysis pages, like F5, or SNMP.
We’ll cover all these scenarios in future blog posts, so please stay tuned for more details.
Kubernetes in the wild report 2023
This Kubernetes survey shows how organizations actually use Kubernetes in production. The study analyzes factual Kubernetes production data from thousands of organizations worldwide that are using the Dynatrace Software Intelligence Platform to keep their Kubernetes clusters secure, healthy, and high performing.


Looking for answers?
Start a new discussion or ask for help in our Q&A forum.
Go to forum