
Implementing service-level objectives enables organizations to improve software development quality and application performance. Here are best practices and guidance for implementing SLOs.
As more organizations embrace microservices-based architecture to deliver goods and services digitally, maintaining customer satisfaction has become exponentially more challenging. Implementing service-level objectives (SLOs) has become a vital method for meeting service-level agreements that ensure great user experiences.
A service-level objective is a key element within a larger service-level agreement, or contract of sorts, between a provider and a customer.
By implementing service-level objectives, teams can avoid collecting and checking a huge amount of metrics for each service. Instead, they can ensure that services comport with the pre-established benchmarks.
When organizations implement SLOs, they can improve software development processes and application performance.
- SLOs improve software quality. Service-level objectives help teams define an acceptable level of downtime for a service or a particular issue.
- SLOs aid decision making. SLOs can be a great way for DevOps and infrastructure teams to use data and performance expectations to make decisions, such as whether to release and where engineers should focus their time.
- SLOs promote automation. Stable, well-calibrated SLOs pave the way for teams to automate additional processes and testing throughout the software delivery lifecycle.
- SLOs minimize downtime. SLOs enable DevOps teams to predict problems before they occur and especially before they affect customer experience.
But being able to define correct SLOs can be a challenging journey. Every team involved must agree for an SLO to be practical and applicable. The Dynatrace ACE services team has experience helping customers with defining and implementing SLOs. In what follows, we explore some of these best practices and guidance for implementing service-level objectives in your monitored environment.
Best practices for implementing service-level objectives
So how can teams start implementing SLOs? First, it helps to understand that applications and all the services and infrastructure that support them generate telemetry data based on traffic from real users. This telemetry data serves as the basis for establishing meaningful SLOs.
Good service-level objectives start with the following best practices:
- Define meaningful reliability measurements that consider user satisfaction and business objectives
- Establish realistic SLO targets based on statistical and probabilistic analysis
- Develop error budgets to help teams measure success and make data-driven decisions
- Implement a centralized approach to instrumenting and measuring SLOs
- Use SLO data to communicate with stakeholders and drive better business decisions
Dynatrace provides a centralized approach for establishing, instrumenting, and implementing SLOs that uses full-stack observability, topology mapping, and AI-driven analytics. Using data from Dynatrace and its SLO wizard, teams can easily benchmark meaningful, user-based reliability measurements and establish error budgets to implement SLOs that meet business objectives and drive greater DevOps automation.
Here’s the process we follow for defining reliability measurements that satisfy business requirements. This process includes benchmarking realistic SLO targets based on statistical and probabilistic analysis from Dynatrace.
1. Define an application’s critical path
For a given application, not all services are equally important. The critical path is the set of services required for the application to provide its core functionality. If any of the services in the critical path fails, customers’ needs aren’t met, which may result in a service call, or worse, lost business. For more information about defining critical paths, see the article Understanding your application’s critical path.
Dynatrace makes it easy to understand the service flow of your application through its Service flow feature.
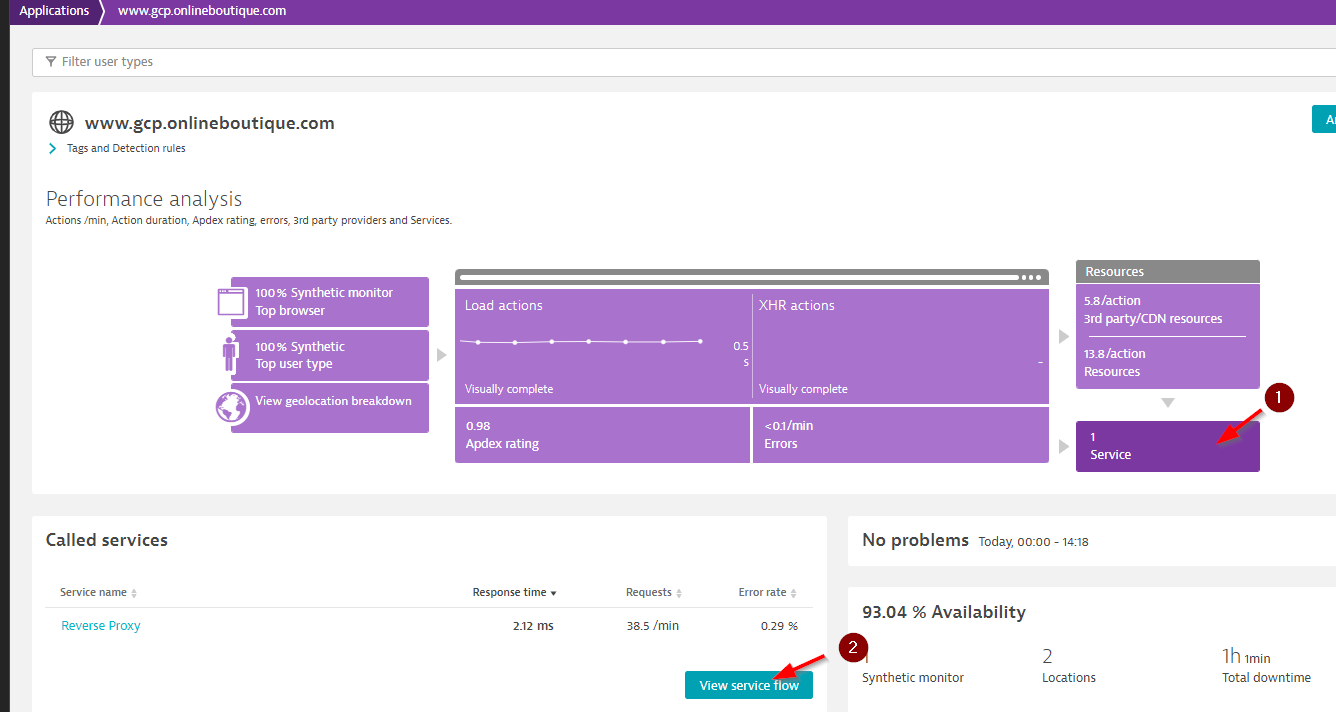
Service flow shows you which services an application calls on. In this example, “Reverse proxy” and “Front-end server” are clearly in the critical path. Without them, the application won’t work. In this example, “hipstershop.currency,” “hipstershop.checkout” and “hipstershop.cart” are also part of this critical path.
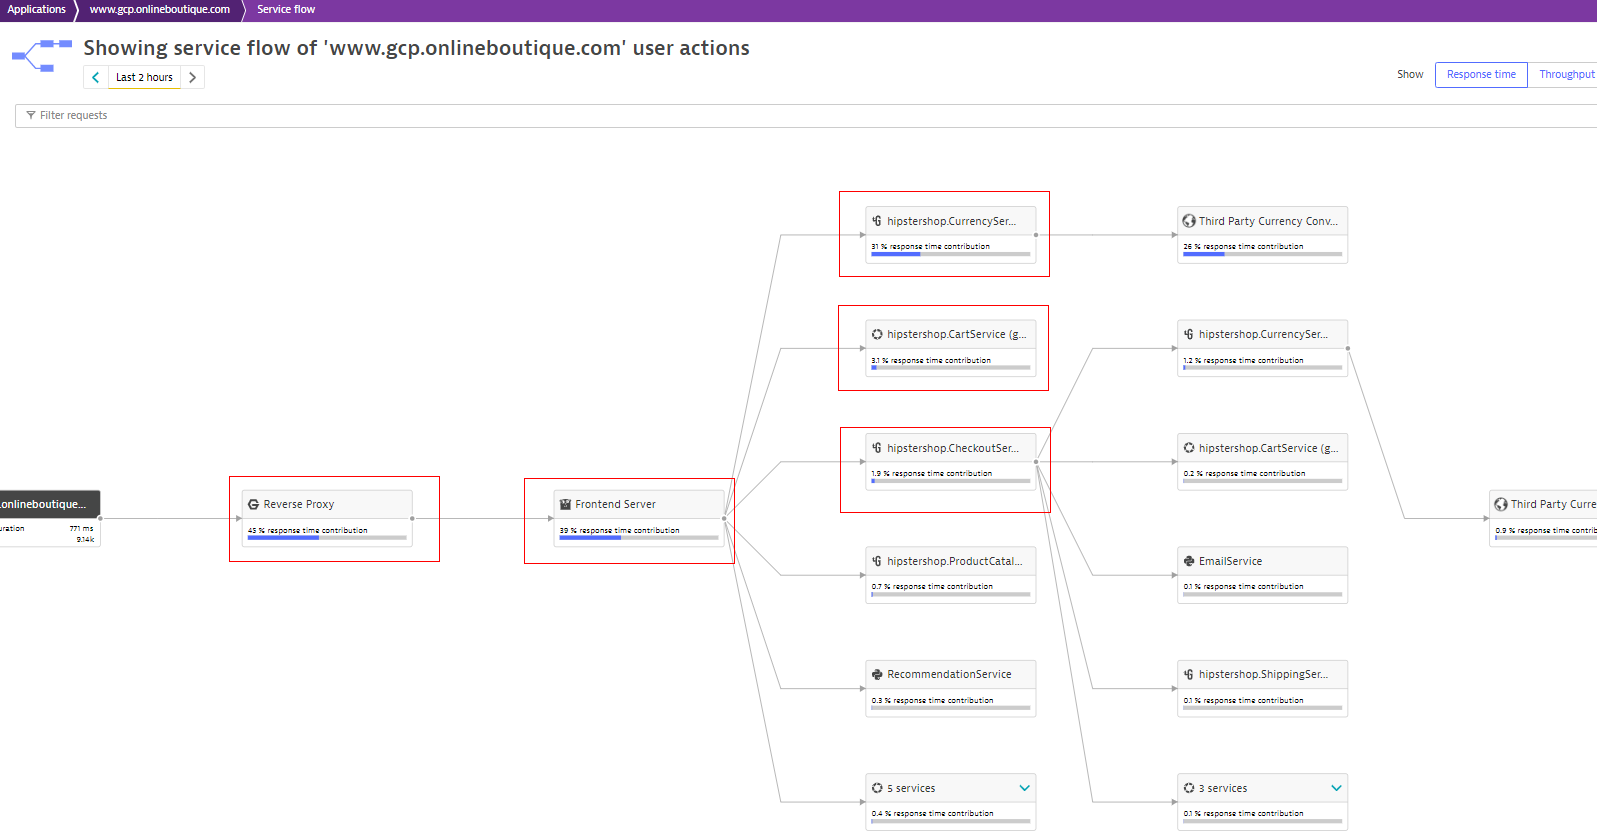
Service flow can help you define the critical path, and you can provide this information to the application owner, who should highlight the services belonging to the critical path.
Once you define the critical path, the next step is to create relevant SLOs for each service.
2. Define SLOs for each service
According to Google’s SRE handbook, best practices, there are “Four Golden Signals” we can convert into four SLOs for services: reliability, latency, availability, and saturation.
Reliability
Reliability is defined as the probability that a service operates without failure in a certain time period. It is not possible to directly measure the reliability of a service, so a good approach is to use an indirect measure.
An effective reliability SLO is to measure the number of requests without error. In this example, we’re creating an SLO with a target of 98% of our requests without errors.
curl --silent --location --request POST 'https://YOUR-ENVIROMENT/api/v2/slo/' \
--header 'Content-Type: application/json' \
--header 'Authorization: Api-Token API-TOKEN' \
--data-raw '
{
"enabled": true,
"name": "SLO SERVICE-NAME: Reliability Objective",
"description": "",
"metricExpression":
"((100)*(((builtin:service.errors.fivexx.successCount:filter(and(in(\"dt.entit
y.service\",entitySelector(\"type(service),entityName(~\"SERVICE-
NAME~\")\")))):splitBy())))/(builtin:service.requestCount.total:filter(and(in(\"dt.entity.
service\",entitySelector(\"type(service),entityName(~\"SERVICE-NAME~\")\")))):splitBy()))",
"target": 98.0,
"warning": 98.5,
"evaluationType": "AGGREGATE",
"timeframe": "-10m",
"filter": "type(\"SERVICE\"),entityName.startsWith(\"SERVICE-NAME\")",
"metricDenominator": "",
"numeratorValue": 0.0,
"metricNumerator": "",
"metricRate": "",
"useRateMetric": true,
"denominatorValue": 0.0
}
Latency
Latency is the time that it takes a request to be served. This is what Dynatrace captures as response time.
An excellent way to establish an SLO based on latency is to have X% of all service requests returning within an established time (for example, 300 ms).
The performance SLO needs a custom SLI metric, which you can configure as follows.
curl --silent --location --request PUT 'https://YOUR-ENVIROMENT/api/config/v1/calculatedMetrics/service/calc:service.sli_SERVICE-
NAME_latency' \
--header 'Content-Type: application/json' \
--header 'Authorization: Api-Token API-TOKEN' \
--data-raw '{
"tsmMetricKey": "calc:service.sli_SERVICE-NAME_latency",
"name": "sli_SERVICE-NAME_latency",
"enabled": true,
"metricDefinition": {
"metric": "REQUEST_COUNT",
"requestAttribute": null
},
"unit": "COUNT",
"unitDisplayName": "",
"entityId": null,
"managementZones": [],
"conditions": [
{
"attribute": "RESPONSE_TIME",
"comparisonInfo": {
"type": "NUMBER",
"comparison": "LOWER_THAN",
"value": 300,
"values": null,
"negate": false
}
},
{
"attribute": "SERVICE_DISPLAY_NAME",
"comparisonInfo": {
"type": "FAST_STRING",
"comparison": "EQUALS",
"value": null,
"values": [
"SERVICE-NAME"
],
"negate": false,
"caseSensitive": false
}
}
],
"dimensionDefinition": null
}'
Once you define the SLI metric, you can create an SLO based on the number of requests with proper response time.
curl --silent --location --request POST 'https:// YOUR-ENVIROMENT/api/v2/slo/' \
--header 'Content-Type: application/json' \
--header 'Authorization: Api-Token API-TOKEN' \
--data-raw '{

"enabled": true,

"name": "SLO SERVICE-NAME: Latency Objective",

"description": "In case the latency of the service is violating the defined SLO target,

there'\''s a performance problem",

"metricExpression": "((100)*((calc:service.sli_SERVICE-

NAME_latency:splitBy():avg:auto:sort(value(avg,descending)))/(builtin:service.requestCount.total:filter(and(in(\"dt.entity.service\",entitySelector(\"type(service),entityName(~\"SERVICE-

NAME~\")\")))):splitBy():avg:auto:sort(value(avg,descending)))))",

"target": 92.0,

"warning": 94.0,

"evaluationType": "AGGREGATE",

"timeframe": "-15m",

"filter": "type(\"SERVICE\"),entityName.startsWith(\"SERVICE-NAME\")",

}'
Availability
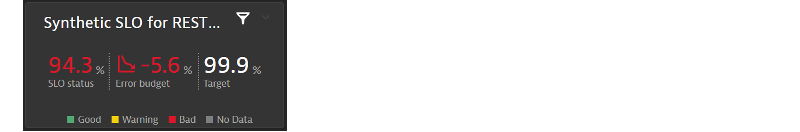
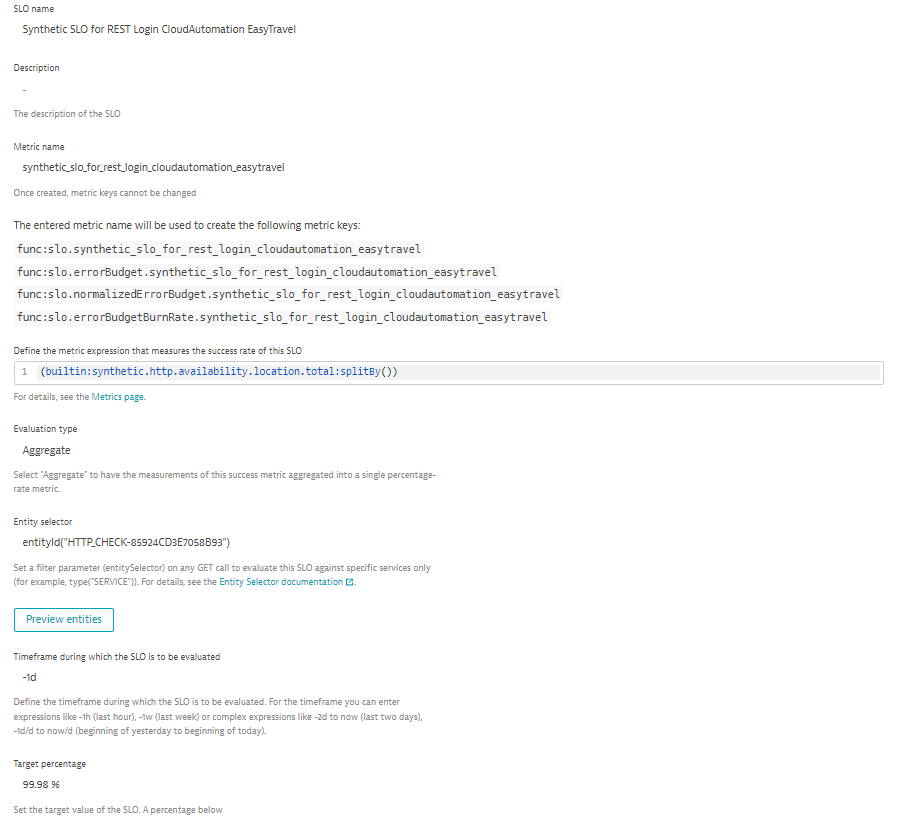
To measure availability, we can rely on an HTTP monitor from Dynatrace Synthetic Monitoring. Synthetic monitoring allows us to test API endpoints and eliminate any undesired spikes or drops because of holidays, special events (marketing campaigns, new products, and so on), or impacts from external sources (power outages, internet provider problems, and so on).
The following example shows a synthetic SLO that measures the availability of REST logins for a CloudAutomation service that is missing its target of 99%. In the detail that follows, you can also see the parameters we used to define this SLO.
Saturation
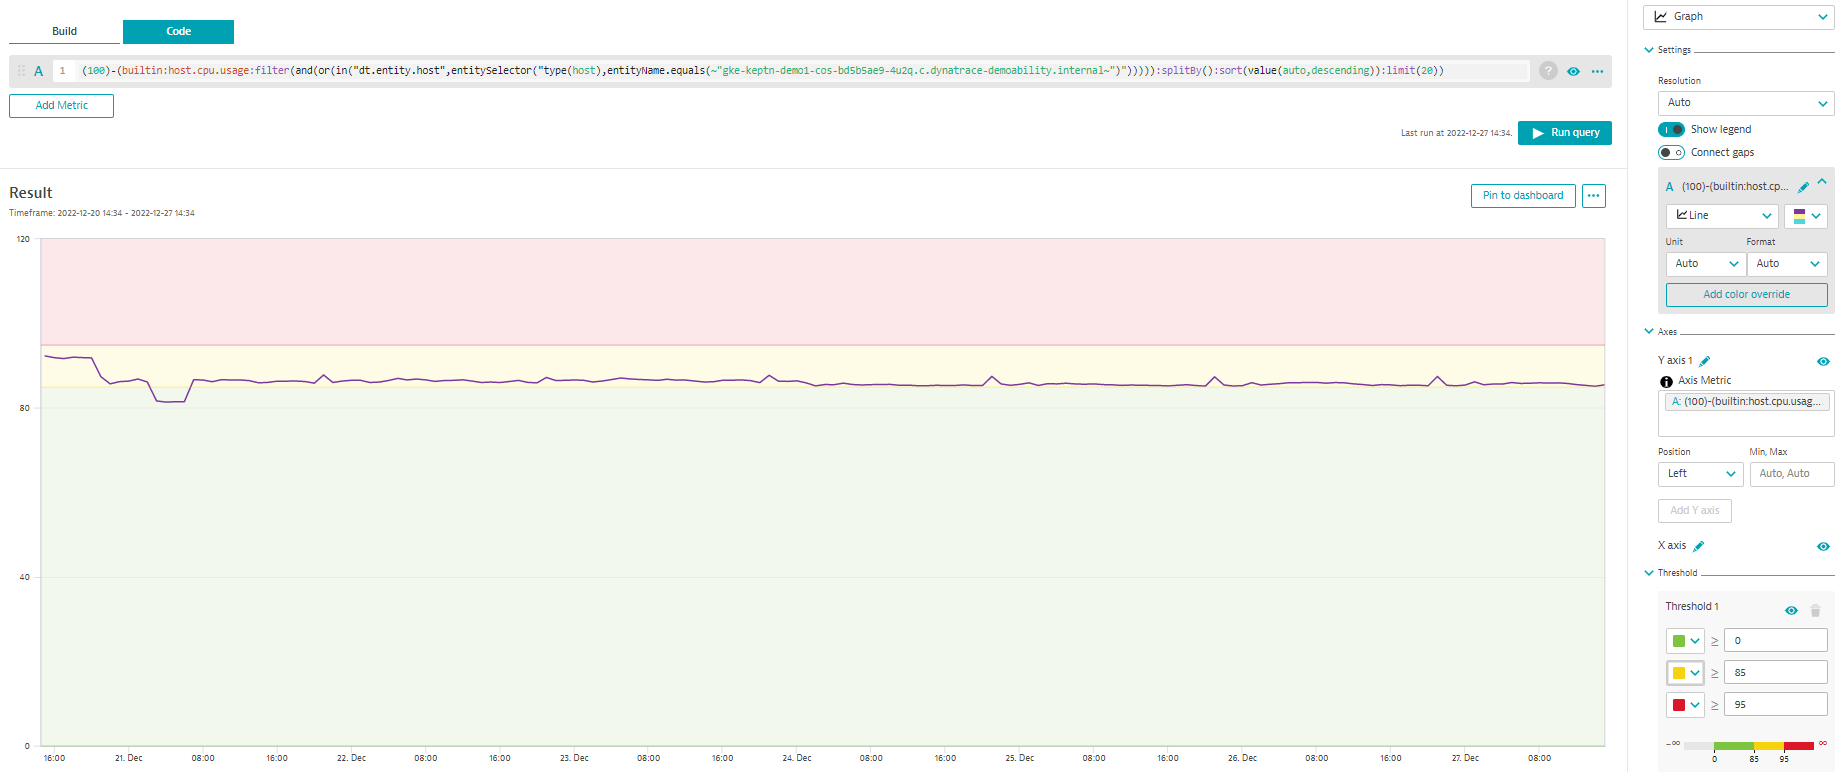
With saturation, we try to measure overall system utilization, which you can obtain from host metrics such as CPU and memory usage.
Keep in mind that the CPU usage is the percentage of the CPU used; we want to be sure that our SLO is referring to the percentage of free CPU, so we must create our SLO by subtracting the metric from 100.
Implementing SLOs that meet user needs, not just metrics
Although implementing service-level objectives has been associated in the past with benchmarking application status, with microservices, the applications have more dependencies than legacy monolithic applications. Approaching SLOs by analyzing the application’s critical path can reduce the number of metrics you care about while focusing on what your users need.
Dynatrace provides you with all the tools you need to make SRE work easier, including implementing SLOs with SLIs provided by the metrics captured in Dynatrace.
To see these principles in action, check out our videos about implementing service-level objectives.
To learn more about how to use SLOs to automate DevOps processes, join us for the on-demand performance clinic, Automating SLOs from Ops to Dev with Dynatrace.


Looking for answers?
Start a new discussion or ask for help in our Q&A forum.
Go to forum