
Observability-driven DevOps and SRE automation can help enterprises achieve SLO goals and reduce MTTR. But, how do you get started?
DevOps and site reliability engineering (SRE) teams aim to deliver software faster and with higher quality. But, manual steps — such as reviewing test results and addressing production issues resulting from performance, resiliency, security, or functional issues — often hinder these efforts. What these steps have in common is that monitoring tools are not in sync with new changes in code or topology and this observability data is often siloed within different tools and teams.
Automation presents a solution. Many organizations integrate automated configuration, collection, and evaluation of observability data into their delivery pipelines to make better, data-driven release decisions. They also use the same solution to drive automated remediation playbooks that reduce mean time to identification and resolution of incidents.
We refer to this culture and practice as observability-driven DevOps and SRE automation.
The role of observability within DevOps
Observability is the ability to measure a system’s current state based on the data it generates, such as logs, metrics, and traces. Observability aims to understand what’s happening across all an organization’s environments and technologies, helping teams detect and resolve issues to keep systems efficient and reliable, and end users happy.
Comprehensive observability is critical to advancing DevOps within organizations where team empowerment, cross-team communication and collaboration, and technology automation is the goal. Comprehensive observability eliminates siloed views of the system and establishes a common means to observe, measure, and act on insights.
Together with application and operation teams, site reliability engineers (SREs) lead the implementation of an organization’s observability solution, implement delivery pipeline tooling system, and establish the service-level objectives (SLOs) that form the basis of automated release decisions and operational task automation.
The results of observability-driven DevOps speak for themselves
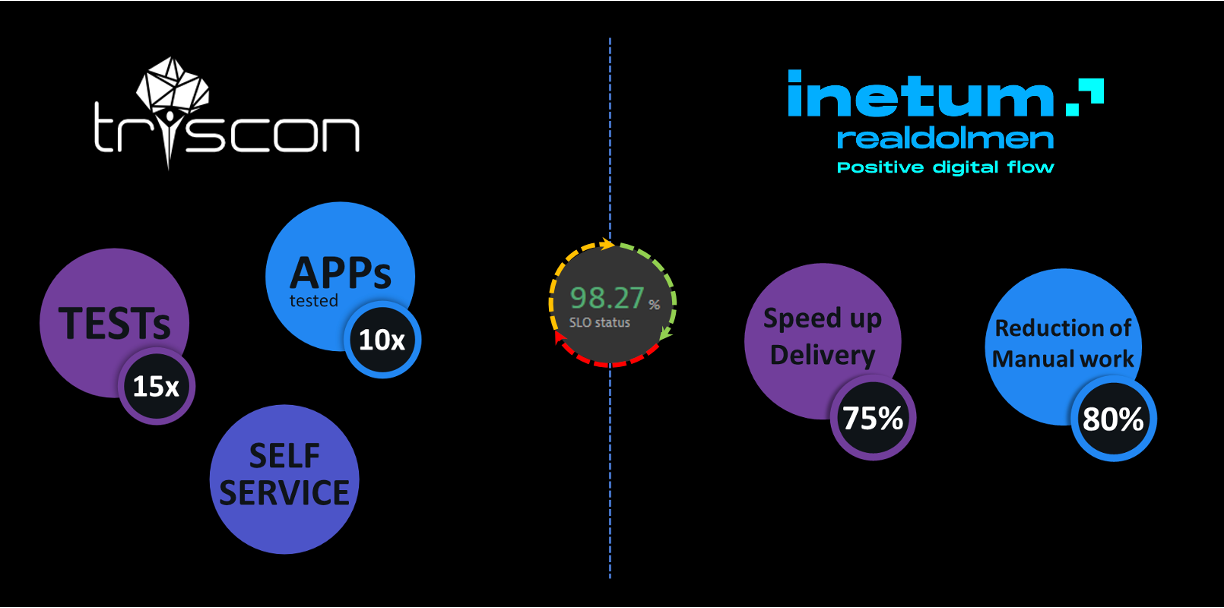
Dynatrace customers have brought observability-driven DevOps and SRE automation to their teams and achieved tangible benefits. As two examples, Roman Ferstl of Triscon noted that observability-driven DevOps has helped clients achieve 15x more tests with 10x more apps tested. Bert Van Der Heyden from Inetum Realdolmen also noted that he has helped bring SRE automation that has both sped up service delivery by 75% and reduced manual work by 80%.
But how do you get started with observability-driven DevOps and SRE?
5 steps to achieve observability-driven automation
The following five-step approach is one that Andreas Grabner, DevOps activist at Dynatrace, and I recommend for organizations that want to incorporate SLOs within software delivery and incident management processes. This approach was presented virtually in the on-demand observability clinic, Getting Started with Observability-Driven DevOps and SRE Automation.
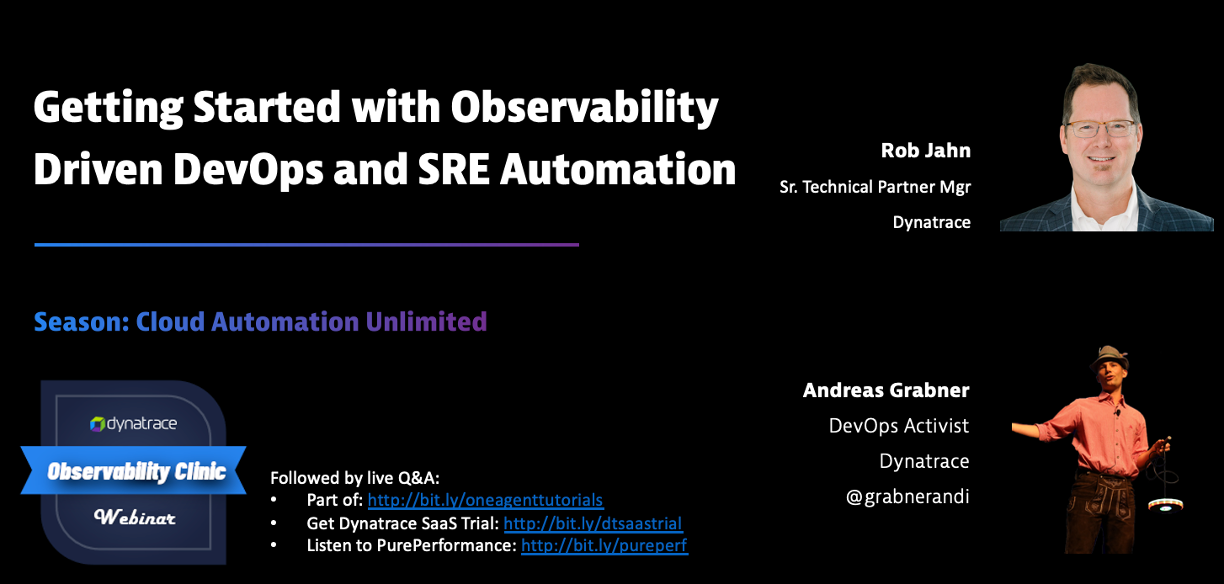
Check out the full webinar here!
1. Gain visibility into your existing releases
The first step is to understand your releases. This includes understanding what deployments are running, what versions each deployment runs, and in what environments they run.
Dynatrace has built-in awareness capabilities for releases, builds, and versions. The platform also offers analysis capabilities within the Release Inventory page in addition to each distributed trace. Dynatrace uses several built-in version detection strategies such as automatically reading environmental variables and Kubernetes labels.
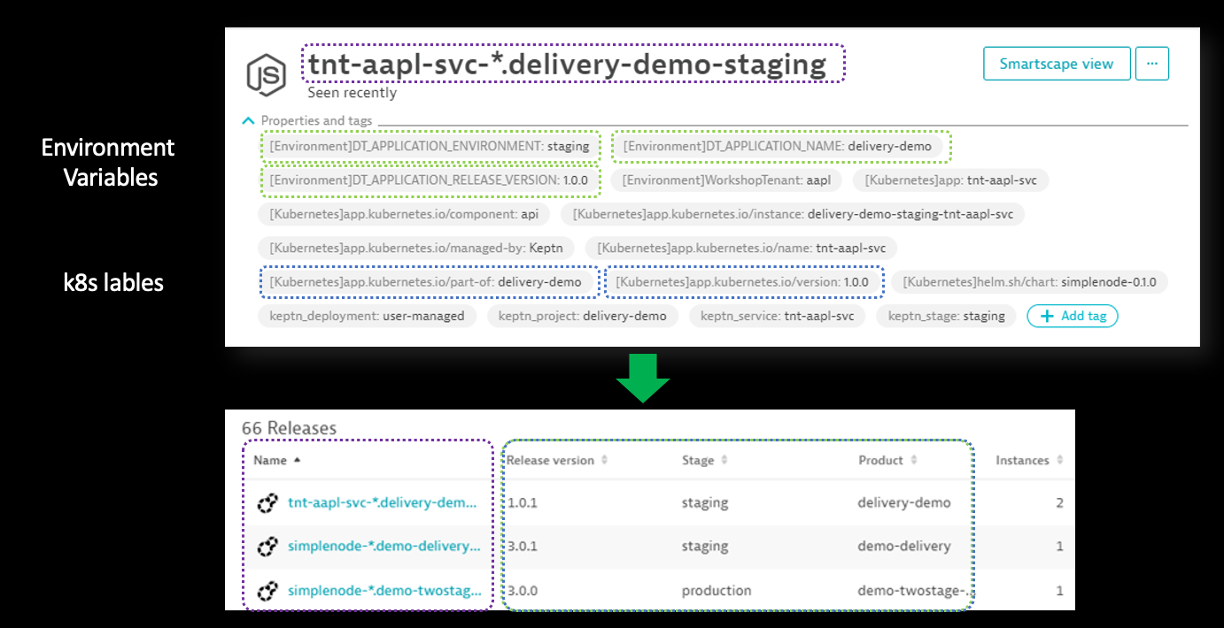
With this information, Dynatrace provides answers to the following fundamental questions related to release insights and risk:
- Which versions are deployed across our deployment stages and production environments?
- Which release stages are these deployed versions in?
- How does this release compare to the previous release in terms of SLOs and security risks?
2. Report and act upon SLOs for your critical services
With visibility into releases, the next step is to define SLOs with app, infrastructure, and business owners. After that, you may begin tracking them and sharing them with real-time dashboards. SLOs are valuable because they foster dialogue and establish a common language, measurement, and ownership amongst teams.
Dynatrace makes this easy by offering a collection of best-practice SLO definitions for various use cases beyond the observability domain. In the Dynatrace platform, simply choose one of the predefined SLO templates that the platform provides out of the box.
Many organizations often start with the service availability and performance SLOs. They manage these SLOs over the short term and over longer timeframes, such as the monthly timeframe shown in the example custom Dynatrace dashboard below.
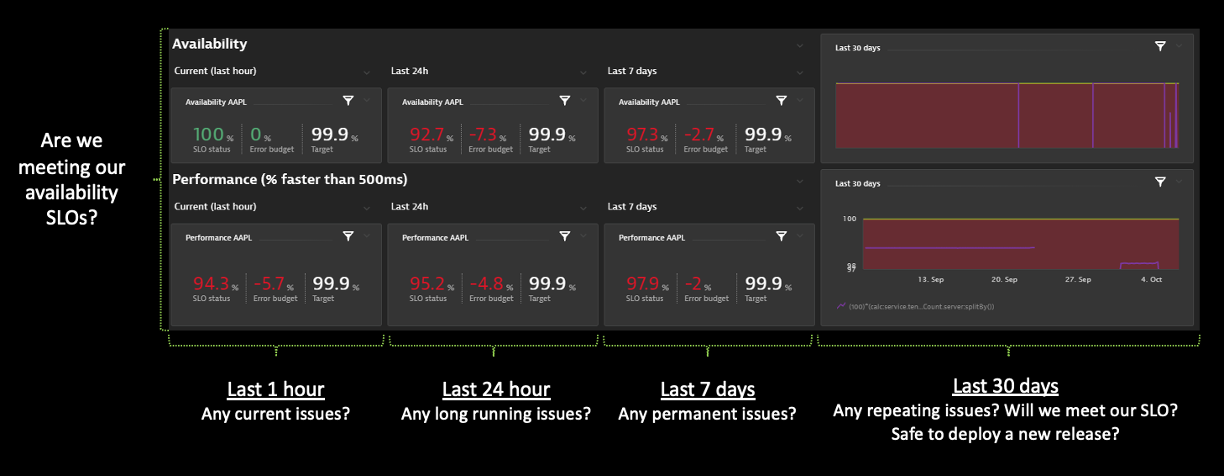
Another built in feature, shown in the example above, is SLO error budgets. For example, if you have a 99.9% availability SLO, you have an error budget of 0.1% — roughly 40 minutes per month — where customers may experience downtime. For each availability incident, Dynatrace will automatically track the remaining budget and the budget burndown so that the team can manage the risk of missing service-level agreements (SLAs) that may be tied to missed SLOs.
As described in more detail in this blog, another benefit to Dynatrace SLOs is Dynatrace’s AI engine, Davis®, that identifies potential contributors to SLO violations in real time, before they breach thresholds. Dynatrace pinpoints the root causes of problems and their impact on SLOs. This enables SRE teams to proactively ensure the highest service quality levels.
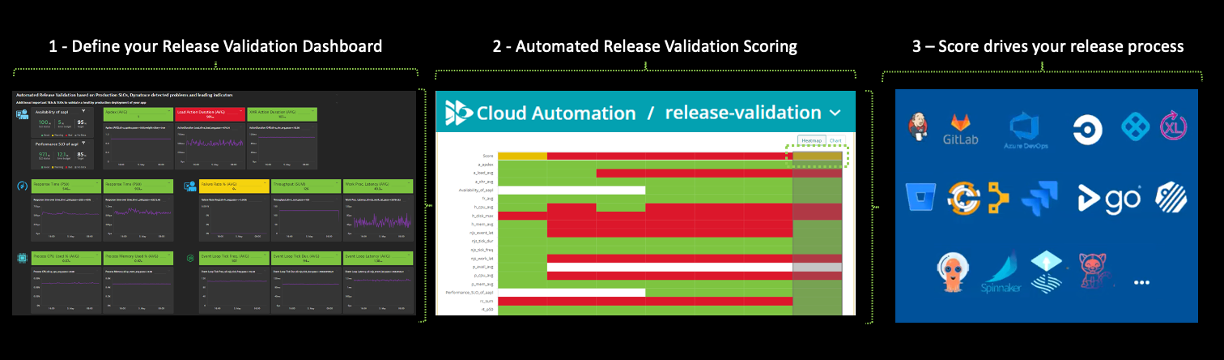
3. Automate release validation through SLO health scoring
The third step is to measure service and application health for each release against a defined collection or set SLOs to establish an SLO health score. A repeatable health score can help answer the following questions:
- Is this a good release or not?
- Should we keep it or roll it back?
- Are all critical business features still working?
Dynatrace also allows you to automate the analysis and calculation of the health score for new software builds and production releases. This process includes the following functionalities:
- The Dynatrace dashboard tile defines any metric along with its target or SLO. For example, 99% of the API requests have a response time of 100ms or less or the release must have zero security vulnerabilities.
- The collected set of metrics are queries for some timeframe. For instance, for a performance test window of 10 minutes, SLOs targets are evaluated and SLO health scores are visualized build-over-build.
- Dynatrace adds an automated call to perform the SLO health score with continuous delivery pipelines. If the SLO health score for a build is not met, then the pipeline will be triaged as a “fail,” stopping a release from going to production.
With the answers from this step, development and SRE teams save time by receiving immediate feedback on whether they are achieving overall SLO targets, whether potential problems are brewing, and where recurring issues are becoming larger problems.
4. Speed up existing delivery pipelines through SLO-driven orchestration
Step four builds upon step three by further integrating SLO health checks into the broader delivery process. The goal of this step is to support multi-stage delivery pipelines and scale to bring self-service models to many development teams.
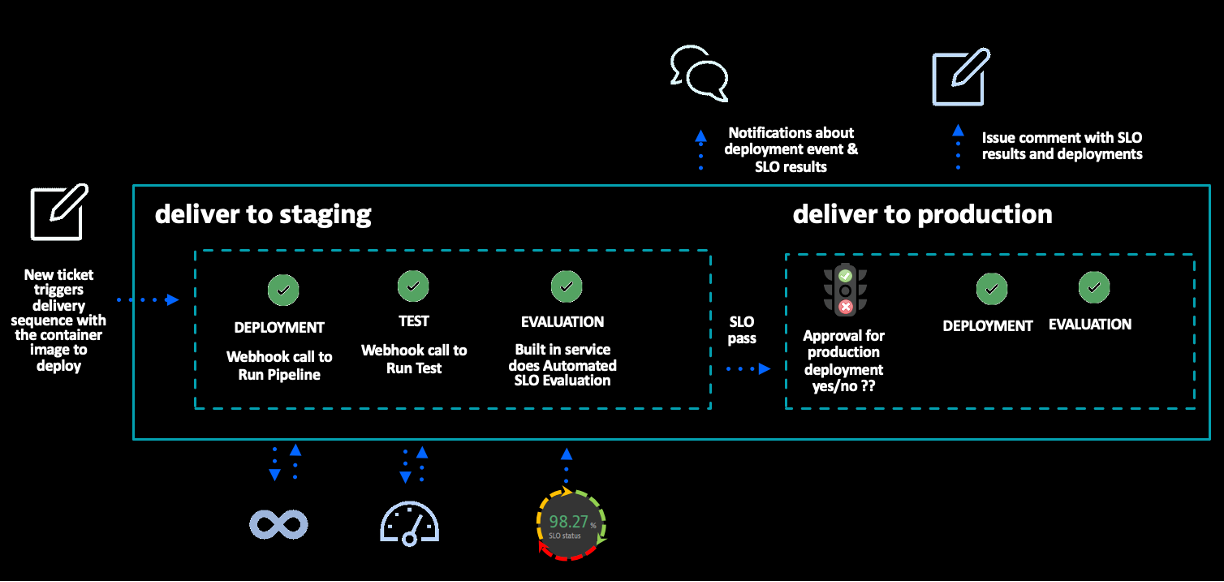
As shown in the diagram above, a multi-stage delivery sequences include multiple steps such as deploying, testing, and evaluating for a given software build. The automated SLO evaluation step serves as a “quality gate” to the production release process because a pass, warning, or failure result is built into the automated pipeline. In addition, tickets are updated and notifications are sent via Slack or MS teams for audit trail and status communication.
5. Reduce MTTR through SLO-driven remediation
Once a release or feature is running problems may arise and teams need to fix them quickly. So that brings us to our final step, reduce mean time to repair (MTTR) using SLO-driven remediation.
Automating and orchestrating DevOps remediation action and incident response starts by adopting and integrating SLOs within enterprise processes. This automation also relies on integrating tools for releases, notifications, and incident management. This connection empowers platform and site reliability engineers to automate release validation, improve resiliency engineering, support multi-stage delivery, and incorporate automated problem remediation.
Below is one use case where Dynatrace detects an issue and — with the known, detailed root cause — initiates an automated remediation workflow.
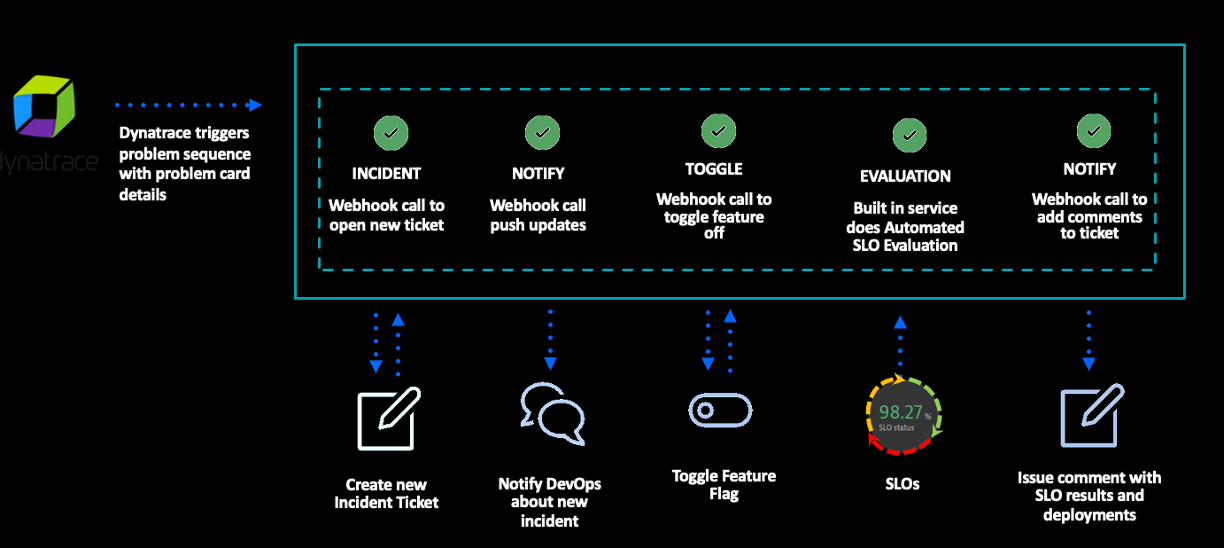
In this workflow, incident tickets are automatically opened and assigned to the responsible team. For certain issues, further runbook automation is possible, such as toggling off a feature flag. Following the remediation, Dynatrace runs an automated SLO health check to quickly ensure the fix and that SLO results are added to the incident ticket. By following this approach, SLO results become standardized within incident management workflow, helping organizations recover from incidents faster.
Observability-driven DevOps and SRE made easy
The Dynatrace team is here to help you jumpstart and mature your observability-driven DevOps for the following focus areas reviewed in this blog:
- Gain visibility into your existing releases
- Report and act upon SLOs for your critical services
- Automate release validation through SLO health scoring
- Speed up existing delivery pipelines through SLO-driven orchestration
- Reduce MTTR through SLO-driven remediation
With AI-powered automation at the core, the Dynatrace platform is a single source of truth for observability, integration, and orchestration. Dynatrace delivers context and precision that enables DevOps teams to understand their entire multicloud environment and eliminate manual effort to keep applications and systems running smoothly.
Want to learn more? Explore the state of SRE in our free 2022 State of SRE Report here.


Looking for answers?
Start a new discussion or ask for help in our Q&A forum.
Go to forum