
In this blog post, we’ll check how to integrate Percona Monitoring and Management (PMM) with Loki to be able to get not only metrics and queries from our database servers but also text-based information like logs.
Loki is a log aggregation tool developed by Grafana Labs. It integrates easily with the Grafana instance that is running internally in PMM, and logs can be pushed to it in a very straightforward manner by using a client like Promtail. Promtail will be in charge of reading the log files and sending new information to the Loki server. A rough schema showing the interactions between these tools can be seen in the following diagram.

The first step is to have a working PMM environment for our tests, so we’ll use anydbver to deploy three containers: one with a PMM server, another with Percona Server for MySQL and a PMM client, and a third one with PostgreSQL and a PMM client. The needed command for this is the following:
1 2 3 4 | ./anydbver deploy node0 pmm hostname:pmm-server node1 ps hostname:ps pmm-client pmm-server:node0 node2 pg hostname:pg pmm-client pmm-server:node0 |
Setting up Loki
The first step is to set up the Loki server, so we’ll do it in the same host as the PMM server for ease of use. Since we are using podman as a deployment method, we’ll use a Loki container too:
1 2 3 | ./anydbver ssh node0 podman run -d --name=loki -p 3100:3100 grafana/loki podman inspect loki | grep IPAddress |
Take note of the IP address so that we can point PMM to it in the next step.
Configuring Loki in PMM
To configure our new Loki server, click on the settings cogwheel, select ‘Data sources’, and then click the blue ‘Add data source’ button. Finally, scroll down or search for Loki using the text box filter and click on it. In this case, we’ll only need to use the IP address and port (3100 by default), but more settings are available to explore if needed (like using TLS).
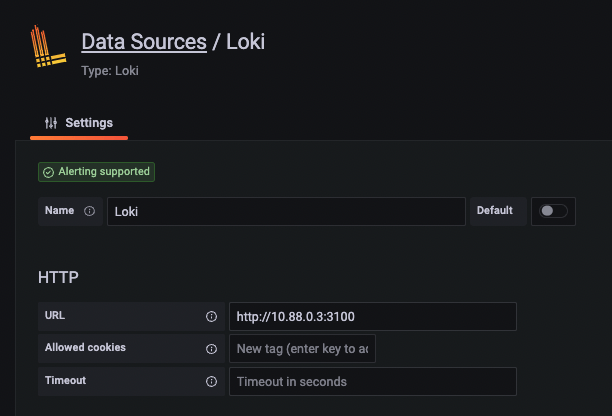
At this point, you can scroll down and click ‘Save & test,’ knowing that the tests will likely fail unless you have already injected some data into Loki (which is fine):
1 | <span style="font-weight: 400;">Data source connected, but no labels received. Verify that Loki and Promtail is configured properly.</span> |
These settings are stored in the grafana.db file inside the PMM server, so they will persist in the event of a PMM upgrade and will continue to work properly.
Setting up Promtail in the MySQL client node
There are several ways of deploying Promtail, but I think installing the packages is the most convenient one:
1 2 3 4 | ./anydbver ssh node1 curl -LO https://github.com/grafana/loki/releases/download/v2.7.4/promtail-2.7.4.x86_64.rpm yum -y install promtail-2.7.4.x86_64.rpm systemctl stop promtail |
We are stopping the service because we’ll need to edit the configuration:
1 2 3 4 5 6 7 8 9 10 11 12 13 14 15 16 17 18 19 20 | cat <<EOF >/etc/promtail/config.yml server: http_listen_port: 9080 grpc_listen_port: 0 positions: filename: /tmp/positions.yaml clients: - url: http://pmm-server:3100/loki/api/v1/push scrape_configs: - job_name: mysql static_configs: - targets: - localhost labels: job: mysql-log __path__: /var/log/mysqld.log EOF |
The important sections are:
- clients – it points to the Loki server we configured.
- scrape_configs – it has the data about which logs or files to scan (wildcards can be used) and metadata like labels associated with them.
The server section should still be used, even if we are not using Promtail as such, and the positions section is just used for the metadata needed by Promtail’s file scraping.
For RHEL-based packages (as I’m using here), the defaults used for the MySQL error log are already using /var/log/ path, and the file has the group readable bit set. If you are unsure, you can check its location with the following query:
1 2 3 4 5 6 7 8 | mysql> show variables like 'log_error%'; +---------------------+---------------------+ | Variable_name | Value | +---------------------+---------------------+ | log_error | /var/log/mysqld.log | | log_error_verbosity | 3 | +---------------------+---------------------+ 2 rows in set (0.00 sec) |
If you want to get messages on connections, make sure to use the verbosity level 3.
Finally, we need to add Promtail to the mysql OS user group, too, so it can read the file.
1 2 | usermod -a -G mysql promtail systemctl start promtail |
If everything is working as expected, we should see messages like the following in the Promtail logs:
1 2 3 4 5 6 7 | [root@ps ~]# journalctl -u promtail -- Logs begin at Wed 2023-03-15 17:35:49 UTC, end at Wed 2023-03-15 19:03:12 UTC. -- ... Mar 15 19:02:59 ps promtail[2318]: level=info ts=2023-03-15T19:02:59.437567482Z caller=filetargetmanager.go:352 msg="Adding target" key="/var/log/mysqld.log:{job="mysql-log"}" Mar 15 19:02:59 ps promtail[2318]: level=info ts=2023-03-15T19:02:59.437666731Z caller=filetarget.go:282 msg="watching new directory" directory=/var/log Mar 15 19:02:59 ps promtail[2318]: level=info ts=2023-03-15T19:02:59.437776314Z caller=tailer.go:143 component=tailer msg="tail routine: started" path=/var/log/mysqld.log Mar 15 19:02:59 ps promtail[2318]: ts=2023-03-15T19:02:59.437845939Z caller=log.go:168 level=info msg="Seeked /var/log/mysqld.log - &{Offset:0 Whence:0}" |
Checking MySQL logs on PMM
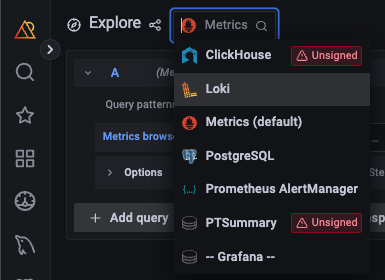
If we access the Explore dashboard on PMM, we’ll now be able to select the Loki metrics:
And after that, we are ready to query it. If we click on the text boxes, Grafana will help us by showing us the available labels and metrics stored in Loki:
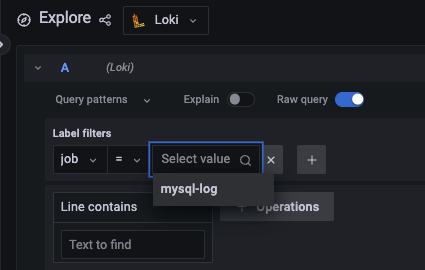
After we select it, we can see all the events from the MySQL logs!
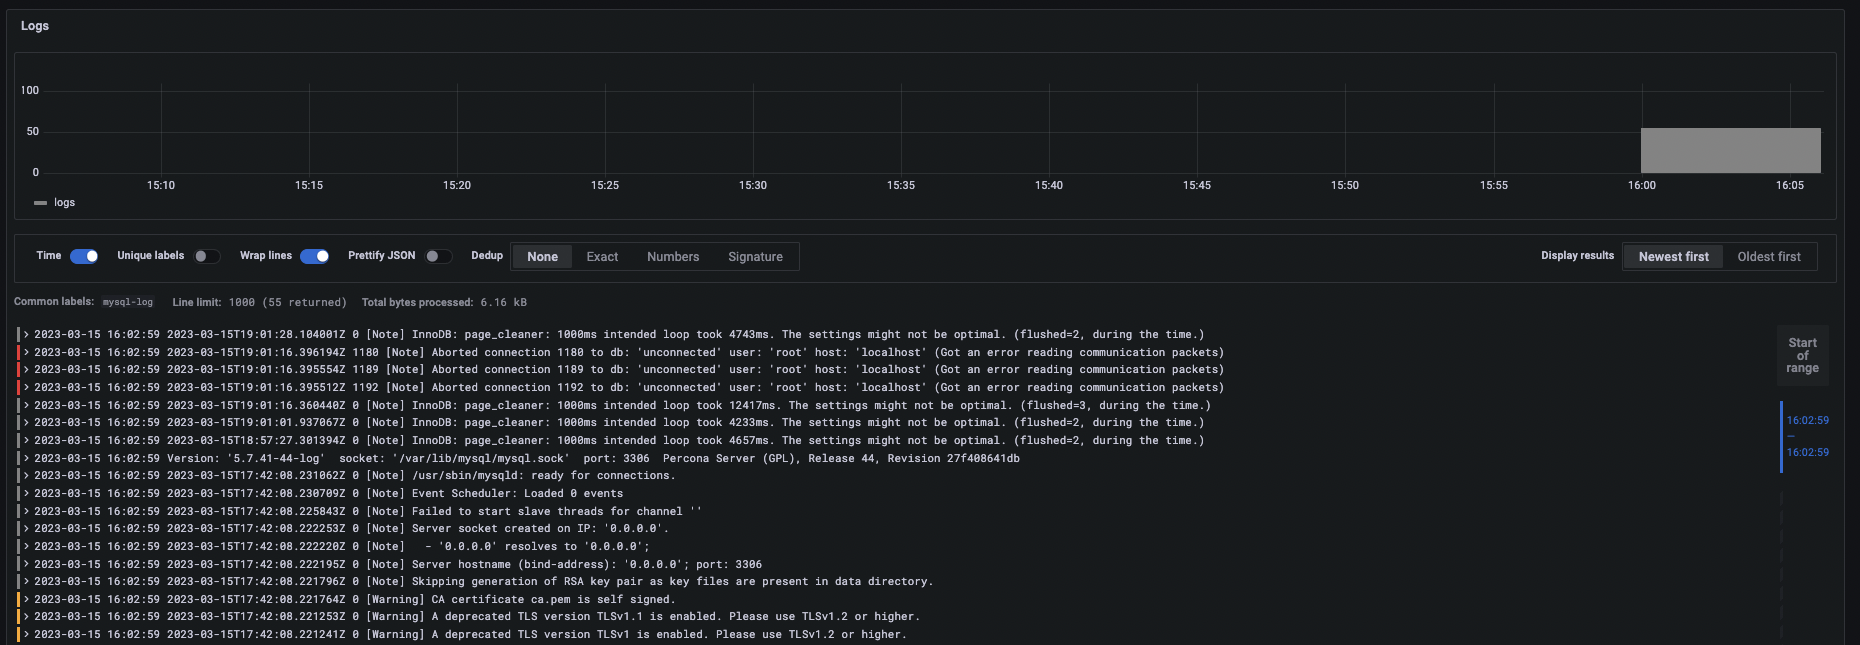
It’s unclear here, but note how Grafana helps us notice potential errors and warnings by coloring the entries red and yellow. Additionally, if we click on any line, we can see its associated metadata:
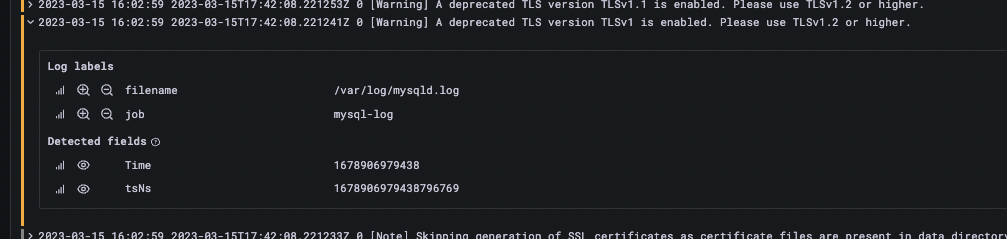
One thing to note here is that we have no idea where these logs come from exactly because we missed adding any labels that contain this information (in the /etc/promtail/config.yml file). Let’s see how to do it in the next section.
Setting up Promtail in the PostgreSQL client node
The installation steps are exactly the same as for the MySQL node, but for completeness:
1 2 3 4 | ./anydbver ssh node2 curl -LO https://github.com/grafana/loki/releases/download/v2.7.4/promtail-2.7.4.x86_64.rpm yum -y install promtail-2.7.4.x86_64.rpm systemctl stop promtail |
To configure it, it will be mostly the same as before, but we will now add an extra label (node_name) to point back to which node these logs are coming from.
1 2 3 4 5 6 7 8 9 10 11 12 13 14 15 16 17 18 19 20 21 | cat <<EOF >/etc/promtail/config.yml server: http_listen_port: 9080 grpc_listen_port: 0 positions: filename: /tmp/positions.yaml clients: - url: http://pmm-server:3100/loki/api/v1/push scrape_configs: - job_name: postgresql static_configs: - targets: - localhost labels: job: postgresql-log node_name: pg.test.env __path__: /var/log/pg14/*.log EOF |
Note how we are using a wildcard this time so that all files under /var/log/pg14/ that end in .log will be scanned.
Additionally, for PostgreSQL in particular, we’ll need to change the logging defaults so that other users can read them (by default, they are stored in the datadir). For this, we can use the following procedure:
1 2 3 4 5 6 7 8 | mkdir -p /var/log/pg14/ chown postgres:postgres /var/log/pg14/ psql <<EOF ALTER SYSTEM SET log_directory = '/var/log/pg14/'; ALTER SYSTEM SET log_file_mode = '0640'; select pg_reload_conf(); EOF |
Then make sure our Promtail user is part of the Postgres group, and start the service:
1 2 | usermod -a -G postgres promtail systemctl start promtail |
For extra log verbosity, let’s add the following:
1 2 3 4 5 6 7 | psql <<EOF ALTER SYSTEM SET log_connections = 1; ALTER SYSTEM SET log_checkpoints = 1; ALTER SYSTEM SET log_disconnections = 1; ALTER SYSTEM SET log_autovacuum_min_duration = 0; select pg_reload_conf(); EOF |
Going back to the Explore dashboard, we should now see the new node_name label with our newly added Postgres data (note that you’ll still be able to use the job label since we also kept that in the config file):
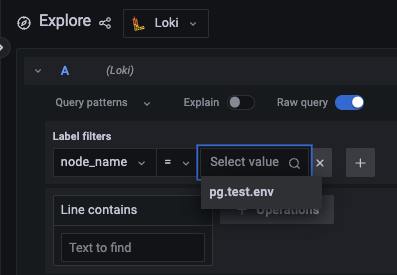
And you can click on the plus sign button to add more filters (note that we have the raw query printed, which can come in handy if we want to understand how to write more complex ones):


We can see information about connections, vacuums, and checkpoints, as expected, and again some errors, which are nicely highlighted in red. Note that you can click on ‘Newest first’ or ‘Oldest first’ depending on how you’d like to see the entries sorted.
If we look closely, we’ll notice that two timestamps are shown. The first one is the one corresponding to the time in which the line was ingested into Loki. By default, PMM will show us events in our local timezone, which in my case is UTC-3. The second one corresponds to the log itself, which in this case, was using UTC. Hence the three-hour difference in both.
There’s more!
We could use these same principles to craft our own scripts that export text-based data (like outputs from backup scripts or MySQL’s SHOW ENGINE INNODB STATUSG) and have Promtail export it for our review with all the other metrics already collected by PMM. This is a bit out of scope for this simple blog, but let me know if you want to hear more about it.
Lastly, if you want to know how to deploy and use this in Kubernetes, Nickolay has written about it in Store and Manage Logs of Percona Operator Pods with PMM and Grafana Loki.
Conclusion
Adding text-based data is possible in PMM if we have a Loki server to query. The steps are simple:
- Install and configure Loki
- Add the new Data Source in PMM
- Add Promtail exporters in each node
- Query the data via the Explore PMM dashboard
Percona Monitoring and Management is a best-of-breed open source database monitoring solution. It helps you reduce complexity, optimize performance, and improve the security of your business-critical database environments, no matter where they are located or deployed.
Download Percona Monitoring and Management Today