 Windows has long had a reputation for slow file operations and slow process creation. Have you ever wanted to make these operations even slower? This weeks’ blog post covers a technique you can use to make all file operations on Windows run at one tenth their normal speed (or slower), in a way that will be untraceable for most users!
And, of course, this post will also cover how to detect and avoid this problem.
Part 0 of this series was written seven years ago: Making VirtualAlloc Arbitrarily Slower.
This issue is a real one that I encountered a few months ago, and this post explains how I uncovered the problem and got it fixed.
Noticing that something is wrong
Sometimes the most important piece of information you can have when trying to make some process faster is just knowing that it could be faster. When you own all of the code then this may involve some back of the envelope estimates, competitive benchmarking, or intuition tuned by experience.
When dealing with a closed box like Microsoft’s NTFS file system it’s trickier to know if things could be running faster than they are. But there can be hints:
- If you notice that file operations are slower than they used to be then that is a clue that maybe they could become faster again
- If you notice that file operations are sometimes fast and sometimes slow then that is an indication that maybe you can make them always fast
- If profiling of your file operations shows odd hot spots then that is a hint that may lead you to a way of avoiding those odd hot spots
In my recent experience I saw all three of these clues and that let me figure out that the cause of a broad file system slowdown was a tool that I use. I then worked with the tool’s author to get a fix.
Slow file deletion
While repeatedly building Chromium from source I noticed that cleaning the output directory between builds was taking a couple of minutes – a good portion of the build time. I was reasonably sure that it used to be faster. I also noticed that this slowdown didn’t happen if Visual Studio was not running.
Spoiler alert: this wasn’t a Visual Studio bug
ETW tracing didn’t point to the culprit in an obvious way, but it did give some pretty broad hints and I realized that my new version of the VsChromium Visual Studio extension was probably the cause. I then worked with the author who created a new version that resolved the issue.
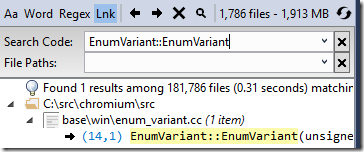 VsChromium is a Visual Studio extension that keeps all of the source code in a monitored directory loaded into RAM. When applied to the Chromium source code this uses a few GB of RAM, but the payoff is that you can search the entire code base in milliseconds. I depend on VsChromium to let me work effectively on Chromium, but having file operations run at one tenth of normal speed is a higher price for this benefit than I want to pay.
Recreating the problem
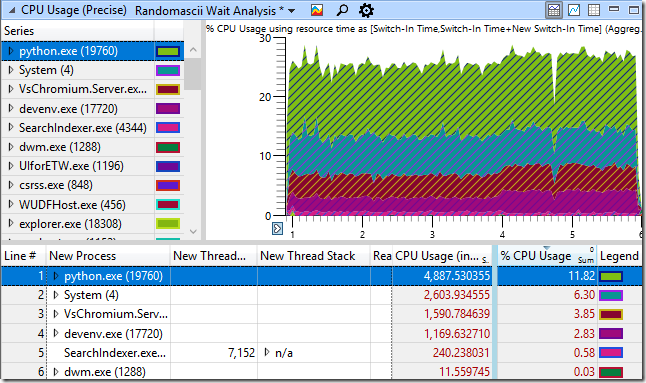
For this blog post I simulated the problem with a Python script that creates and then deletes a thousand files in a directory that VsChromium is monitoring and then I recorded an ETW trace of the activity. The CPU Usage (Precise) graph in WPA (Windows Performance Analyzer) shows CPU usage as a percentage of the eight-cores on my system and the table shows it in milliseconds. CPU usage is shown for the the approximately five seconds that my test script took to run:
It seems reasonable that python.exe running my script would be using the majority of the CPU time and it seems reasonable that the System process would be doing some bookkeeping as I add and remove files. It also seems reasonable that VsChromium, and by extension Visual Studio, would be doing some work as VsChromium notices new files that need adding to and removing from the index. Finally, SearchIndexer.exe is using a bit of CPU time as it indexes the new files. So, nothing is obviously wrong. And yet. We know that this code is running too slow.
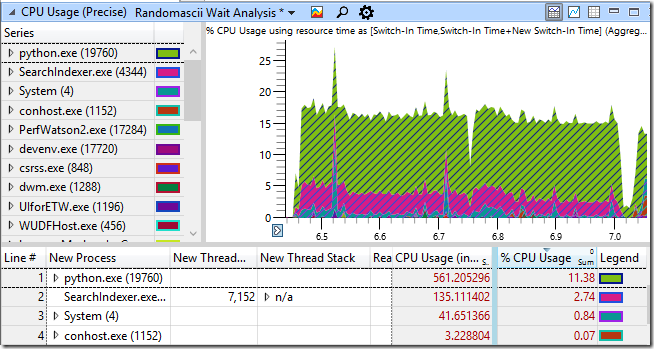
For contrast, here is the CPU usage when that same script creates and deletes files in a directory that VsChromium is not monitoring. The elapsed time (shown in seconds below the graph) is almost ten times shorter! It seems reasonable that the CPU time from VsChromium.Server.exe and devenv.exe should disappear, but that’s not all that has changed. The Python script itself is using a lot less CPU time (from 4,888 ms down to 561 ms) and the System process is using way less CPU time (from 2,604 ms down to 42 ms) – what is going on?
The CPU Usage (Precise) graph, which is based on context switch data, is great for telling you exactly how much CPU time a process consumes (including investigating why it is idle). But if you want to see where a process is spending time then you need to go to the CPU Usage (Sampled) graph. This is based on CPU sampling data, by default at 1 kHz, with full call stacks.
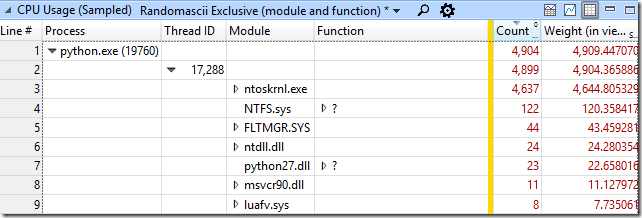
The stack view of the sampled data didn’t make it immediately clear where time was being wasted so I changed to an alternate view that sometimes cuts through the noise:
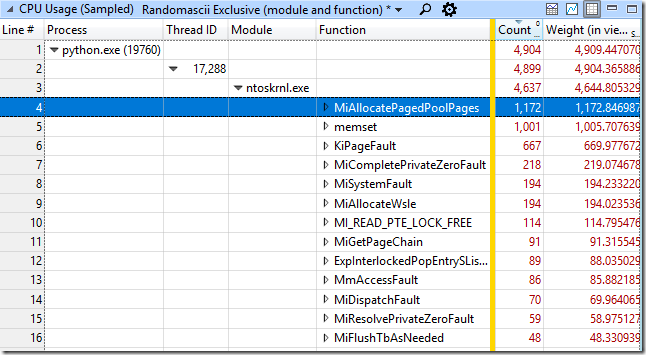
This view (included with UIforETW, but still not part of WPA’s default set of views for some reason) groups the sampled data by process, then thread, then module, and then function. In this case we can see that of the 4,882 samples in the python process the vast majority were in the ntoskrnl.exe module – the time spent running Python code in python27.dll was so tiny that it was irrelevant.
Drilling down into the ntoskrnl.exe samples we can see which functions the samples are hitting in:
The vast majority of these were allocating memory (MiAllocatePagedPoolPages) or clearing memory (memset, MiCompletePrivateZeroFault, and the associated page faults).
It seems weird to be spending that much time dealing with memory in a file-system test, but in fact, it’s worse than that. The second busiest process in the system was the kernel process, and it was spending the vast majority if its time zeroing recently freed memory (another hidden cost of memory allocation) – what is going on?
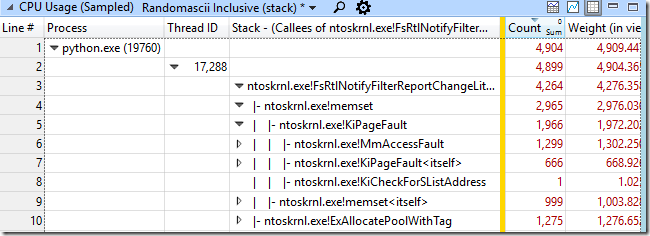
Going back to the call stack view of the python process I searched for memset, and found it about 70 levels deep in the call stack – no wonder I had missed it before. Right-clicking on it and selecting View Callers-> By Function I could see that the inclusive cost of calls to memset (including “child functions” it calls) accounted for more than half of the CPU cost of my python process – 2,971 out of 4904 samples:
Since the caller was almost always FsRtlNotifyFilterReportChangeLiteEx I right-clicked on it and selected View Callees-> By Function. This showed me that this function was allocating memory, calling memset on it, and consuming 83% of CPU time in the python process!
Aside: I think it’s pretty cool that the page faults triggered by memset – which are handled in the kernel – are showed as child functions of memset. ETW makes tracing across the user/kernel boundary so seamless that it’s sometimes not obvious that it’s happening.
Free association
There were a few false leads at this point – I noticed wcifs.sys!WcGenerateFileName on the critical call stack and that made me wonder if 8.3 filename generation was slowing things down, but disabling that feature didn’t help. Eventually I gave up on scrutinizing the inscrutable call stacks and thought about how VsChromium worked. At startup it just has to load all of the source files into RAM. But after that it has to monitor changes to the source files and I assumed that it probably had a file system monitor. I happened to know that the author had recently changed the file notification buffer size used from 16 KB to 2 MiB, and it looked like Windows doesn’t like that. And indeed, going back to a version before the buffer size was increased avoided the problem.
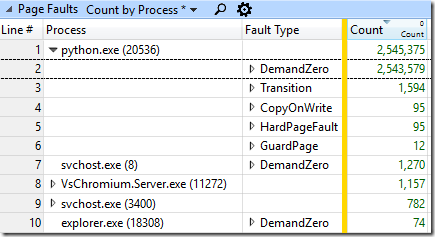
The diagnosis is that file notification buffers are allocated out of pool memory (ExAllocatePoolWithTag) and then filled with the available notification data. In order to avoid leaking kernel data to the monitoring process the remainder of the buffer is zeroed. If you have a large enough buffer then the zeroing of the buffer will consume the majority of the time. I added the ALL_FAULTS provider (which I found by looking through “xperf -providers k”) to my ETW tracing to see how many page faults were being triggered and it was impressive. There were 2,544,578 DemandZero page faults, which corresponds to 9.7 GiB of data, or about 4,970 2 MiB buffers. That’s 4.97 notification buffers for each of the thousand files that we created and then deleted. My consultants estimate that there should be five notification events to VsChromium for each file created and deleted, so that means that almost all of the notification buffers contained just a single notification record. Here are the page faults by process and type:
Why such large buffers?
The documentation for FileSystemWatcher recommends against using large buffers, but it doesn’t go into details about the problems that they will cause, and Chrome developers’ machines have a lot of memory. And so, when extremely frequent file operations (the sort that triggered a long-standing Windows kernel bug that I diagnosed in February) are happening and the recommended small buffers can’t handle the notification rate without losing events it is tempting to try larger buffer sizes. And it works – it avoids the buffer overflows – at least partially by slowing down the extremely frequent file operations!
When the VsChromium author was alerted to this problem they decided to shrink the buffers and make VsChromium handle the lost events more gracefully – by temporarily pausing monitoring when notification events are lost.
The delicious irony in this is that most of this cost – the memset calls, page faults, and associated page zeroing – is because two parts of the kernel aren’t quite talking to each other. The notification system asks for memory, it is given zeroed memory, and it then zeroes the memory, which triggers page faults, and makes freeing the memory more expensive. If the notification system knew that the incoming memory was already zeroed then it wouldn’t need to zero it, and it wouldn’t get faulted in, and life would be much better. Hey Microsoft – I’ve got a cool idea for how you can make file notifications more efficient. You know where to find me.
Weaponizing this knowledge
It shouldn’t take much C# code to make an app that monitors the root of all drives, using buffer sizes that start small and gradually get larger. I wonder what the impact would be with a buffer size of 10 MiB, and I wonder what buffer size would let this user-mode trick make normal Windows usage painfully slow?
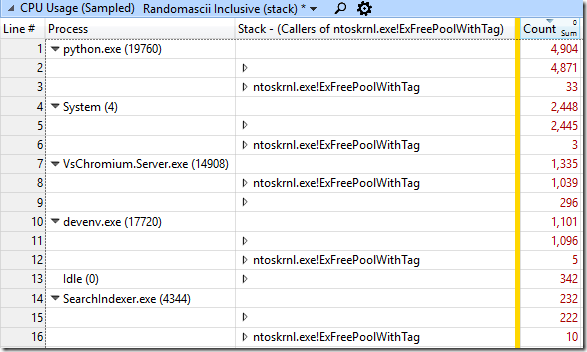
ETW tracing will easily (for some definition of easily) detect that notification buffers are the problem – every process doing file operations will show significant CPU time spent in ntoskrnl.exe!FsRtlNotifyFilterReportChangeLiteEx. That shows that somebody is using a too-large notification buffer, but how do you find which process is doing this? Well, the python.exe process in my test was spending a lot of time allocating and clearing memory, but somebody also has to free that memory. Since the memory is allocated with ntoskrnl.exe!ExAllocatePoolWithTag the memory will be freed with ntoskrnl.exe!ExFreePoolWithTag, so you simply need to search for that function in the stacks, use a butterfly view to group all the stacks that pass through it, and find the process that (in this case) is spending 1,039 samples in this function – I wish I’d thought of this trick when I was doing the original investigation:
Other references
The source code for the C# FileSystemWatcher class can be found here. The class is implemented using ReadDirectoryChangesW. This is a tricky to use function but there is a good explanation here, and sample code here.
The increase in the size of VsChromium’s notification buffer happened in this change, which shipped in version 0.9.26. The decrease happened in this change which shipped in version 0.9.27, with this comment:
Decrease the file system watcher buffer size from 2MB to 16KB. This is because a 2MB buffer has a noticeable performance impact on the operating system when lots of files changes on a fast SSD. With the new back-off policy in place, we should still support fast build scenarios, but with near zero performance impact.
I recommend using the latest version of VsChromium.
ETW traces and the Python script can be found here. The script creates and deletes the files twice, once in a monitored directory and once in a non-monitored directory, with a half-second pause in-between. If trying to recreate this then you need to configure VsChromium to monitor one of the directories.
There are two ETW traces with version 0.9.26 (slow) – one with all page faults recorded – and one trace with 0.9.30 (fixed).
Hacker news discussion is here, and reddit discussion is here. Russian translation is here.
And in my next post I really do promise to show how Microsoft lets you accidentally make process creation on Windows arbitrarily slower – O(n^2) for fun and profit!
Another instance of this problem was hit in November 2017 and is described here.
The JetBrains/intellij developers also encountered this problem and worked around it in the same way.
For more stories of investigating performance and stability bugs see my Investigative Reporting series. To learn more about how to do this type of investigation using ETW/xperf go to my ETW Central page.


Is there any easy way to tell if a program we are using is doing this thing as an end user?
I’m not aware of a way of figuring this out without looking at CPU sampling data. A phone-style permissions model would be handy for avoiding this, I guess, although Win32 is too complicated and it’s too late to bolt such a model on now.
Which OS version are you running? Windows 10 Fall Creators Update contains a fix for soft page fault performance. See https://aloiskraus.wordpress.com/2017/11/12/bringing-the-hardware-and-windows-to-its-limits/. I am also aware that a recent security update has made matters worse but I am still gathering detailed profiling data to submit a report to MS.
I’m running Fall Creators Update. So, maybe it would have been even worse earlier!
I wonder if a flame graph view would have just had this pop up immediately, compared to drilling into call stack tree view.
You can download the traces yourself – I put them and the script up on github – but the short answer is yes, it does make it fairly visible.
The WPA flame graphs are a bit clunky (I wish they would maintain a readable height for each line and allow vertical scrolling within the graph) but when filtered down to python.exe they basically show five big columns all of which end up with memset and an allocation function being called by a notify filter function.
It is handy having several ways of viewing the data.
I wonder why there are 5 buffers allocated per file. Shouldn’t this be a single buffer which is then filled with event data?
The events don’t all happen at the same time, especially the create and delete events. It may be that the other events also happen at different times. But yes, better coalescing would be great.
I just love your posts, Bruce!
Thx for taking the time to write this down.
I like your post! Could you point me to the post for the statement below?
>> And in my next post I really do promise to show how Microsoft lets you accidentally make process creation on Windows arbitrarily slower – O(n^2) for fun and profit! <<
I'm trying to create lots of processes and max I get is about 70 processes per second and it doesn't matter if it's one thread or 32. I hope your post will help me solve the problem. Thanks.
70 processes a second is not bad, or at least not far off of the maximum. The biggest thing that affects the rate is anti-virus, so make sure your processes are in an excluded directory. ETW profiling will show lots of MsMPEng.exe time (or whatever anti-virus) if that is a factor.
I still haven’t finished my follow-up article – maybe in the next couple of weeks. But it is a specific pathological case that causes process creation to dramatically slow over time. You’re not hitting that case I can assure you.
It’s interesting that multi-threading the process creation didn’t help. I had planned to test that, so thanks for the information.
Fun fact, that I learned from Niall Douglass, developer of Boost AFIO (now called LLIO): When you delete a file on Windows, the OS doesn’t actually delete the file… It just marks it for asynchronous deletion. If the system is under high load, then certain operations will mysteriously fail because they assume file deletion is synchronous.
An example that I ran into in LLVM’s unit tests, and is common everywhere: deleting everything in a folder and then deleting the folder. Once in a blue moon, the folder deletion will fail, as there are still a few files left. The insane solution is to rename the file to a cryptographically random name, and move it into the %TEMP directory, and THEN you delete it. The random name prevents stomping on anything,
He talks about it at 8:55 – https://youtu.be/uhRWMGBjlO8
He’s hit all sorts of weirdness in filesystems as he’s written his boost library, with which he’s been able to get mins boggling performance from NTFS
Huh. I’ve hit this, I think, in Chrome’s build system. We sometimes have to delete a directory, and this sometimes fails, and I was never sure why. I guess this is why. It would be nice to have an option to make DeleteFile() be synchronous.
Delete is synchronous per se, but it is defined to occur when the last handle gets closed. In the event someone else has a handle open, and you come along and call DeleteFile(), then yours is not the last handle so the file does not get deleted just yet. It enters what is called delete pending state, which means the name is still visible in the namespace yet no new handles are allowed to be opened. The delete work happens when the last handle gets closed.
If you perform a variation called a POSIX delete (bing FILE_DISPOSITION_POSIX_SEMANTICS), then part of the delete work happens when you close your handle, namely the removal of the name from the namespace. That makes a huge difference for things like reliably deleting a directory tree recursively (directories themselves can’t be deleted while they contain names). The rest of the delete work — deleting the streams, freeing the MFT record, and so on — still happens when the last handle gets closed.
The POSIX delete semantics look super useful – any disadvantages?
No real disadvantages other than it is only supported on NTFS, and also you have to write a bit more code than simply calling DeleteFile. But we have now had DeleteFile using POSIX delete for a couple months internally without issue.
We have also fixed the directory change notification perf issue described in this blog post. We became aware of it because of your blog, so thank you very much and keep doing what you are doing!
Oooh – interesting to hear that the directory change notification perf issue has been fixed. So does this mean that we can safely use larger notification buffers? That could be helpful for VsChromium. What version of Windows 10 is the fix in?
The fix will be in version 1903. This should make using larger buffers performant again. However it is unlikely to meet the bar for a backport, so take that into consideration w.r.t. any VsChromium changes.