Tue.Apr 25, 2023

article thumbnail

Ensuring secure applications for the public sector

Dynatrace

From the corridors of our county governments and municipalities to golden-domed state capitols to the nearly 700 federal office buildings in Washington, D.C., public sector leaders and their teams are progressing steadily toward the next chapter of their digital transformation. Ensuring secure applications amid rising complexity is a crucial part of this journey.

article thumbnail

KubeCon EU: Summary of Observability Day Europe

DZone

The KubeCon + CloudNativeCon event kicked off with a slew of off-site events. I dropped in on Observability Day Europe and wanted to share a few things I found interesting. This event was set up to foster collaboration, discussion, and knowledge sharing of cloud-native observability projects (including but not necessarily limited to Prometheus, Fluentd, Fluent Bit, OpenTelemetry, and OpenMetrics), as well as vendor-neutral best practices for addressing observability challenges.

Insiders

Sign Up for our Newsletter

This site is protected by reCAPTCHA and the Google Privacy Policy and Terms of Service apply.

Trending Sources

article thumbnail

Build and operate multicloud FaaS with enhanced, intelligent end-to-end observability

Dynatrace

As companies accelerate digital transformation, they implement modern cloud technologies like serverless functions. According to Flexera , serverless functions are the number one technology evaluated by enterprises and one of the top five cloud technologies in use at enterprises. The elasticity of serverless services helps organizations scale as needed.

article thumbnail

Feature Interaction Metrics

DZone

In software development, feature interaction occurs when the behavior of a software system is affected by the combination of features or inputs. Feature interaction can cause unexpected and undesirable behavior in software systems, which can be challenging to detect and resolve. Feature interaction matrices are one of the techniques used to identify and analyze feature interaction in software systems.

Metrics 130
article thumbnail

How to Create Load Tests with JMeter DSL from Selenium Scripts in Performance Testing Services

Abstracta

Selenium Conf 2023 may be over, but its learnings are sure to live on. In this article, I will give you an approach to what was my talk at the event, so you can have the step-by-step for creating load tests with JMeter DSL from. The post How to Create Load Tests with JMeter DSL from Selenium Scripts in Performance Testing Services appeared first on Abstracta Software Testing Services.

article thumbnail

The Benefits and Challenges of using Artificial Intelligence in Software Testing

Kovair

As technology continues to advance, the use of Artificial Intelligence (AI) in various industries is becoming more common. One area where AI has shown significant.

article thumbnail

Performance Testing Services: Everything about JMeter DSL at Selenium Conf 2023

Abstracta

Our CTO Roger Abelenda gave an approach for creating performance tests with JMeter DSL from Selenium scripts at Selenium Conf 2023. He taught something really useful for test automation and performance testing services: How to reuse Selenium tests to verify that a site works accurately. The post Performance Testing Services: Everything about JMeter DSL at Selenium Conf 2023 appeared first on Abstracta Software Testing Services.

More Trending

article thumbnail

Exploratory analytics and collaborative analytics capabilities democratize insights across teams

Dynatrace

Drowning under endless data? Having access to large data sets can be helpful, but only if organizations are able to leverage insights from the information. Exploratory analytics with collaborative analytics capabilities can be a lifeline for CloudOps, ITOps, site reliability engineering, and other teams struggling to access, analyze, and conquer the never-ending deluge of big data.

Analytics 205
article thumbnail

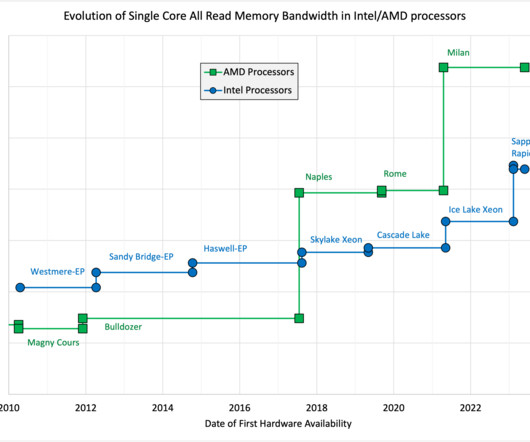
The evolution of single-core bandwidth in multicore processors

John McCalpin

The primary metric for memory bandwidth in multicore processors is that maximum sustained performance when using many cores. For most high-end processors these values have remained in the range of 75% to 85% of the peak DRAM bandwidth of the system over the past 15-20 years — an amazing accomplishment given the increase in core count (with its associated cache coherence issues), number of DRAM channels, and ever-increasing pipelining of the DRAMs themselves.