
As a leader in cloud infrastructure and platform services, the Google Cloud is fast becoming an integral part of many enterprises’ cloud strategies. At Dynatrace, we’re seeing this adoption within our customer base, which is driven largely by the increase in Kubernetes and Cloud Native Computing Foundation projects.
However, as businesses migrate to the Google Cloud, they’re faced with even more complex, distributed environments that are inherently difficult to observe and operate. Suddenly, not just DevOps, but infrastructure teams, developers, and operations teams are all challenged to understand how performance problems within applications or cloud services may impact the performance of the overall infrastructure.
Simplified cloud complexity with fully automated observability of Google Cloud
Dynatrace already supports key Google Cloud services with the amazing OneAgent. Dynatrace provides out-of-the-box distributed tracing for Kubernetes and Google App Engine stacks, as well as full-stack Kubernetes Container Optimized OS support. These capabilities enable deeper insights into all areas of GCP environments, which in turn allows businesses to quickly troubleshoot performance issues, optimize container workloads, and efficiently scale cloud operations.
Today Dynatrace announces additional enhancements that will help you understand how the performance of cloud services impacts your business so that you can confidently optimize and deliver exceptional user experiences. With its improved GCP capabilities, Dynatrace helps you move workloads to the cloud, build great applications, and drive innovation in hybrid and multi-cloud environments.
Understand and prevent issues with complete observability into your GCP services
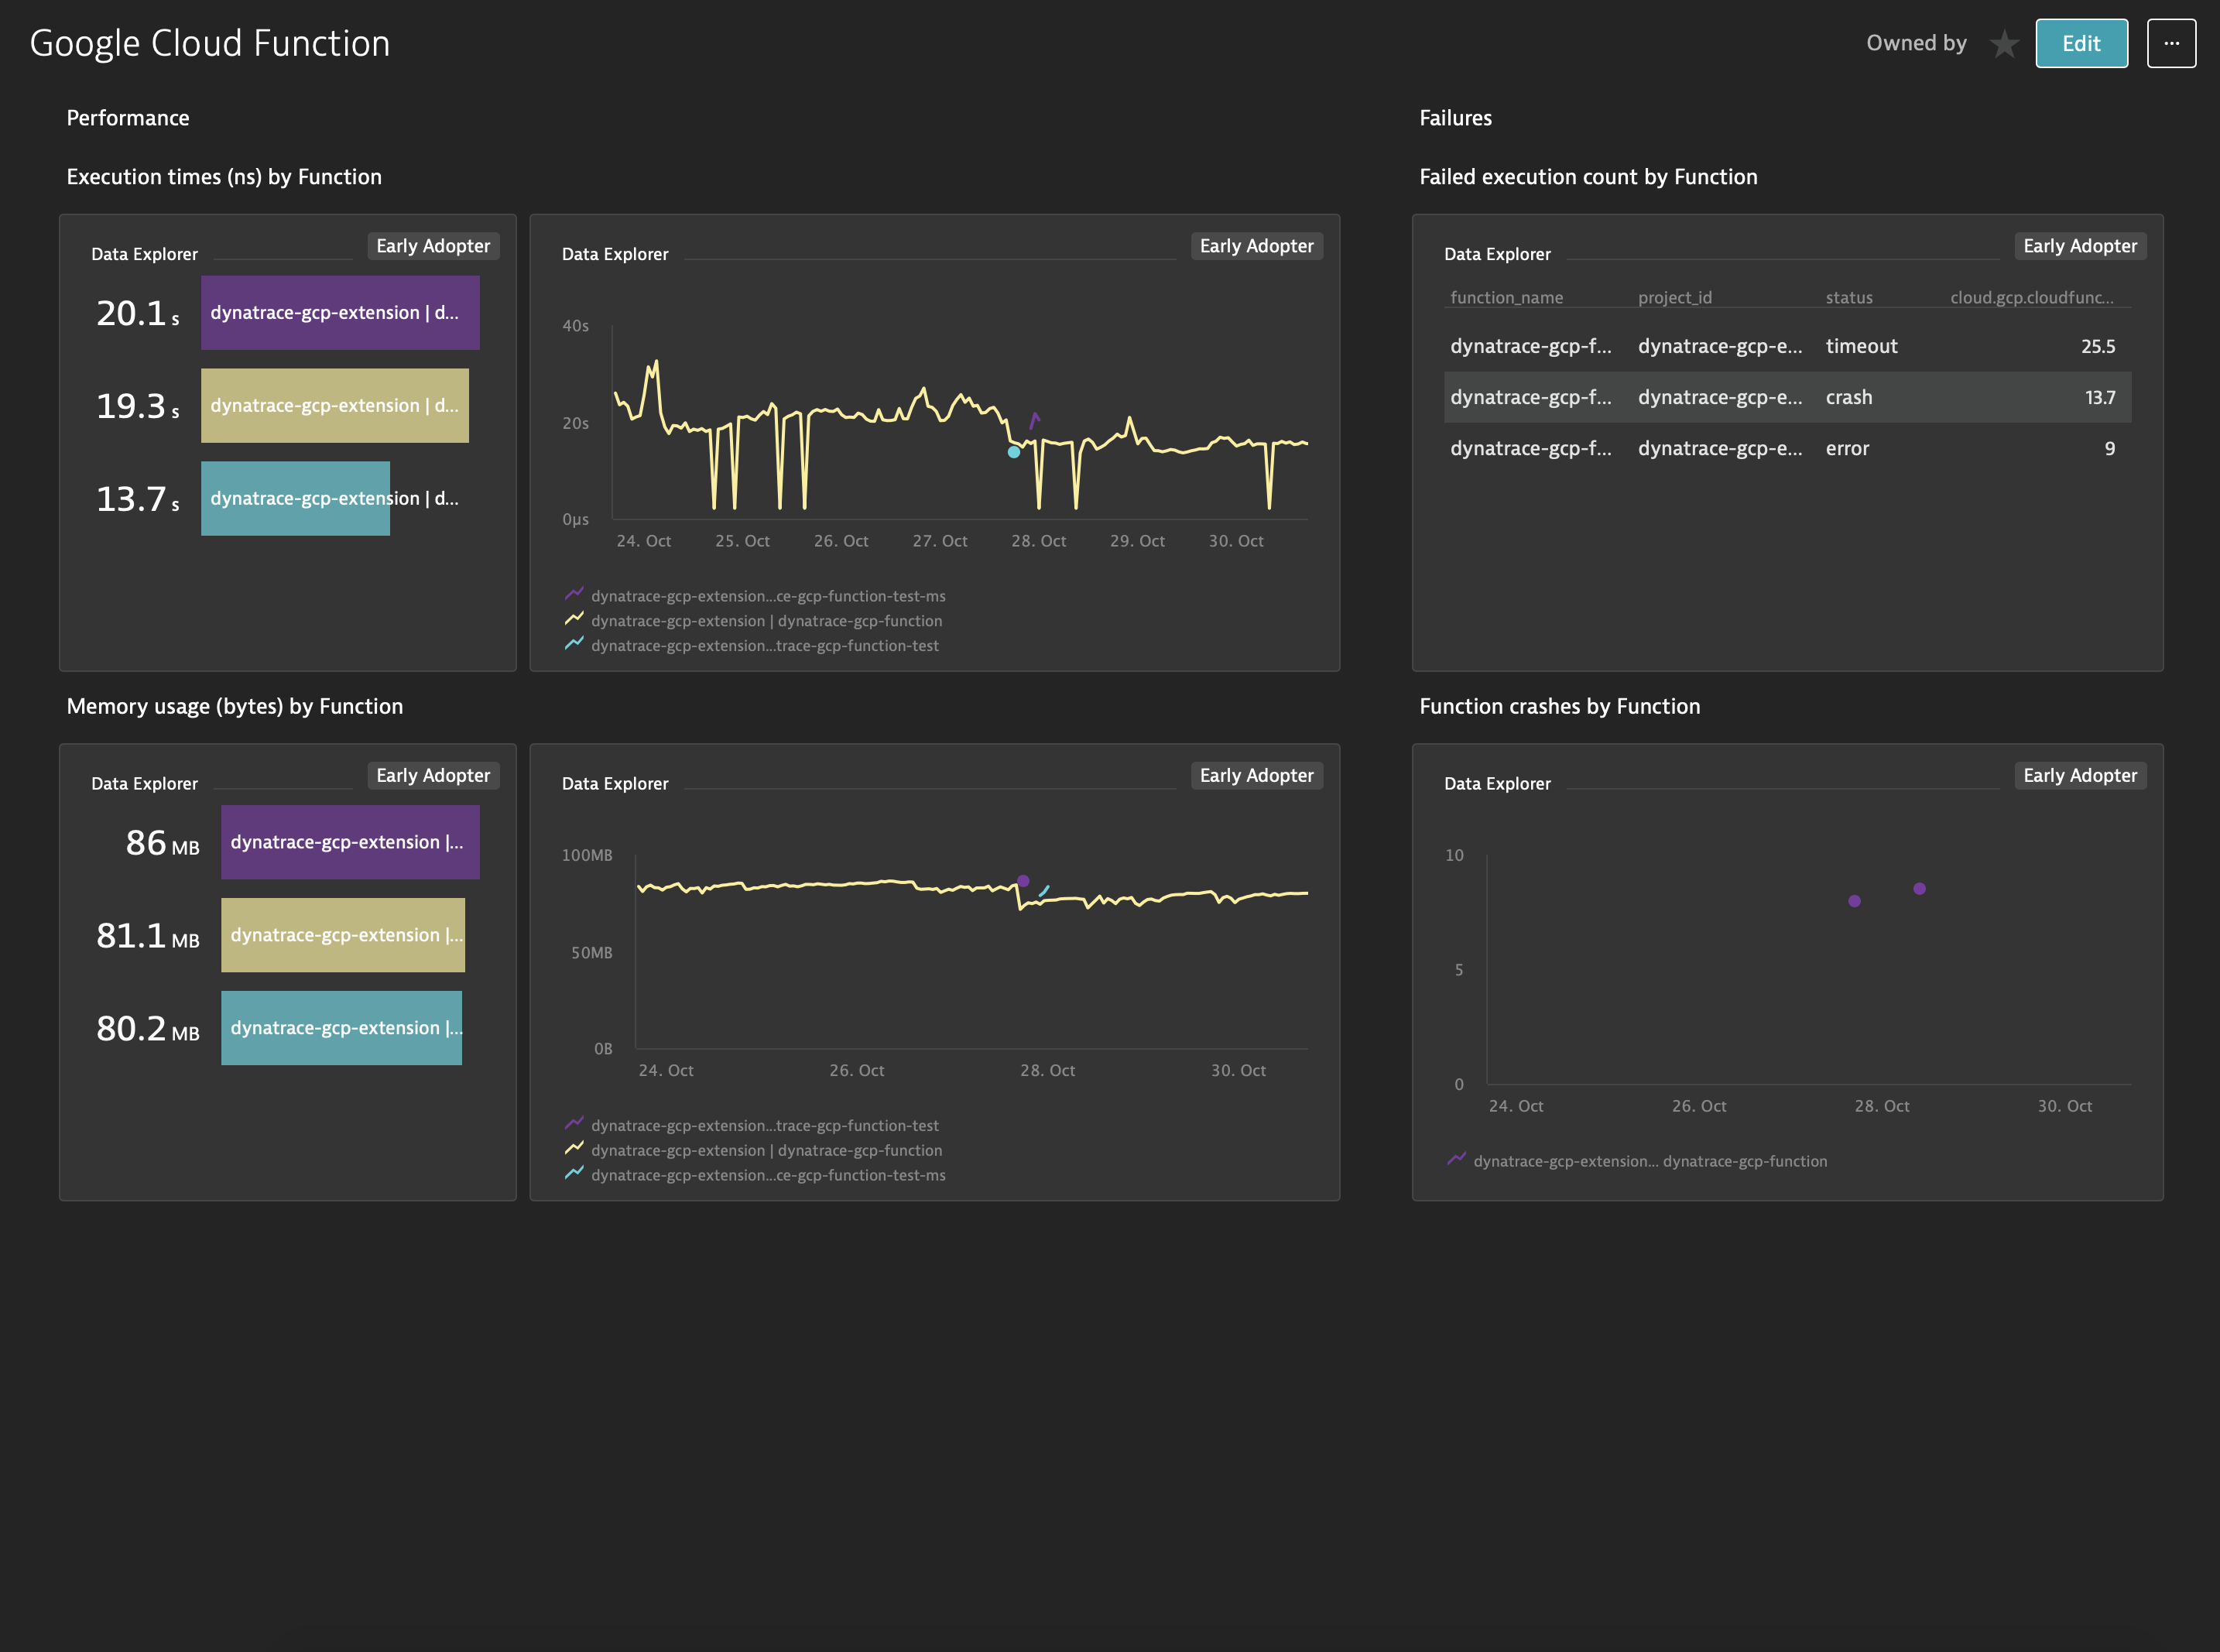
As an example of what you can now achieve with Dynatrace monitoring of GCP, let’s take a look at the Google Cloud Function service.
As a developer, you might use Google Cloud Function for serverless components. In order to optimize your code and resource consumption, you need to understand the memory consumption of your distributed workload. But the fact that there is no host to monitor makes this a challenge, especially if the failure rate is growing.
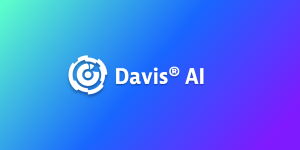
Complete observability with Dynatrace provides you with all the metrics from all your Cloud Functions and services across your GCP projects and displays them on dashboard charts. All user requests and performance optimizations can be tracked here in real-time. Furthermore, our Davis® AI engine alerts you when metrics diverge from baselines, so you can quickly understand the impact of an issue and prevent it from proliferating and potentially impacting your business.
We know that your environment may contain many different cloud services. Cloud Function is just an example on how out-of-the-box dashboards can help you. The Dynatrace solution installs predefined dashboards for the following services:
- Google Cloud SQL
- Google Cloud Datastore
- Google Cloud Load Balancing
- Google Cloud Pub/Sub
- Google Cloud Filestore
- Google Cloud Storage
- Google Cloud APIs
How to get started
The installation process and architecture are well documented and described in the GitHub repository.
Set up resources with a script
The quickest way to start monitoring your GCP projects is to run the provided bash script. The script creates the required resources for sending data to Dynatrace. If you’d like to use the bash script shortcut, simply follow the instructions.
Leverage Kubernetes to monitor GCP projects
We know that many customers use Kubernetes in their GCP environments. If you run containers, you might be interested in using our Docker image and Kubernetes template. If this is your preferred way of deployment, just follow the instructions.
Note: All metrics coming from monitored Google Cloud environment will consume Davis Data Units (DDUs). Learn more about our licensing model.
Join the community and contribute
To give you early access to newly developed features, we regularly publish features on GitHub in experimental branches. If you want to stay one step ahead of the game and get the latest innovations, keep an eye on, contribute, and explore our GitHub Repository.
What’s next for Dynatrace and Google Cloud
Dynatrace continues to advance industry-leading services and support for GCP. In future Dynatrace releases, you can expect to see:
- Increased, robust observability of all GCP services in hybrid and multi-cloud environments
- Intelligent and automated Log Monitoring for Google Cloud Services
- AI-powered root cause analysis and contextual information for even faster MTTR
Your feedback
We’d like to hear what you think about our support for new GCP services. Please share your thoughts with us at Dynatrace Community or GitHub.
If you’re not yet using Dynatrace, visit our trial page and sign up for a free 15-day Dynatrace trial.
For more information about Dynatrace support for Google Cloud, download our free eBook: 5 Key considerations for monitoring Google Cloud or learn more at Dynatrace Google Cloud.

Looking for answers?
Start a new discussion or ask for help in our Q&A forum.
Go to forum