
In the last blog post of this series, we delved into how Dynatrace, functioning as a deploy-stage orchestrator, solves the challenges confronted by Site Reliability Engineers (SREs) during the early of automating CI/CD processes. Having laid the foundation during the deployment stage, we’ll now explore the benefits of Dynatrace visibility and orchestration during the testing phase.
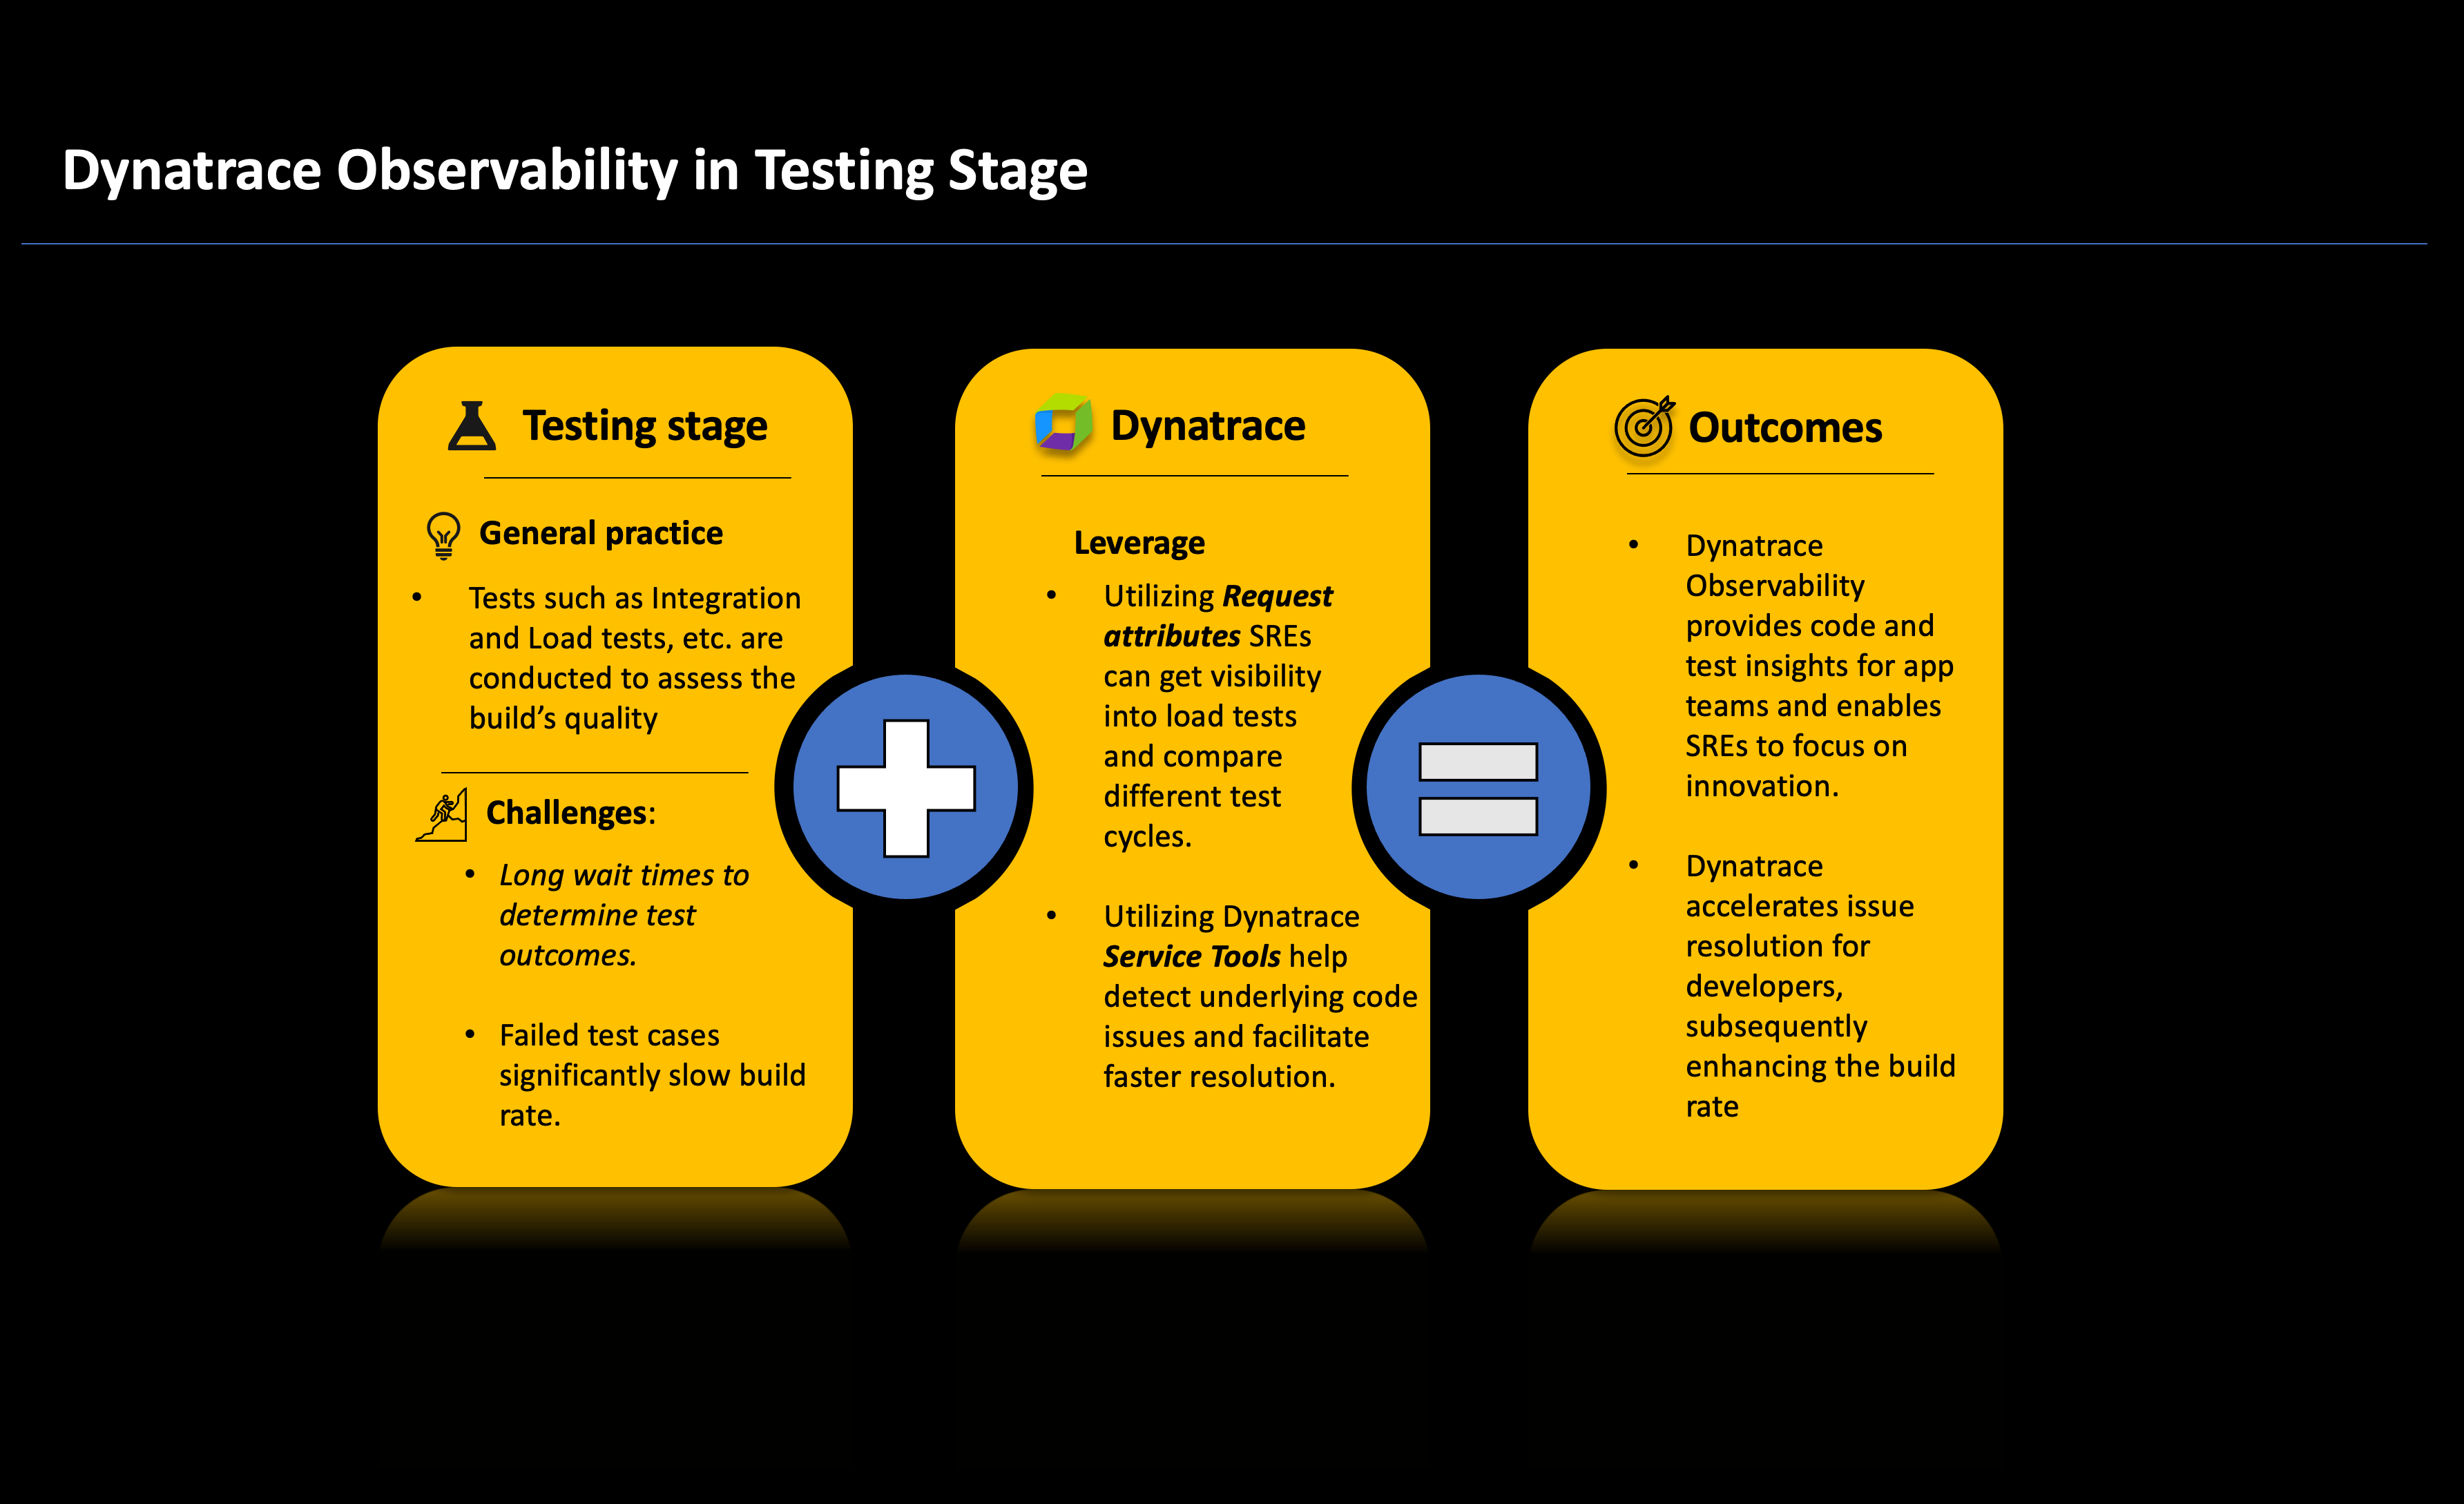
The testing stage plays a crucial role in ensuring the quality of newly built code through the execution of automated test cases. Testing includes integration tests, which assess whether the code functions as intended when interacting with other services and application functionalities. It can also include performance testing to determine if the application can effectively handle the demands of the production environment.
Mitigate challenges during the testing stage
Like the build stage, the testing stage is time-sensitive and can consume a significant amount of time for execution, in turn creating a substantial waiting period for SREs to determine the success or failure of tests and the need for retesting. This slow feedback and time spent rerunning tests can hinder the overall software deployment process.
To mitigate these challenges, building upon the groundwork established during the deploy phase, Dynatrace can effectively pinpoint any issues encountered during testing. Moreover, by configuring alert notifications through native features such as ownership and alerting profiles, teams can receive prompt alerts in the event of failures. This proactive strategy significantly minimizes wait times and empowers SREs to redirect their focus toward innovative endeavors.
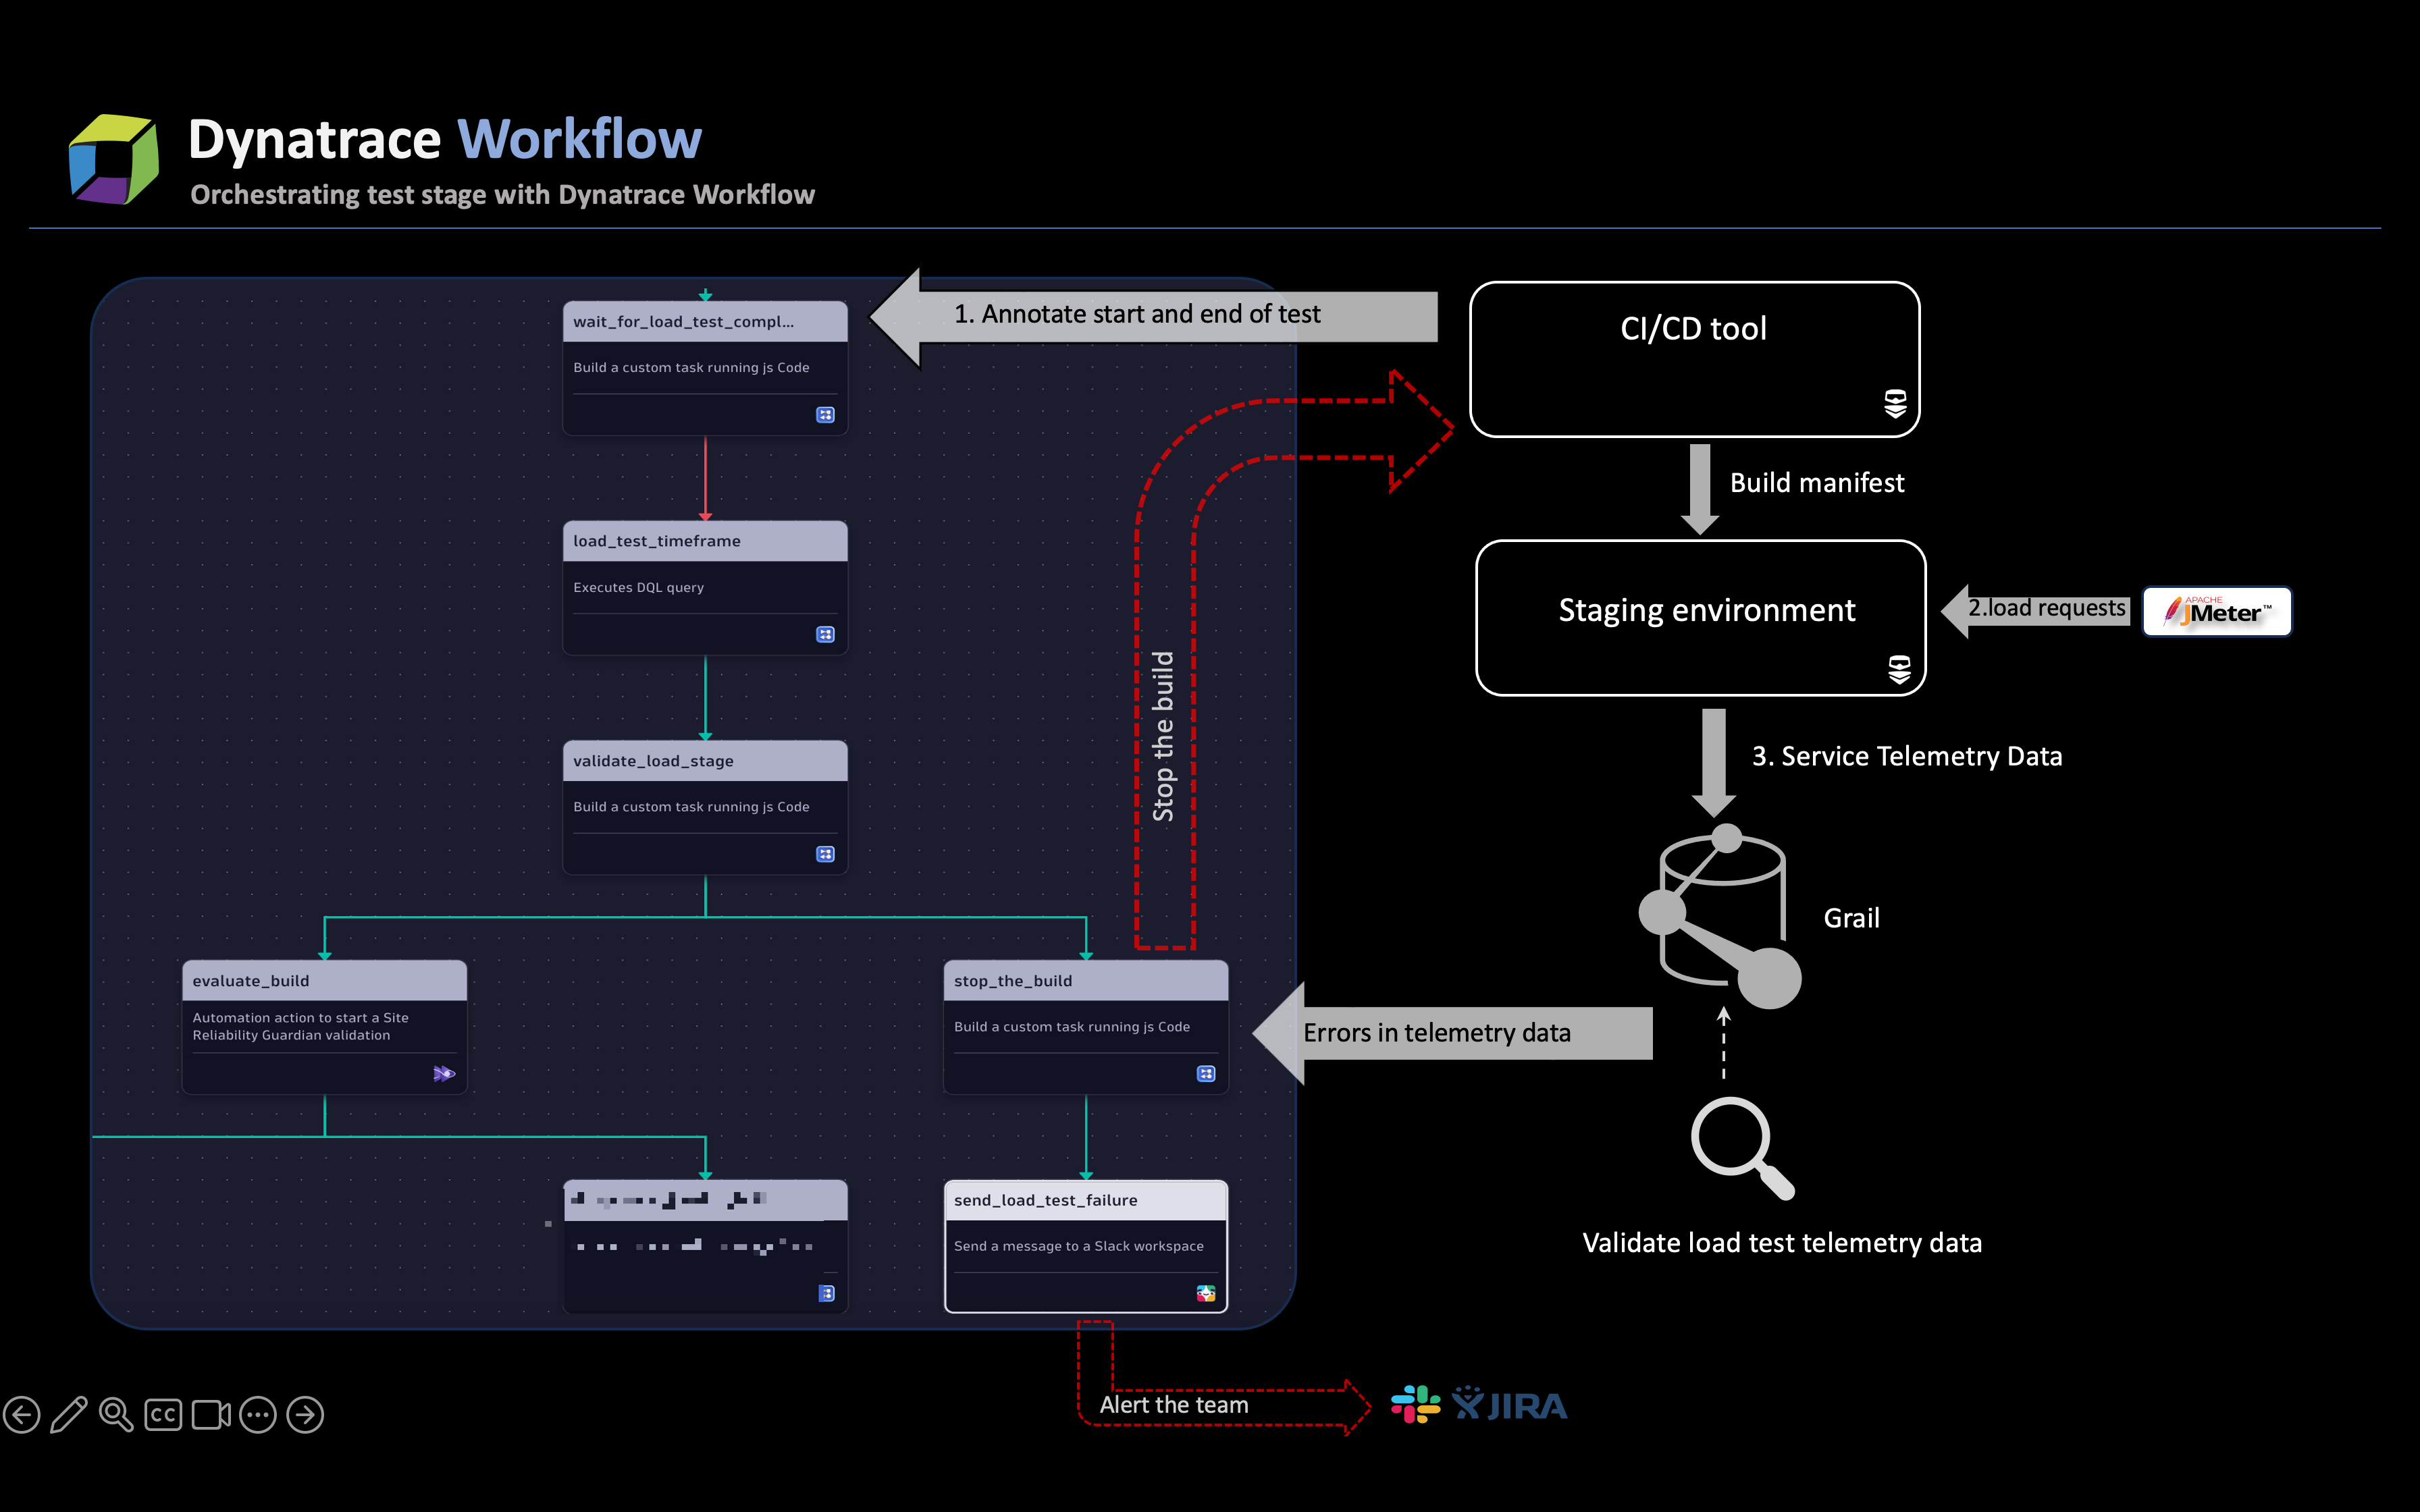
The steps outlined below show you how to achieve such a proactive solution.
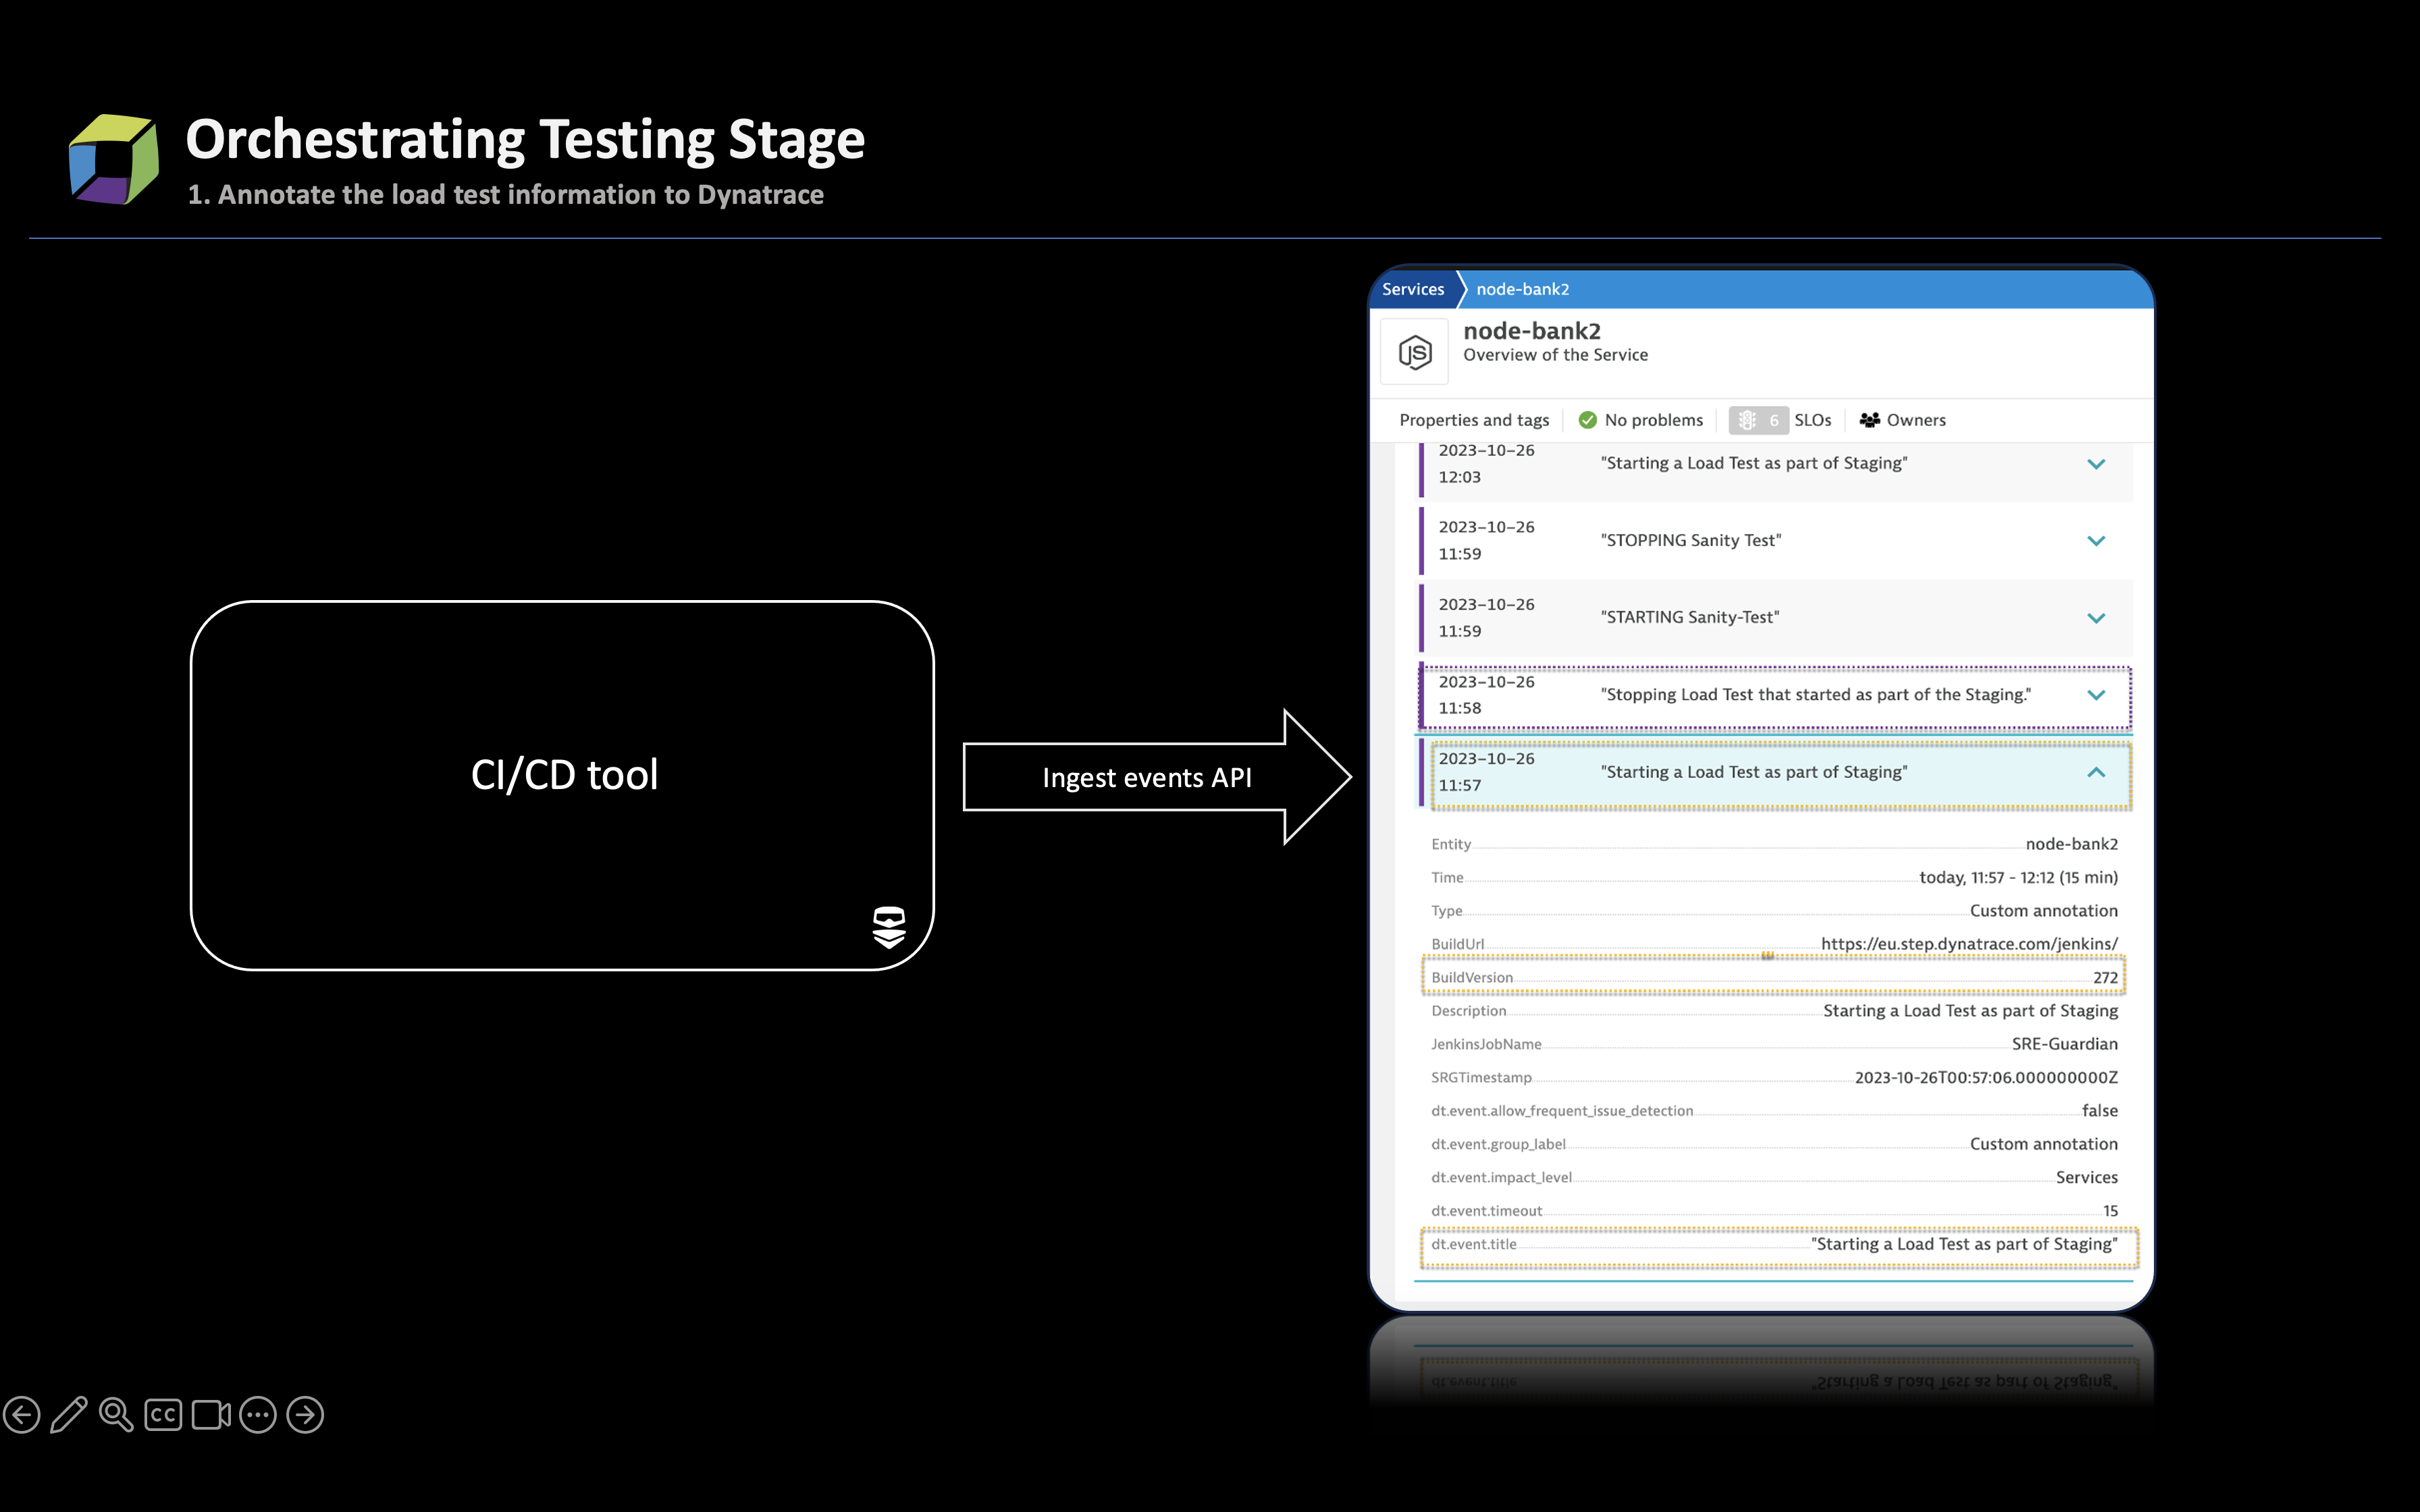
- Pass annotation events to Dynatrace, leveraging the Ingest events API, at the beginning and end of each test. These events provide additional context to the Davis® AI causation engine in case of issues and function as logic operators for the execution of advanced testing, such as soak, integration, or chaos engineering.
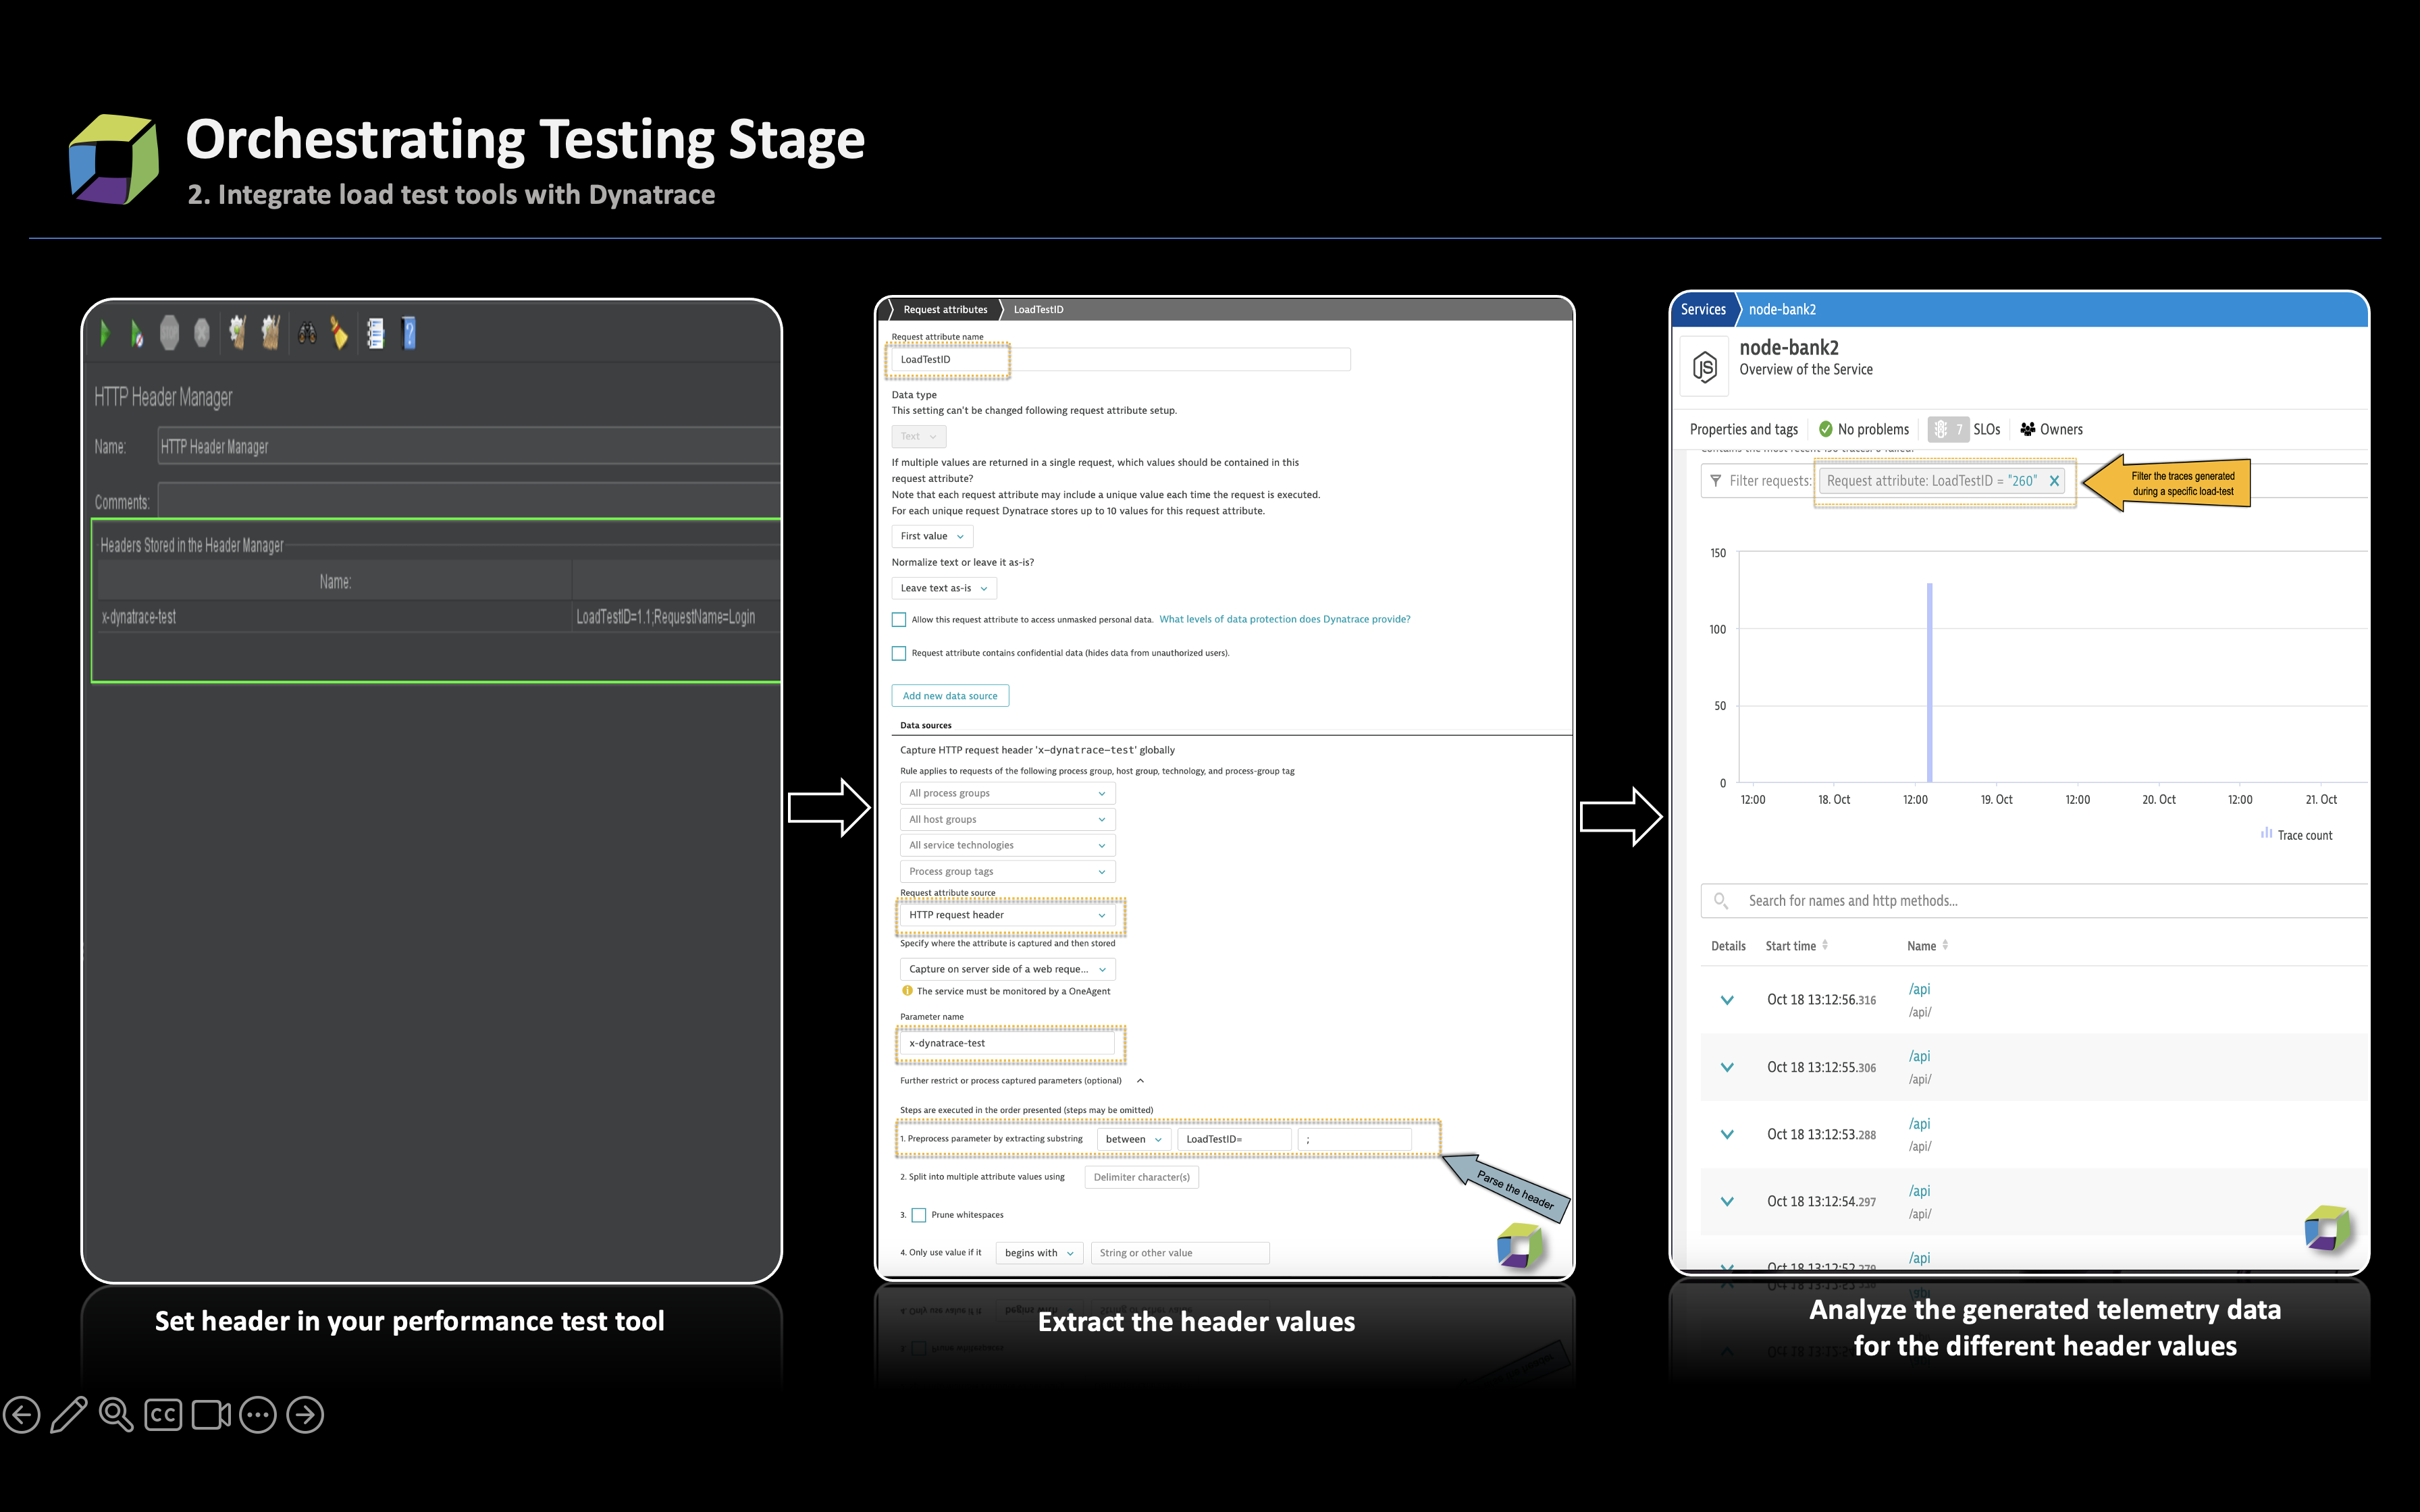
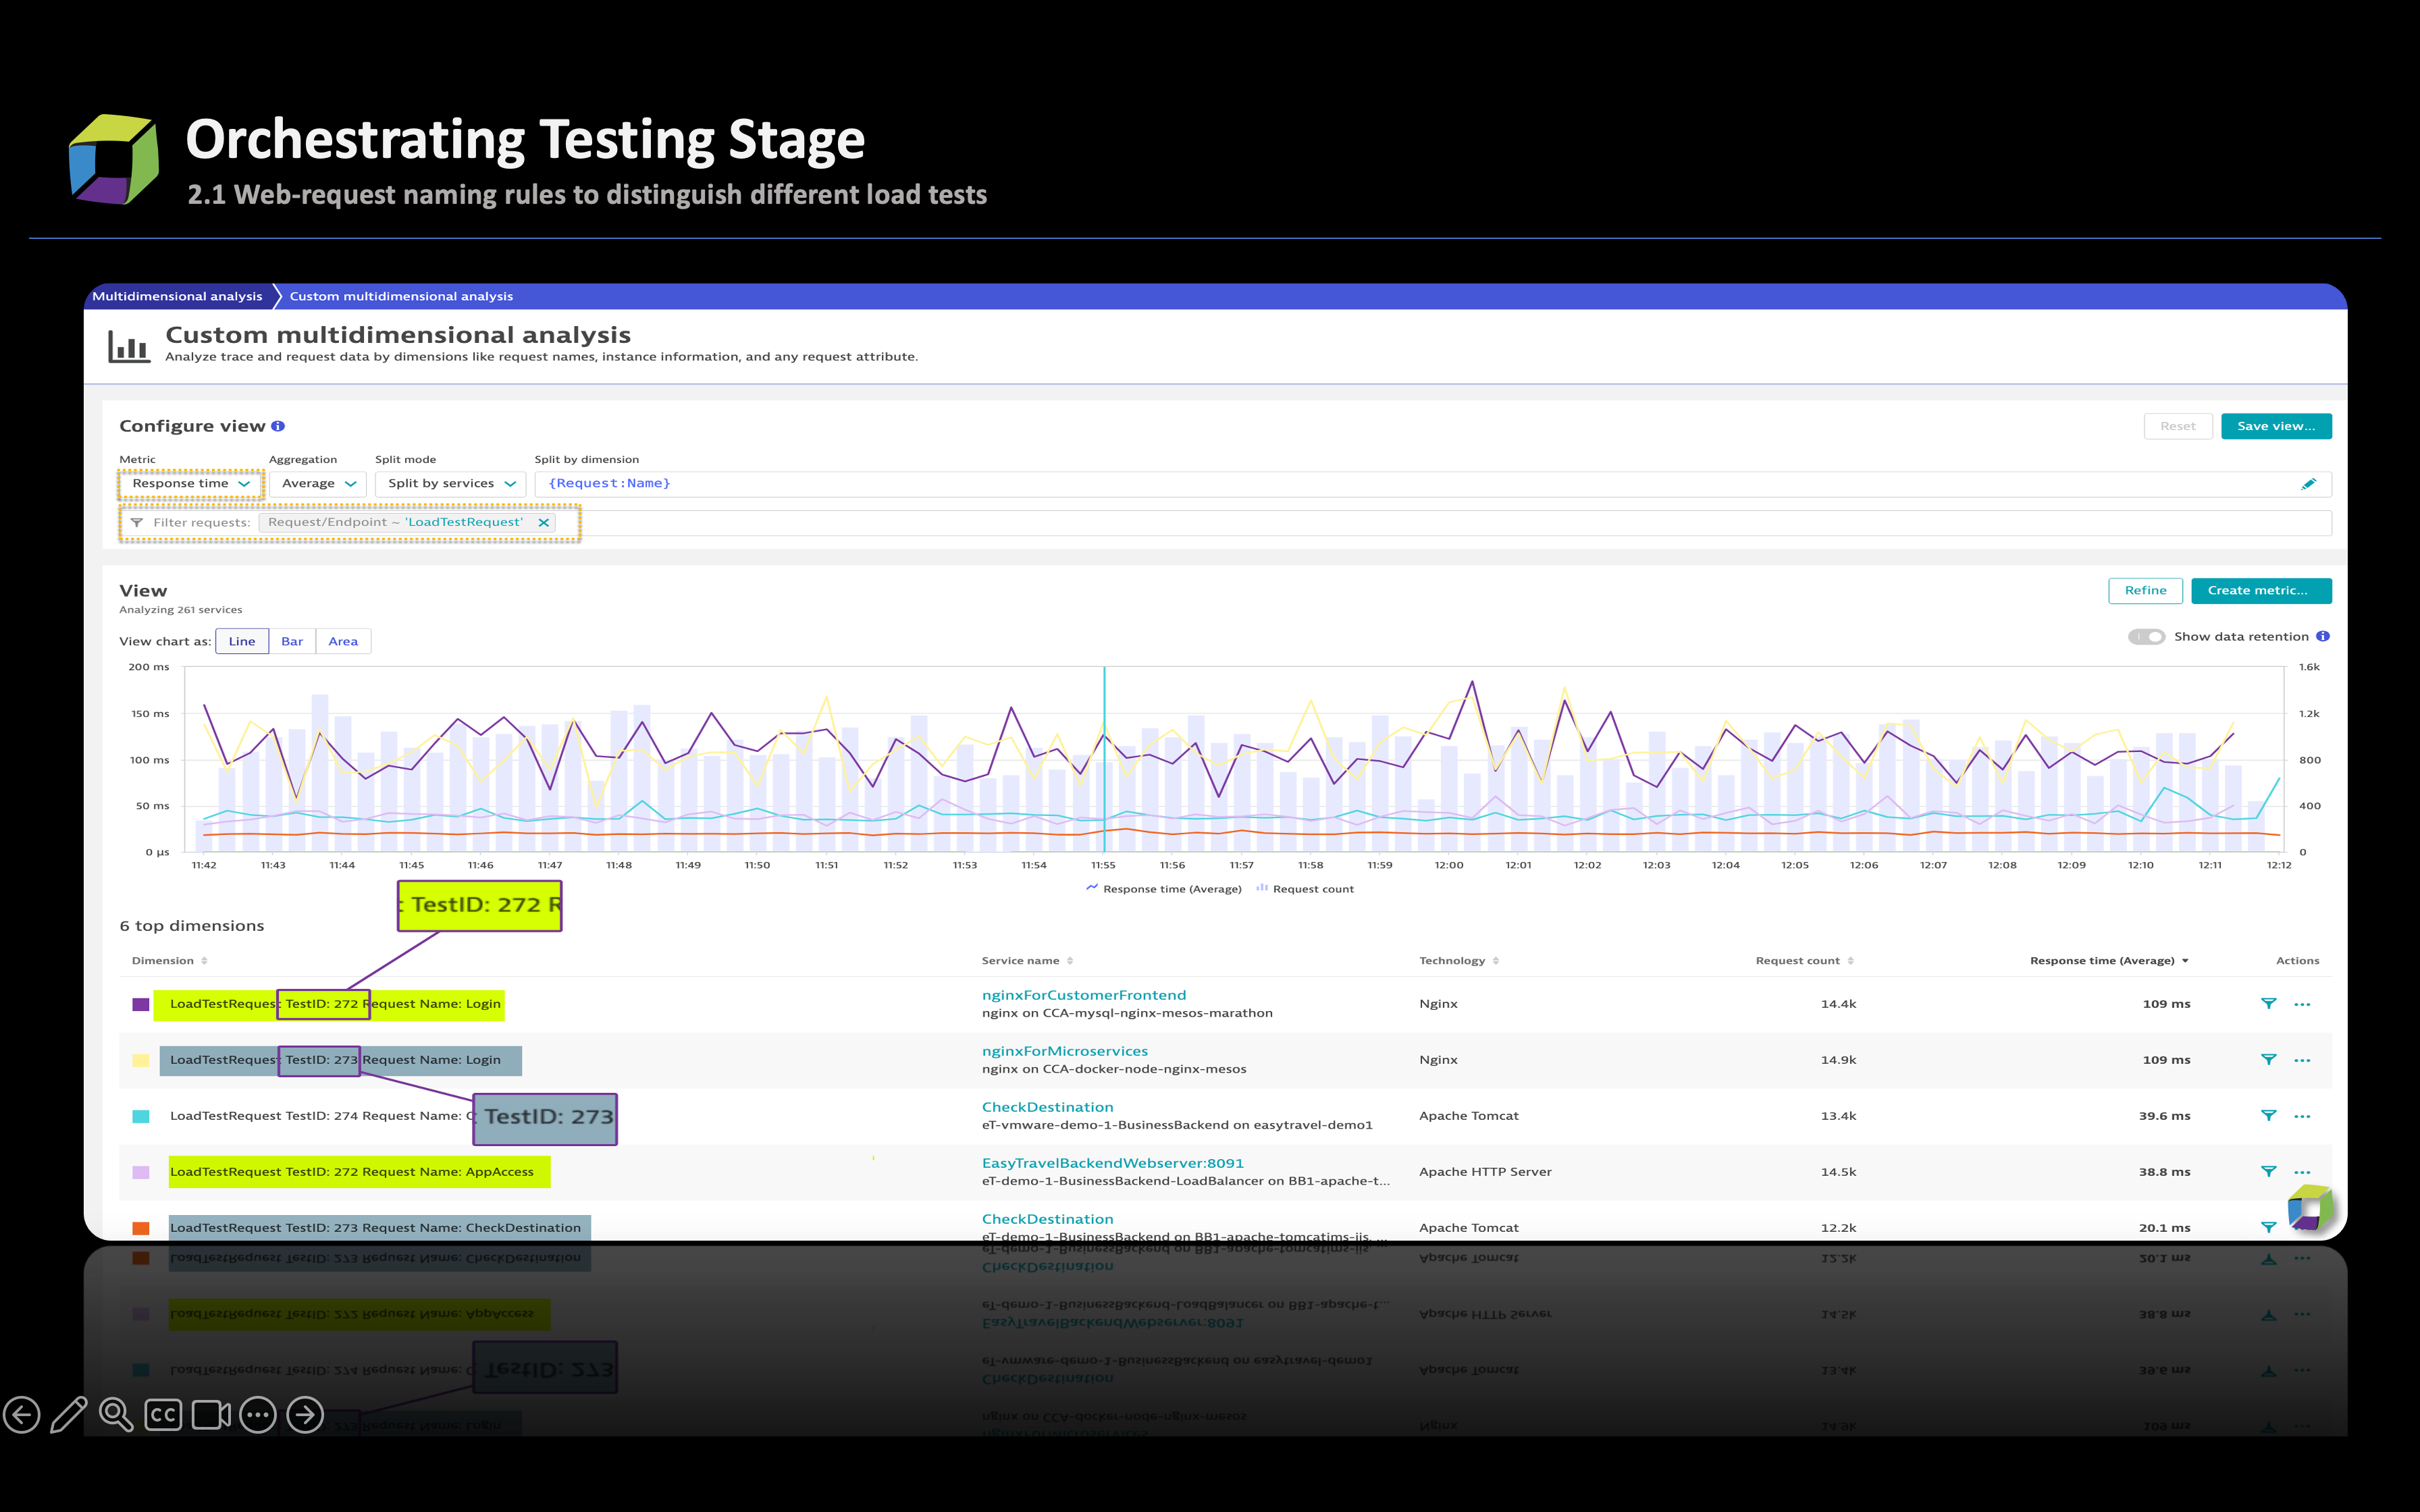
- Integrate performance test tools with Dynatrace by adding headers to HTTP requests. Further, harness request attributes and telemetry data gathered from requests to gain insights into the requests.
- (Optional) Set web request naming rules using the earlier configured request attributes to facilitate easy identification of requests across different releases or test suites.
- During the execution of tests, the telemetry data generated by the newly built code is transmitted to Grail through OneAgent.
 The data is examined and can fall into one of the below two categories:
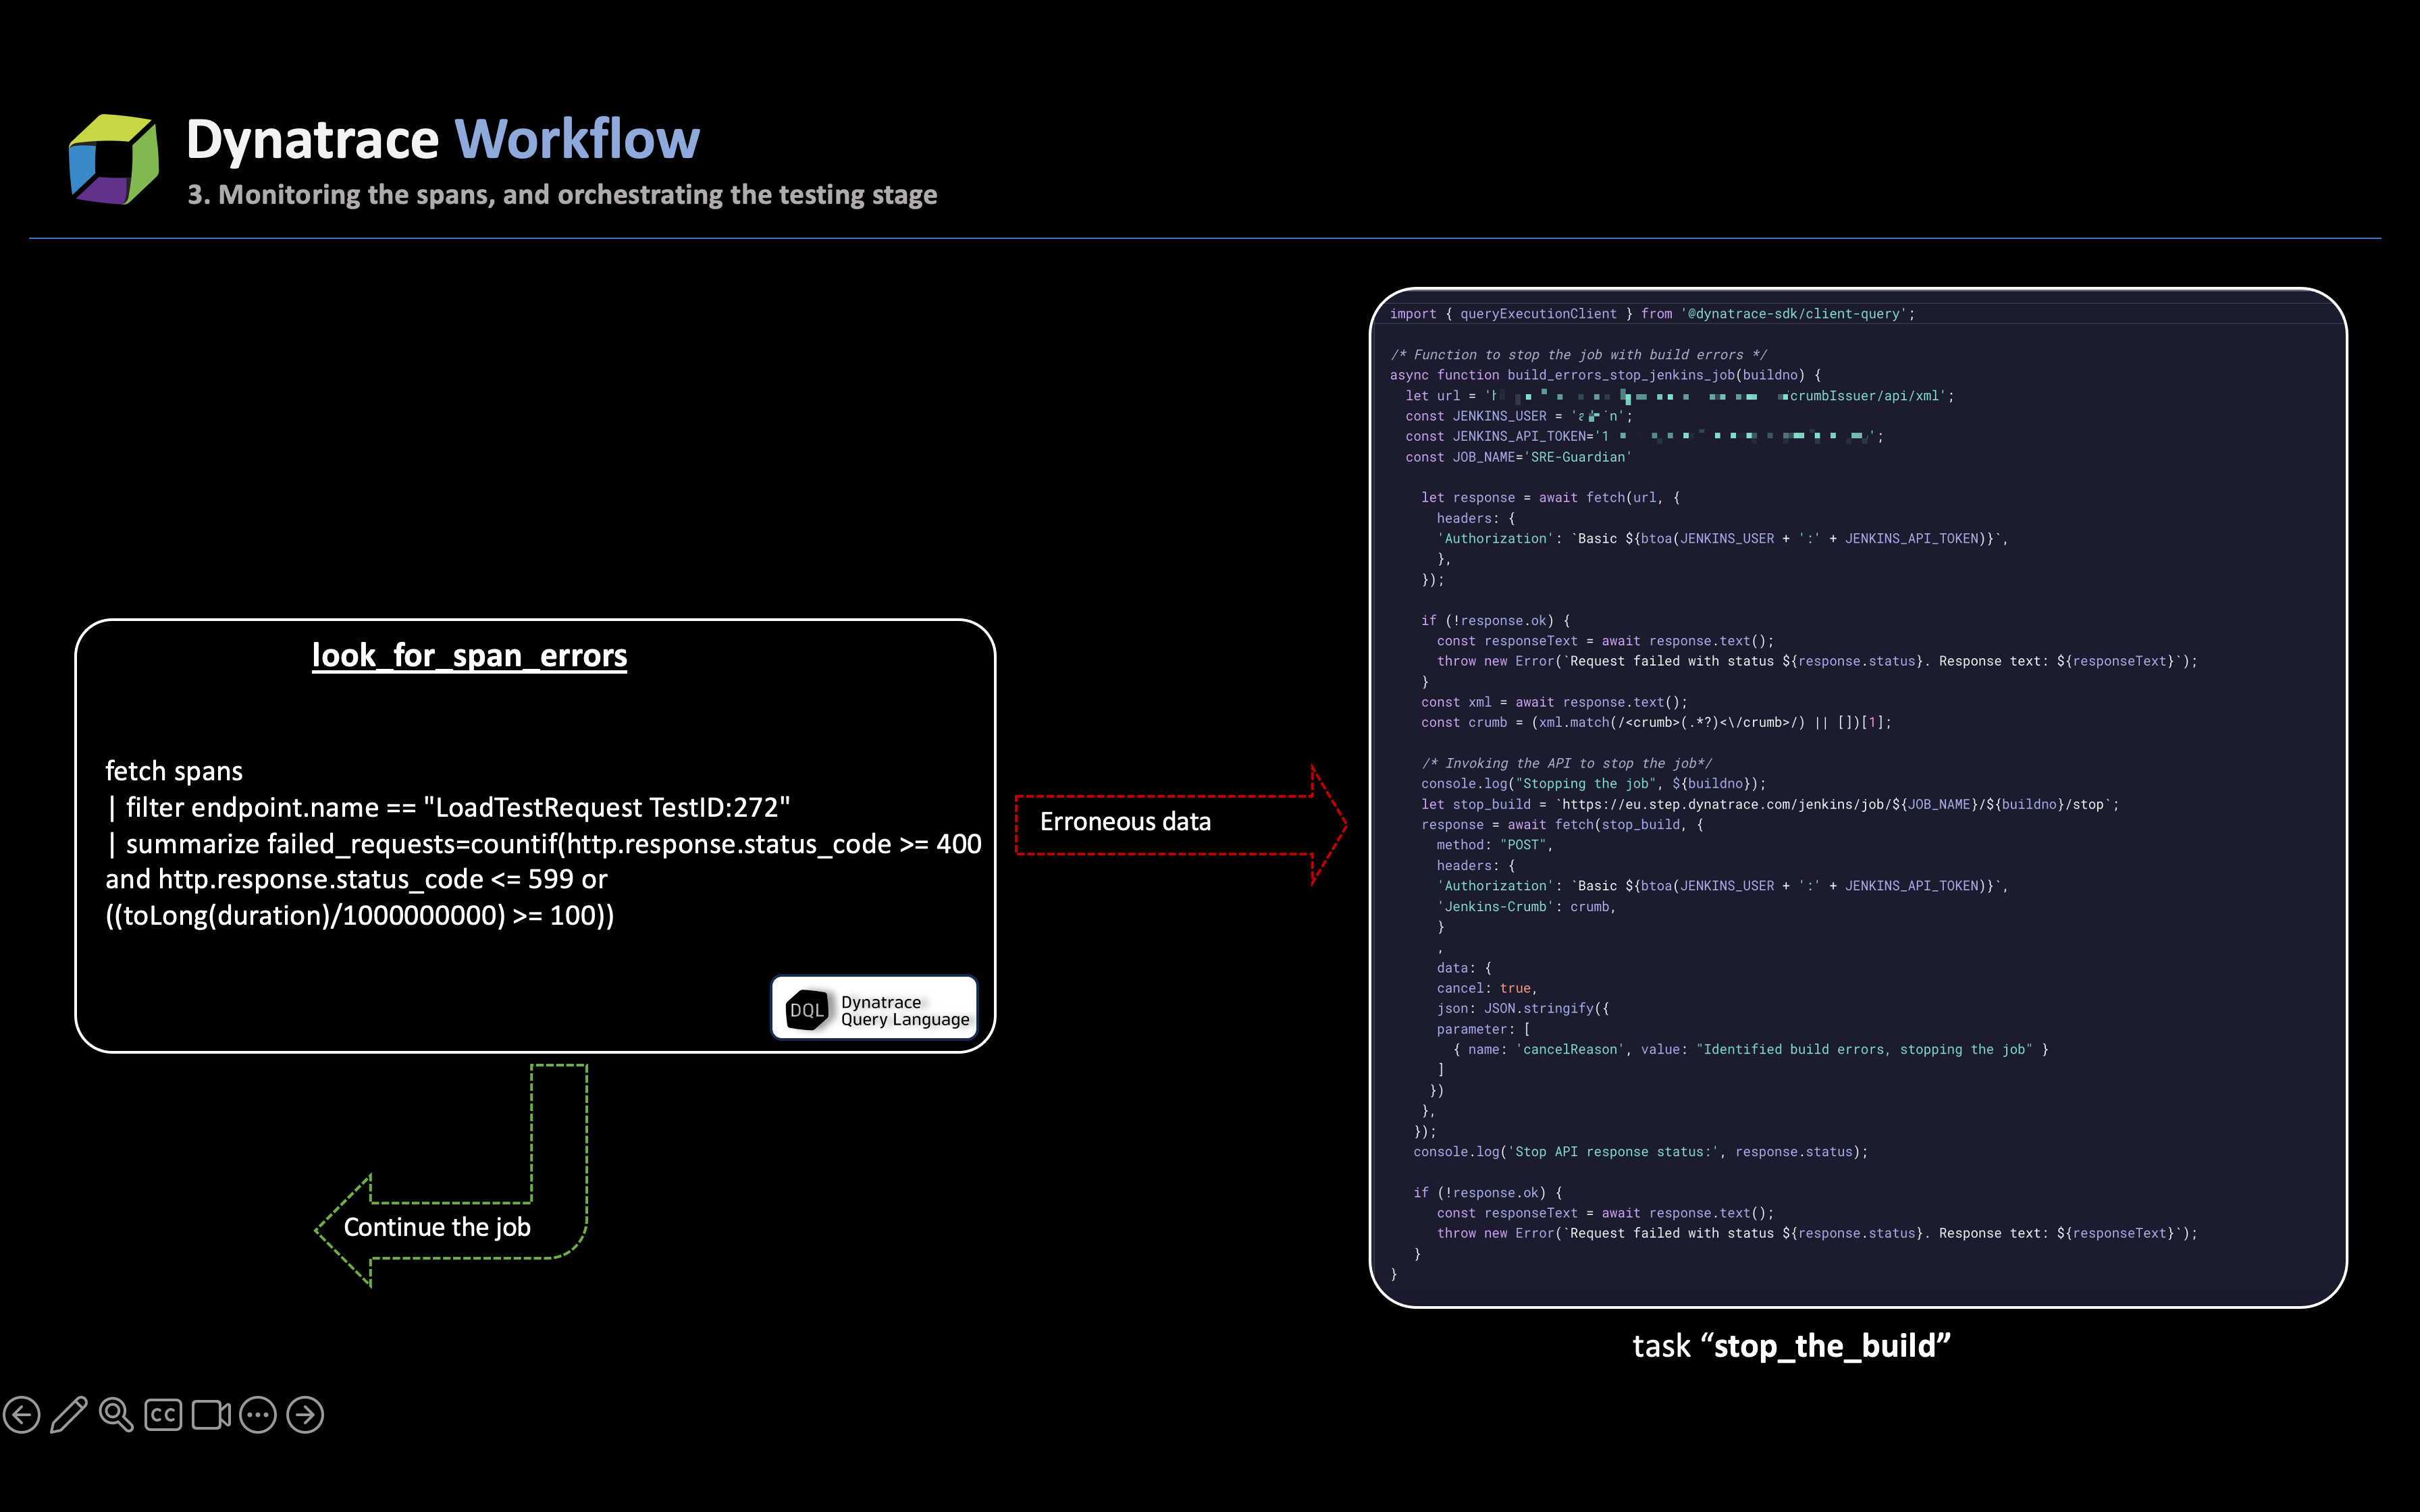
If there are errors in the telemetry data
If there are errors in the telemetry data, the task immediately marks the stage as problematic and triggers the process to stop the ongoing job. The stop_the_build task utilizes the CI/CD API (in this case, Jenkins) to halt the build. This task also retrieves additional job metadata to include in the generated message.
In tandem with stopping the job, another task in the workflow,
send_load_test_failure, is triggered: a Slack message is dispatched to the team responsible for initiating the job. The immediate alerting mechanism ensures that SREs are promptly informed about test errors, thereby circumventing the high wait times.If there are no errors and the outcome is successful
If there are no errors reported in the data, the pipeline job will proceed to conduct integration and reliability tests, which will be validated in the final validation stage by the Site Reliability Guardian (SRG). During this phase, SRG will validate the test coverage to assess the impact of the newly introduced code and determine its suitability for promotion to the production environment.
Optional best practices
Optionally, the following best practices are recommended to achieve the most effective outcomes.
- During the testing stage, generate on-demand synthetic monitors to monitor the performance of the application as experienced by your end users in different geolocations.
- Generate SLOs, leveraging the Dynatrace API, that will be validated in the next stage to determine if the build should be rejected or promoted to production.
Test stage orchestration in a platform engineering context
Dynatrace, integral to platform engineering, offers invaluable visibility into test results and accelerates the test cycle by swiftly identifying and resolving underlying issues. Utilizing service tools like response hotspots and distributed traces, along with Davis causal AI, dev teams can achieve fast turnarounds in the event of test failures. Dynatrace root cause analysis enhances collaboration, providing a comprehensive solution for optimizing testing phases so that they allow for a more agile and productive development cycle, fostering a culture of continuous improvement and accelerating overall software delivery.
Also, to optimize the workflow for both SREs and application teams, leverage Dynatrace dashboard capabilities to expand your data visibility. This allows for easy comparisons of telemetry data across different releases and enables the utilization of service tools for in-depth analysis, ultimately contributing to service optimization.
Conclusion
In conclusion, this blog post examined how Dynatrace capabilities and telemetry data can enhance the success of the testing stage. In the next blog post in this series, we delve deeper into how Dynatrace can further streamline the promotion of new code to production.


Looking for answers?
Start a new discussion or ask for help in our Q&A forum.
Go to forum