
When it comes to platform engineering, not only does observability play a vital role in the success of organizations’ transformation journeys—it’s key to successful platform engineering initiatives.
At the 2024 Dynatrace Perform conference in Las Vegas, Michael Winkler, senior principal product management at Dynatrace, ran a technical session exploring just some of the many ways in which Dynatrace helps to automate the processes around development, releases, and operation.
The various presenters in this session aligned platform engineering use cases with the software development lifecycle. Each use case provides its own unique value and impact, and whoever sees value in the use cases can adopt it—whether they are a platform engineer, DevOps engineer, performance engineer, or a site reliability engineer (SRE).
Check out the following use cases to learn how to drive innovation from development to production efficiently and securely with platform engineering observability.
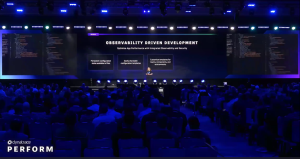
Observability-driven development
Yarden Laifenfeld, senior software engineer at Dynatrace, presented the first use case for the software development lifecycle (SDLC): observability-driven development, which is the process of integrating observability and security before the first line of code is even written.
With observability-driven development, developers can understand what’s going on in their application in real time, early on. The whole organization benefits from consistency and governance across teams, projects, and throughout all stages of the development process.
Laifenfeld reviewed the benefits supported by observability-driven development with Dynatrace, including the following:
Templates for collaboration. With Dynatrace, organizations can easily define everything pertaining to observability, security, ownership, synthetic monitoring, and automation workflows using simple configuration files, which also ensure a persistent configuration state. Configuration as code is easy to use, update, and understand. Additionally, it can enable the creation of templates from these configurations, which teams can easily share between projects and services.
Standards for consistency. Organizations can then take these templates and standardize them. These standards can be custom for specific teams, technologies, or criticalities. Standards are set by the platform engineers and ensured throughout all stages of the software development lifecycle.
Real-time detection for fast remediation. Teams aspire to find and fix any issues as early in the software development lifecycle as possible by integrating observability and security capabilities. With observability, organizations can easily detect any performance bottlenecks, bugs, or security vulnerabilities earlier. And when issues are detected, the SLOs affected and the team with ownership over that service becomes visible, allowing for increased accountability and a faster fix time. Essentially, by bringing observability and transparency to developers, they’re able to gain real-time insights into what’s happening in their application and understand how their service is behaving in a real-life scenario.
Continuous testing validation
Gala Dvoretskaya, senior principal for digital experience at Dynatrace, discussed how observability enables continuous testing validation to support a seamless release process.
When organizations cross-validate with observability, security, and synthetic data, evaluation times shrink from days to minutes. Development teams can reference the following use cases to understand the benefits of observability-driven software releases with Dynatrace:
Easily consolidate and validate test results across tools. Using Dynatrace Workflows, users can execute a variety of different tests after the successful deployment of new releases.
Ensure seamless user journeys in every new release. Developers can validate the quality of their releases and ensure that user journeys meet customer expectations.
Automatically analyze and debug releases. Using Dynatrace, teams can directly access their synthetic monitors and drill down into locations where, for example, execution failed because of local or global outages. Users can also pull up the execution history and compare it to the successful execution, isolating the problematic areas.
Progressive delivery
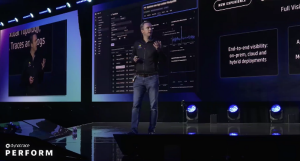
Next up, Adam Gardner, staff engineer at Dynatrace, talked about using observability for faster innovation in production to enhance new releases.
According to Gardner, teams gradually deliver software to user groups with progressive delivery. The goal is to use the stepped release to minimize risk and error exposure so customers won’t get hit by an issue in production.
When releasing into production, Gardner said it’s important to think beyond performance metrics. With Dynatrace, teams can focus on other data like potential risks or pull data from third parties and get the answers they need—not just the data. Organizations get end-to-end observability from code to production with the right data in context.
Pipeline observability
Gardner then reviewed the importance of pipeline observability. Out of the thousands of business-critical pipelines, organizations need real-time observability of those pipelines. And that’s where lifecycle events come in. By standardizing what pipelines do—a pipeline started, a pipeline finished, a pipeline failed–Dynatrace enables organizations to understand how, when, and where pipelines are being used, and where the bottlenecks are.
Observability for infrastructure
Next up, Guido Deinhammer, CPO for infrastructure observability at Dynatrace, dove into the use case for observability across infrastructure and talked through new application offerings from Dynatrace.
According to Deinhammer, once software is released into production, it’s usually deployed at a large scale—often in complex multicloud or hybrid setups. Because of this, it’s critical for organizations to have end-to-end visibility across on-premises, cloud, and hybrid deployments. He goes on to review the following newly launched capabilities from Dynatrace:
Infrastructure & Operations app. The new Dynatrace Infrastructure & Operations app provides ITOps and SRE teams with an up-to-date and comprehensive view of their monitored environments. The app offers a consolidated overview across data centers and all monitored hosts. The app helps users quickly identify areas that require attention and drill down to the host level, where all necessary information is provided to quickly address any issue.
Databases. The new observability app for databases from Dynatrace was built to cater to all requirements of database administrators (DBAs), from swiftly assessing database availability and performance to delving into architectural intricacies for efficient troubleshooting. It also provides a single source of truth for all involved stakeholders and elevates problem resolution by uniting DBAs, application owners, and ITOps through a single, intuitive interface.
Dynatrace® Clouds app. The new Dynatrace Clouds app enables seamless management of multicloud environments and provides insights across multiple cloud services in a single, integrated view. It provides a cross-cloud overview of cloud services, their instances, and health, enabling cloud resource usage analysis and optimization with analytics notebooks. It helps teams to find under or overutilized resources and components quickly.
In addition to these new apps, Deinhammer discussed how Dynatrace Log insights and out-of-the-box dashboards and notebooks can help give organizations a complete picture of how their infrastructure is operating.
Kubernetes observability
Kubernetes infrastructure has many benefits, but it can also pose some complications. Florian Ortner, chief product officer at Dynatrace, explained how Dynatrace experienced this firsthand.
“We had many platform engineering practices built on top of Kubernetes,” Ortner said. “We suddenly had dozens, and then, later, hundreds of Kubernetes clusters running across the three big hyperscalers, and due to speed and cost reasons within our own engineering lab.”
Ortner reviewed the process of solving these issues.
“We discovered that it is crucial to not only manage the Kubernetes on our platform from a Kubernetes standpoint, but we must provide an out-of-the-box experience to our engineers,” Ortner said. “This is so they see all the things they are used to from open source tools from other solutions, and from kubectl right within Dynatrace. So, they see clusters, pods, and workloads for up to hundreds of Kubernetes clusters across AWS, Azure, and GCP—right within the new Kubernetes app.”
Kubernetes doesn’t have to be intimidating, especially with the right insight. The new Dynatrace Kubernetes experience enables platform engineers and SREs to better understand and optimize the health and performance of their Kubernetes environments.
Building a better development experience with observability
To close out the session, Winkler returned to the stage to drive home that observability and security will differentiate successful platform engineering initiatives from the others.
With full visibility into all the moving parts from development to production, organizations can reduce the cognitive load and increase developer experience for development teams.


Looking for answers?
Start a new discussion or ask for help in our Q&A forum.
Go to forum