
Over the years, I have watched and written about online retail and e-commerce IT performance. What I have seen is a maturing of the online retail channels when it comes to delivering customer experiences. What was once an onslaught of consumer traffic between Black Friday and Cyber Monday has turned into a weeklong event, with most retailers offering deals well ahead of Black Friday.
This year we saw few, if any, major issues with online retailers. Social media was relatively quiet, and as always, the Dynatrace Insights team was benchmarking key retailer home pages from mobile and desktop perspectives.
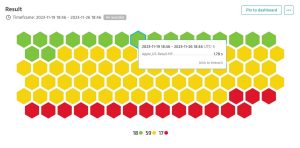
Below is a Dynatrace honeycomb chart depicting the performance of the synthetics tests tracked by the Dynatrace Business Insights team. These tests open the retail home pages from various locations across America on a consistent basis. We applied some thresholds to show which of the retailers were able to load their pages in under 3 seconds (green), between 4 and 10 seconds (yellow), and over 10 seconds (red).
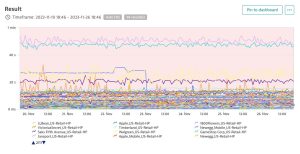
 If we look over the course of “Cyberweek” (below), no retailers experienced massive spikes indicating digital performance issues. We see a couple of sites move to the downside, indicating a site change that improved performance (we will return to this in a moment).
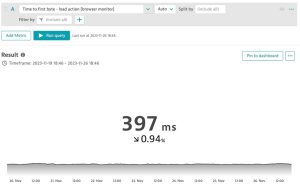
In the past, I tried to understand where in the page-loading process was the majority of time spent. When we look at the combined tests above, the average server-side response time (measured as first byte time, or the amount of time it takes to get the first packet of data in response to a request) is 397 milliseconds.
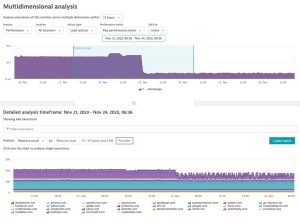
This is where many retailers have matured over the years. By focusing on the server, digital performance has become much more consistent, even under the weight of massive amounts of consumer load. Some retailers have begun to look at third parties and components not directly under their control. Below, we can see where one of these retailers made changes to its site in advance of Black Friday. By using the Dynatrace multidimensional analysis, we can see that the retailer reduced the number of calls made to third parties. This had the effect of dramatically speeding up its performance and reducing support costs.
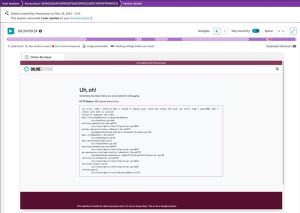
This is a good next step, as improved performance creates a better customer and end-user experience. But having a page load more quickly is only part of ensuring a good user experience. Understanding what the end user is seeing is critical. For example, this year I was doing comparisons of headphones to purchase. The site I was using to do a side-by-side comparison had an issue with loading in my mobile browser. This video (below) illustrates my experience.

As you can see, I was unable to use this page at all. Something caused the page to either not render, or a style sheet was displaying over the page leading to a suboptimal user experience. This type of issue would definitely affect conversion rates on a retail site.
Dynatrace has an answer for discovering these types of issues. Dynatrace RUM (Real User Monitoring) has a session replay capability that allows you to see what an end user would see during a session in real time. Below is an example of session replay.
The above screenshot shows an example of an error page that has additional detail as to why the page failed. As retailers use more third-party services for comparisons, product sizing, shopping carts, checkout, and payment, this means that more functionality will fall outside the control of those retailers. This introduces challenges in ensuring that everything is working the way it is supposed to, end to end, from product search to order fulfillment.
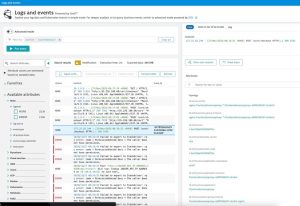
Where retailers can look to start tying together third-party services is through their logs and events. Below is an example of a Dynatrace log and event viewer. There is a wealth of data tied up in logs that can be used by retailers. However, logs alone won’t solve everything.
What retailers need is a way to capture the payloads of requests going back and forth to third parties. Dynatrace allows retailers to capture these payloads as “Business Events.” Business events are a special class of events that deliver real-time business data from anywhere and empower business and IT teams to analyze, discover, and automate tasks to improve business outcomes. Once captured, retailers can now create much more complex, complete end-to-end business processes. From click to fulfillment.
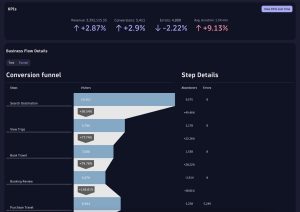
Below is an example of an order conversion funnel that can be used to tie in functionality from various third parties used by a retailer.
Dynatrace is heartened to see that this year’s Black Friday and Cyber Monday events were relatively problem free. As the retail market continues to mature, we expect that retailers will turn their attention to better managing applications distributed across multiple technology providers. Business Events are a key component enabling retailers to do that. To learn more, download our Business Events handbook.
Dynatrace has been helping retail organizations to get ahead of application performance issues so they can ensure the best experiences – from order submission to fulfillment – for customers and their staff. For more information, check out our retail solutions page.


Looking for answers?
Start a new discussion or ask for help in our Q&A forum.
Go to forum