
“Great! I have ingested important custom data into Dynatrace, critical to running my applications and making accurate business decisions… but can I trust the accuracy and reliability?”
Welcome to the world of data observability.
The Dynatrace open platform is well-positioned to take advantage of the exponential increase in data generation. However, coupled with the increase of external data sources that can now be ingested, there are new challenges in data management that need to be addressed.
“Every year, poor data quality costs organizations an average $12.9 million”
– Gartner
Data observability is a practice that helps organizations understand the full lifecycle of data, from ingestion to storage and usage, to ensure data health and reliability. Data observability involves monitoring and managing the internal state of data systems to gain insight into the data pipeline, understand how data evolves, and identify any issues that could compromise data integrity or reliability. At its core, data observability is about ensuring the availability, reliability, and quality of data.
Data observability is crucial to analytics and automation, as business decisions and actions depend on data quality. In the age of AI, data observability has become foundational and complementary to AI observability, data quality being essential for training and testing AI models.
Dynatrace now addresses many of the issues customers experience around the health, quality, freshness, and general usefulness of data that is externally sourced into Dynatrace Grail™, allowing them to make better-informed decisions and optimize their efforts for digital transformation and data-driven operations.
The rise of data observability in DevOps
Data forms the foundation of decision-making processes in companies across the globe. Data is the foundation upon which strategies are built, directions are chosen, and innovations are pursued. Consequently, the importance of continuously observing data quality, and ensuring its reliability, is paramount. Surveys from our recent Automation Pulse Report underscore this sentiment: 57% of C-level executives say the absence of data observability and data flow analysis makes it difficult to drive automation in a compliant way. This not only underscores the universal significance of data, it also hints at its pivotal role within DevOps. For DevOps teams that inform deployment strategies, optimize processes, and drive continuous improvement, the integrity and timeliness of data are of significant importance.
As organizations scale and accelerate their digital transformation journeys, a major hurdle to proper DevOps adoption is the trustworthiness of the massive volume of data coming from various sources, much of which goes into data silos such as log management tools, SIEM solutions, and others.
The rise of data observability needs is where Dynatrace capabilities around Grail, analytics, and Davis® AI are in an outstanding and unmatched position to deliver the currently missing value to the market: a leading and single solution for all data observability analytics needs. This reduces the demand for further data flow analysis tools and clears any hurdles to making data useable for DevOps automation use cases.
Davis AI, Grail, and data observability
By grouping common data observability issues into industry-standard pillars, we can provide tangible examples and showcase current capabilities. The five pillars we focus on are freshness, volume, distribution, schema, and lineage.
Freshness: Timeliness of data
In an ideal ecosystem, actionable data should be as recent as possible, supported by learnings from accurate, historical data. Observing the freshness of data helps to ensure that decisions are based on the most recent and relevant information.
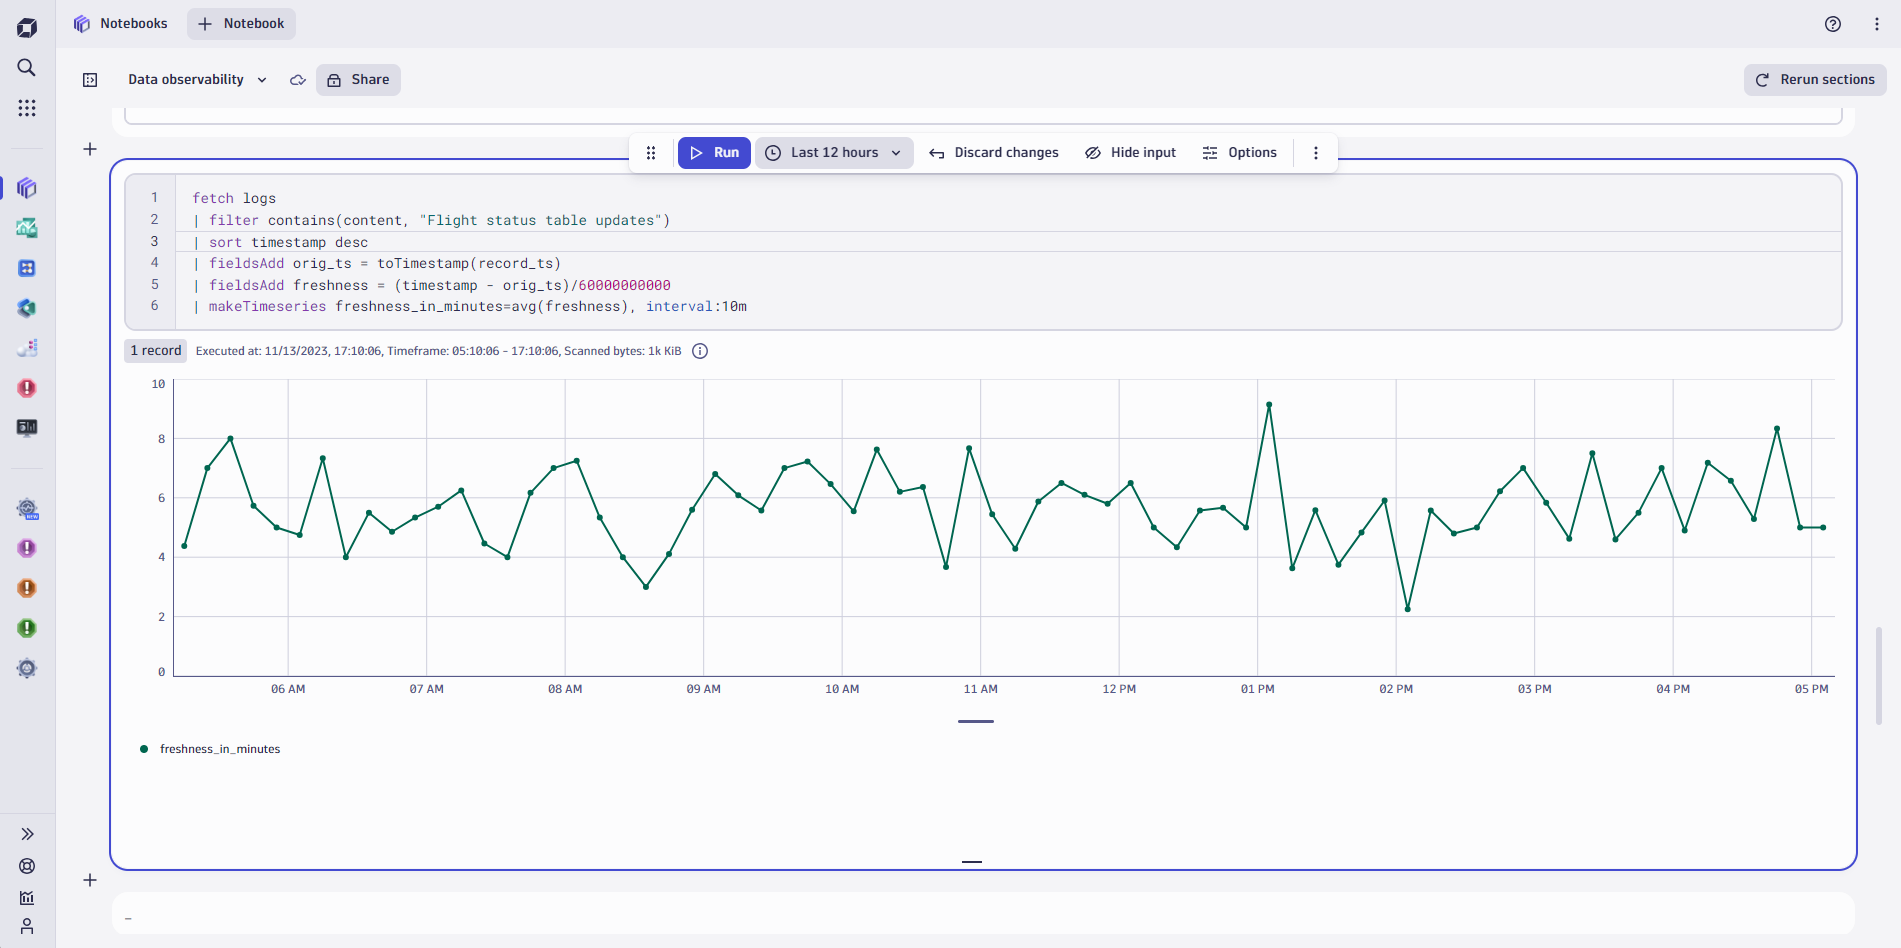
Scenario: Due to an undetected configuration issue, a flight status system from a popular airline had been buffering data for the last two hours before sending it on in one batch. Downstream dashboards and system automations were using outdated data, leading to incorrect statuses of flights in reports.
Solution: After setting up data ingestion into Grail, Dynatrace Query Language (DQL) is used to add a freshness field (Figure 1) which is calculated from the delta between when the signal was written and when it was ingested. This freshness measurement can then be used by out-of-the-box Dynatrace anomaly detection to actively alert on abnormal changes within the data ingest latency to ensure the expected freshness of all the data records. Furthermore, the new Alert on missing data feature in the Anomaly Detector panel can be used to trigger notifications when data is not coming in as expected after being baselined.
Value: The possibility of alerting on data freshness issues, based on a learned baseline through Davis AI, allows for faster time-to-detect where there are seemingly no infrastructure issues. Normally this would have left an issue undetected for much longer, providing a false sense of security, eventually leading to a much bigger customer and monetary impact for the organization.
Volume: Quantity of data generated or processed within a given timeframe
Unexpected increases or drops in the volume of data are often a good indication of an undetected issue.
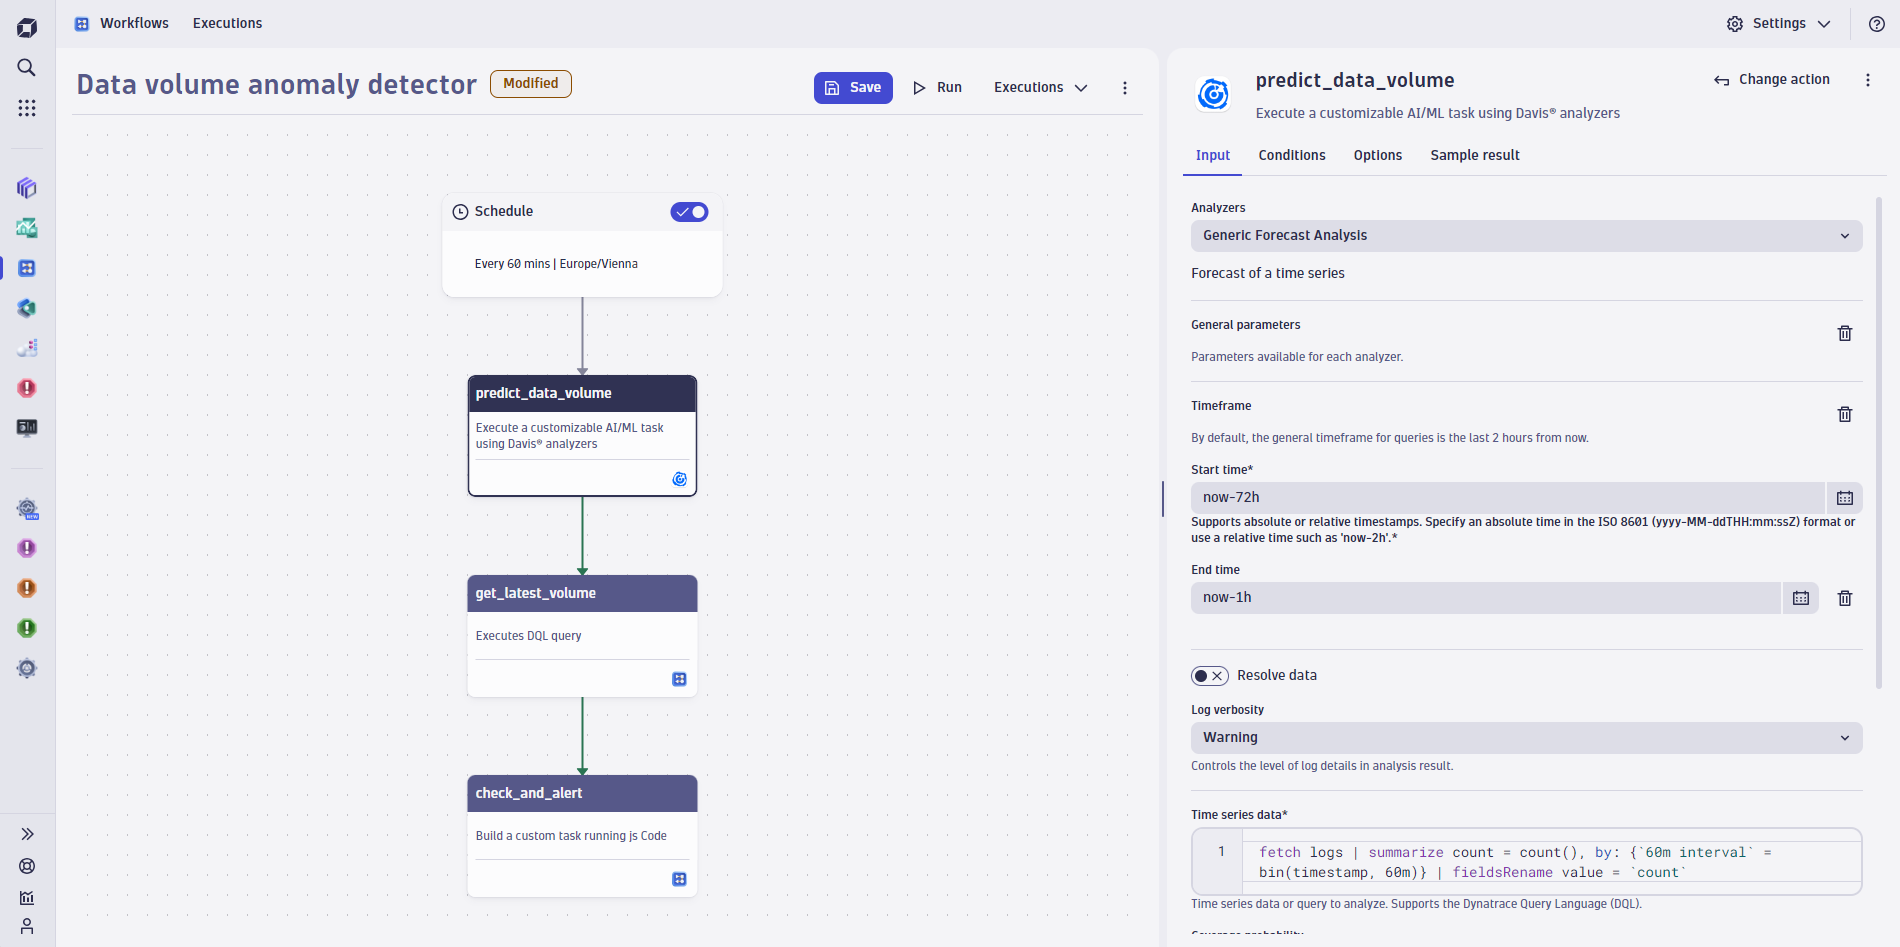
Scenario: For many B2B SaaS companies, the number of reported customers is an important metric. It heavily influences downstream reports, and dashboards, shaping decisions from daily operations to strategic monthly reviews. In this scenario, a manually triggered run of a production pipeline had the unintended consequence of duplicating the reported customer metric. If left unchecked, this misrepresentation of a single KPI could lead to misguided decision-making processes through multiple layers of the organization.
Solution: Like the freshness example, Dynatrace can monitor the record count over time. Once a DQL query has been set up, it can be used in an automation workflow (Figure 2) where scheduling, prediction, comparison to actual value, and, finally, alerting are all taken care of to enable a fully flexible way to detect anomalies in data volume.
Value: KPIs and metrics such as the number of reported customers are central to an organization’s business and strategic processes. Any issues here will result in a loss of trust in the data, and, if left undetected, they will eventually lead to monetary impact, including loss of reputation for an organization.
Distribution: The statistical spread or ranges of data
The distribution of data is essential in identifying patterns, outliers, or anomalies in the data. Deviation from the expected distribution can signal an issue in data collection or processing.
Scenario: A financial institution processes millions of transactions daily, ranging from credit card purchases and mortgage payments to interbank transfers and ATM withdrawals. An erroneous change in the database system leads to a subset of the data being categorized incorrectly. After several days, the fraud detection system starts triggering on a frequent basis, and liquidity management dashboards begin showing questionable values.
Solution: Baselining and raising alerts on anomalies are core capabilities of Davis AI. After setting up ingestion for the data that you want to monitor, it’s simple to use Dynatrace full AI capabilities to observe and alert on any anomalies in the data. In the example above, ingesting the number of transactions as business events, anomaly detection could be based on this to proactively alert and trigger mitigation activities.
Value: While variations are expected in financial trends, anomalies should be auto-detected, and manual detection should not be relied on. Earlier detection of these issues will keep the fallout as low as possible.
Schema: Structure and relationships of data between entities
Observing the schema can help identify and flag unanticipated changes, such as the addition of new fields or deletion of existing fields.
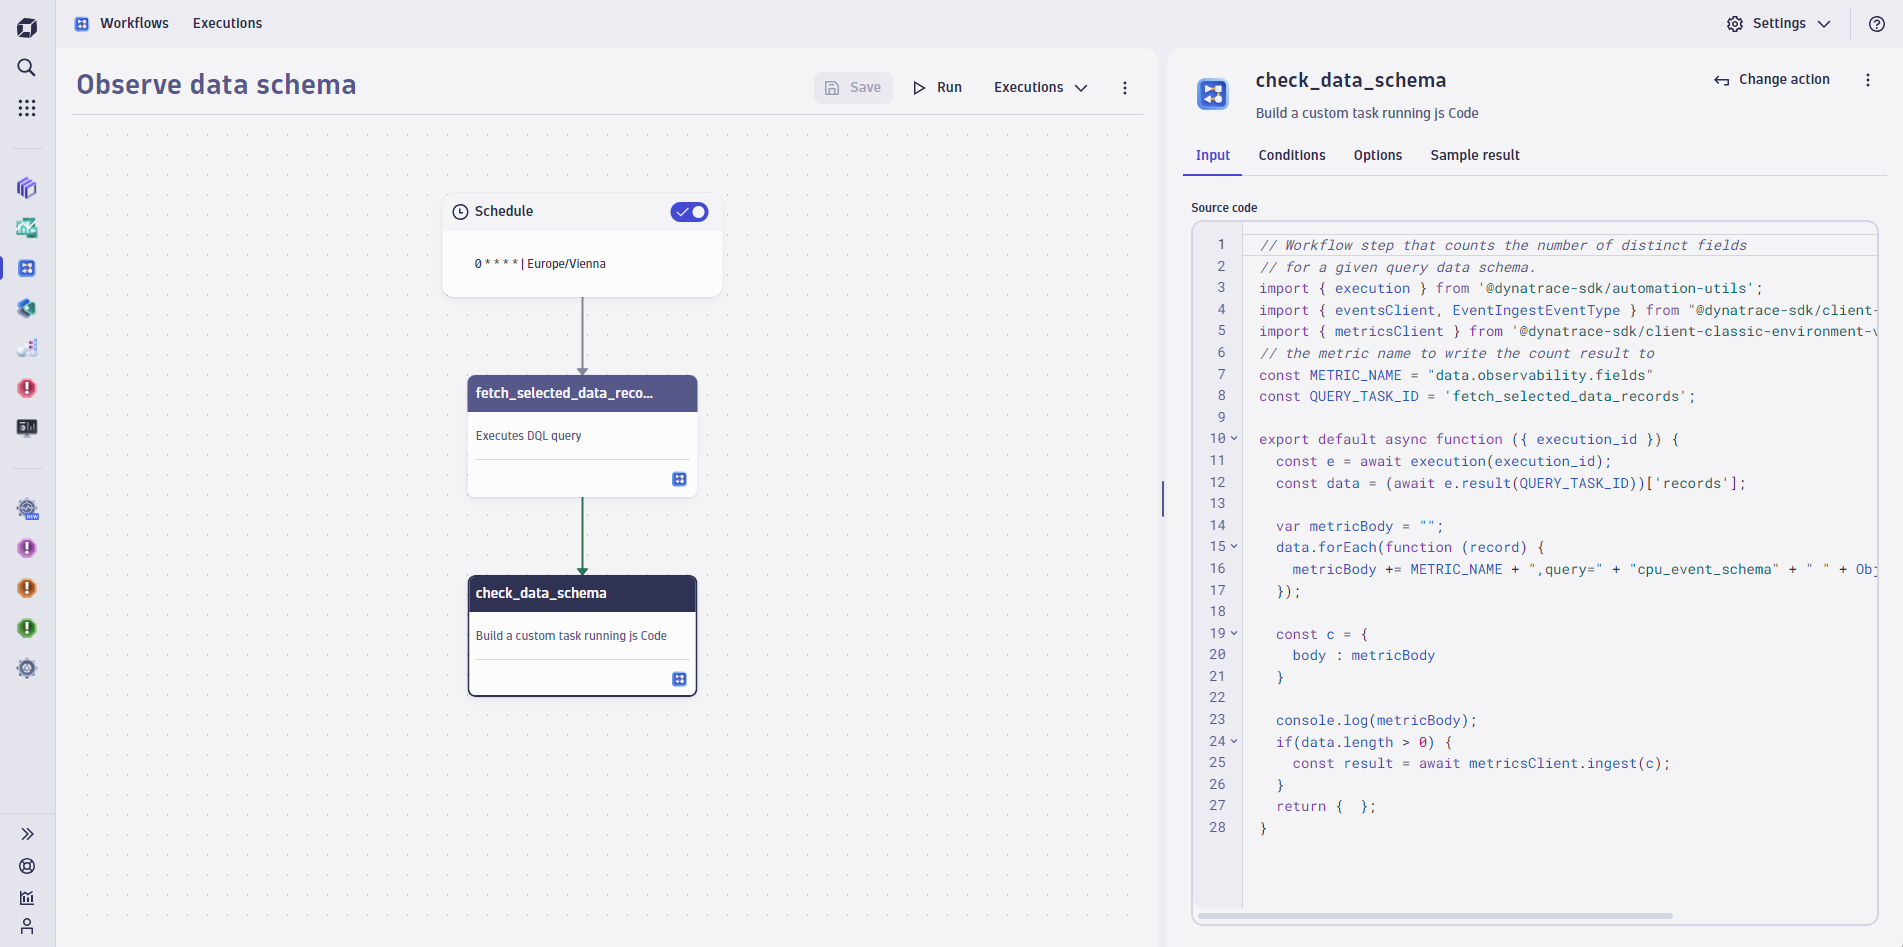
Scenario: An externally connected database system made an update that inadvertently dropped the account_id column in the customers table. The automated data pipeline propagated these changes, leading to downstream reports, dashboards, and applications breaking as the previous field reference is now missing.
Solution: Using the DQL FieldsSummary command, we can keep track of the number of distinct field keys within a given family of data records. Once confirmed in a notebook, the number of field keys can be used in an automated workflow to continuously monitor the count and write it back to a new metric (Figure 3). Once the new metric is established, out-of-the-box Dynatrace anomaly detection can be used to alert on either a static threshold or a learned baseline.
Value: Observing incoming data Schemas, and thus placing expectations on what the external data should look like and must contain, allows for pro-active alerting and mitigation of issues long before they can lead to widespread business impact such as broken reports, dashboards, or further analytics on top of the data.
Lineage: Journey of data through a system
Data lineage provides insights into where the data came from (upstream) and what is impacted (downstream). It plays a crucial role in root cause analysis as well as informing impacted systems about an issue as quickly as possible.
Scenario: The hourly_consumption table was deprecated and removed by an overzealous database administrator as there were no known downstream consumers of this data, breaking a monthly integration check used for consumption reporting for shareholders.
Solution: In the future, Dynatrace Smartscape® could be used, which already builds a dependency graph, to enable a data lineage view. This would enable faster root cause analysis of any data-related problems, as well as allow for easy notification of downstream consumers who would be impacted.
Value: A proper understanding of the source of the data, as well as where it is used, helps drive down time-to-alert and time-to-repair. Time-to-alert is achieved by quickly and automatically alerting those who are impacted by a data issue by quickly understanding downstream consumers of the data, while time-to-repair informs on the source of where the data originated from, to quickly drill down into those systems.
Data availability: A prerequisite
You could implement the most contemporary, accurate, and useful data observability solution possible, but what good will it be if all the data simply does not arrive as expected? Broken pipelines or missing data sources would mean that there is simply no data to observe and that data may never arrive, forever lost.
A truly valuable data observability solution should be able to alert on data issues as early in the process as possible. This requires monitoring of the upstream infrastructure, applications, or platform supporting those data streams. This is where the power of Dynatrace end-to-end observability comes into play. Dynatrace can leverage existing Infrastructure Monitoring and Application Observability solutions to surface problems that can affect later data observability workstreams—long before a traditional data observability solution would pick up the issue.
Leverage the power of Dynatrace and Davis AI—now and into the Future
Anomaly Detection
Anomaly detection is grounded in the idea of baselining typical patterns of ingested data, designed to alert where a change or deviation from the norm is observed. These patterns typically go beyond simple flat or trend lines, often exhibiting complex seasonal behaviors, such as business hours or weekly patterns related to the industry. Dynatrace is particularly strong in this area: Davis predictive AI has been enriched over the years with a set of advanced machine learning (ML) algorithms optimized for time-series observability datasets to cope with these challenges. Davis AI anomaly detection, leveraging these ML algorithms, can already be used on the results of DQL queries. (Embedding ML algorithms into DQL as functions is on the Dynatrace platform roadmap.)
Considering the examples and solutions provided above, anomaly detection plays a pivotal role in numerous data observability use cases and can be harnessed to effectively address these challenges.
Triage and resolution of a data incident
Triaging requires an ability to identify the root cause of a data incident, which is particularly challenging as an organization scales up the volume and speed of data ingest typical of an enterprise environment. It’s easy to see how Davis causal AI problem detection could be extended in the future to identify root-cause data observability issues.
Depending on the incident, there might be different paths to resolution. One acceptable path could be full auto-remediation, whereby Dynatrace AutomationEngine could be triggered, scripts executed, permissions granted, security checked, and data corrected. A second path might require Jira tickets to be created and human intervention through an approval process. A data problem alert could be used as the event allowing for multiple methods to notify the correct data owners, stewards, governors, or data teams.
An incident requires not only resolution but also understanding and alerting upstream data providers and downstream data subscribers to the potential impact. Dynatrace is strong on the observability of data pipelines ingesting data into Grail and consumers of Grail data, although this is an area that will be enhanced and improved in the future product roadmap.
Prevention of future incidents
Not all data quality incidents can be prevented, especially because ELT/ETL data pipelines typically tend to grow over time and span many different heterogeneous collectors that have different ownerships. There are, however, mitigation techniques you can use, for example:
- Health tracking of key datasets or streams over time—alerting on anomalies
- Monitoring standard query results and changes over time
- Well-designed, data-focused dashboards for monitoring
- Auto remediation where appropriate with built-in audit logging
- Forensic abilities for ad-hoc data analysis
Summary
Dynatrace is uniquely positioned to provide even more value by extending our world-class observability platform into the data observability realm. To achieve this, we leverage Infrastructure Monitoring and Application Observability for early warnings on data pipeline issues and use DQL, Workflows, and Grail for data observability—all enabled by our best-in-class Davis AI engine.
Ensuring the quality and reliability of underlying data is more crucial than ever now that many organizations are deploying Generative AI models. Data observability is becoming a mandatory part of business analytics, automation, and AI. Davis AI and data observability together uniquely ensure the quality and reliability of data at the level of hypermodal AI—predictive, causal, and generative.
You can now monitor sources and incoming data pipelines for freshness, volume, distribution, lineage, and availability issues early on without added noise and in a central location, the Dynatrace platform. This gives your teams additional confidence over data quality, saves time, prevents inaccurate analyses and automation outcomes, leads to more trustworthy AI models, and supports efforts to consolidate or reduce the number of IT tools they rely on.
Ready to get started with Dynatrace data observability? For complete details, best practices, and detailed use cases, see Dynatrace data observability documentation.


Looking for answers?
Start a new discussion or ask for help in our Q&A forum.
Go to forum