Introducing Databases, the new observability app for databases from Dynatrace. This app was built to cater to all requirements of database administrators (DBAs), from swiftly assessing database availability and performance to delving deep into architectural intricacies for efficient troubleshooting. It also provides a single source of truth for all involved stakeholders and elevates problem resolution by uniting DBAs, application owners, and ITOps through a single, intuitive interface.
Maintaining optimal application performance is crucial for businesses, and fast databases are vital in achieving this goal. For an effective approach to database performance, it’s crucial to have a comprehensive overview of all databases, including server-side DBs. With multiple database technologies in use, this poses a challenge to DBAs who must observe the different technologies using different management tools. Also, point solutions fall short of providing detailed information about necessary context such as connected applications, and lack information about the overall topology. This leads to scattered and inefficient workflows.
Therefore, organizations increasingly seek a centralized database monitoring solution to identify irregularities and patterns across systems and different technologies.
Monitor all databases in context from a single location
Dynatrace provides a unified observability solution, including cohesive and detailed monitoring of all databases and applications. It streamlines collaboration and significantly reduces the need for extensive data processing, traditionally required in “war rooms.” This also reduces the reliance on proprietary database management tools, each with its own set of protocols and interfaces.
The new Dynatrace Databases app provides a unified view over all elements necessary for unified observability, including services, hosts, instances, and other core elements such as tablespaces or Oracle multitenant entities (container databases, pluggable databases, and others) that can influence database performance.
The Databases app is the only tool you need to monitor and understand the availability and performance impact of all your observed databases.
Databases app makes database monitoring an effortless task
Ease your morning coffee routine with an overview and quick summary of the currently monitored databases and the most time-consuming queries. Based on these charts, you can quickly identify the instances that need further inspection.
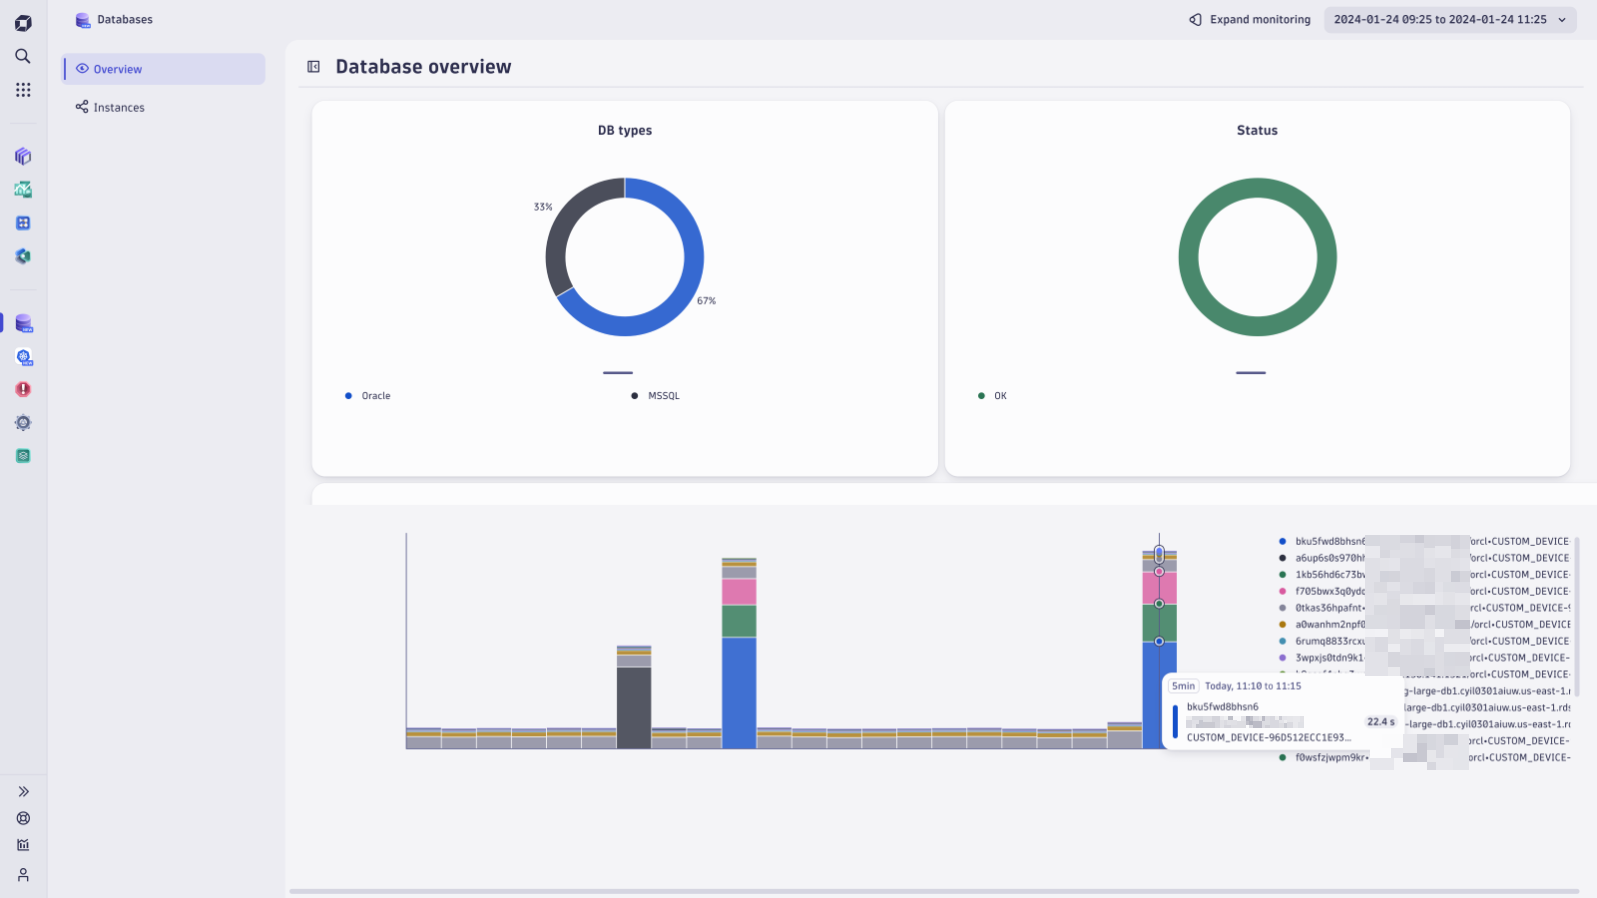
Comprehensive tracking
The app provides a user-friendly dashboard for monitoring the performance of databases. You can effortlessly gain insights into the workings of your database ecosystem, acquiring immediate insights.
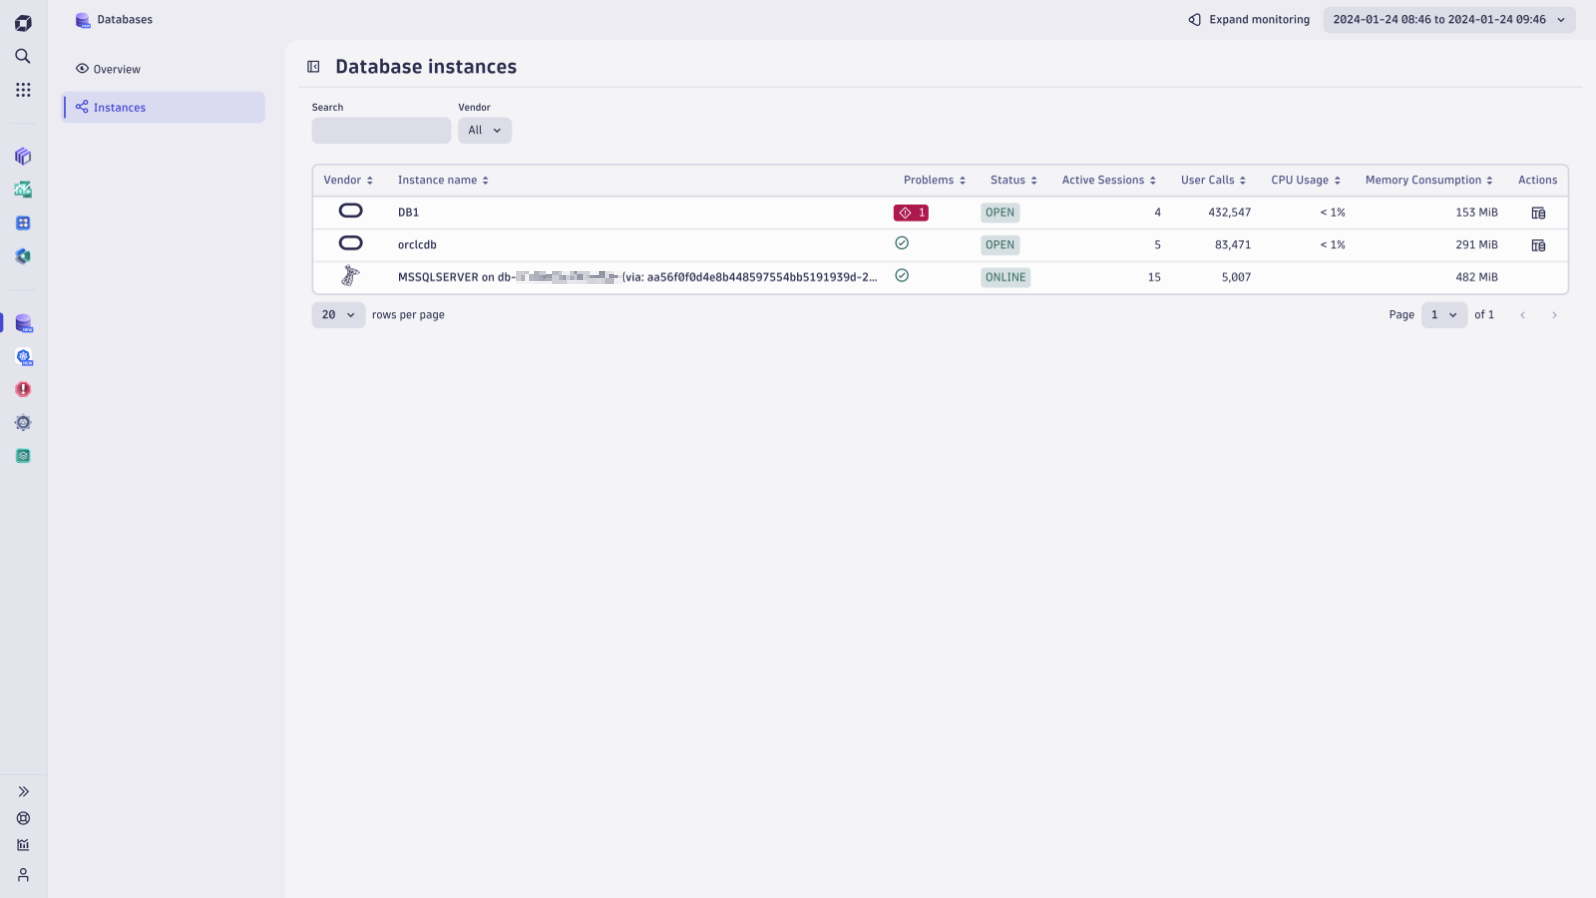
A frequent concern when overseeing relational databases is monitoring the free space of tablespaces, which are the allocated disk areas for storing data and database objects. When this space approaches its limit, DBAs must act to avoid disruptions. Options include expanding the tablespace, setting up automatic space management, or augmenting overall storage capacity to ensure uninterrupted database operations.
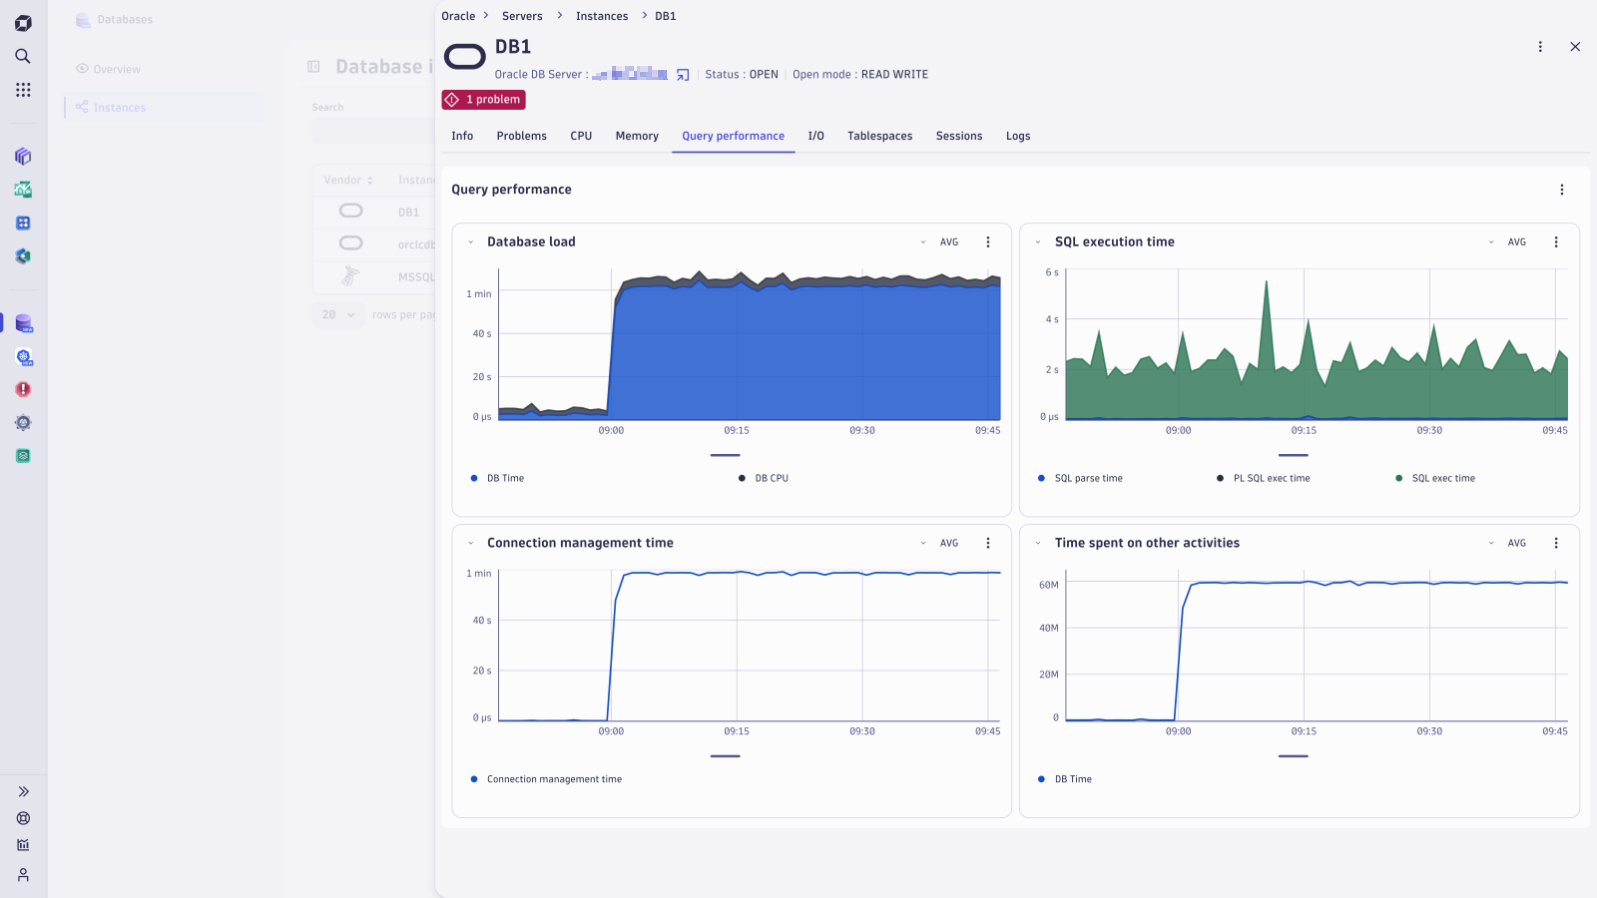
Identify security incidents
Database monitoring extensions additionally provide valuable metrics that enable prompt responses to possible security incidents. An adept DBA can identify signs of a potential distributed denial of service (DDoS) attack by monitoring irregularities in metrics such as I/O wait times or CPU usage. A sudden surge in these metrics can suggest a brute-force attack on the database. To address this threat effectively, further investigation through log analysis or specialized database tools may be necessary for risk mitigation.
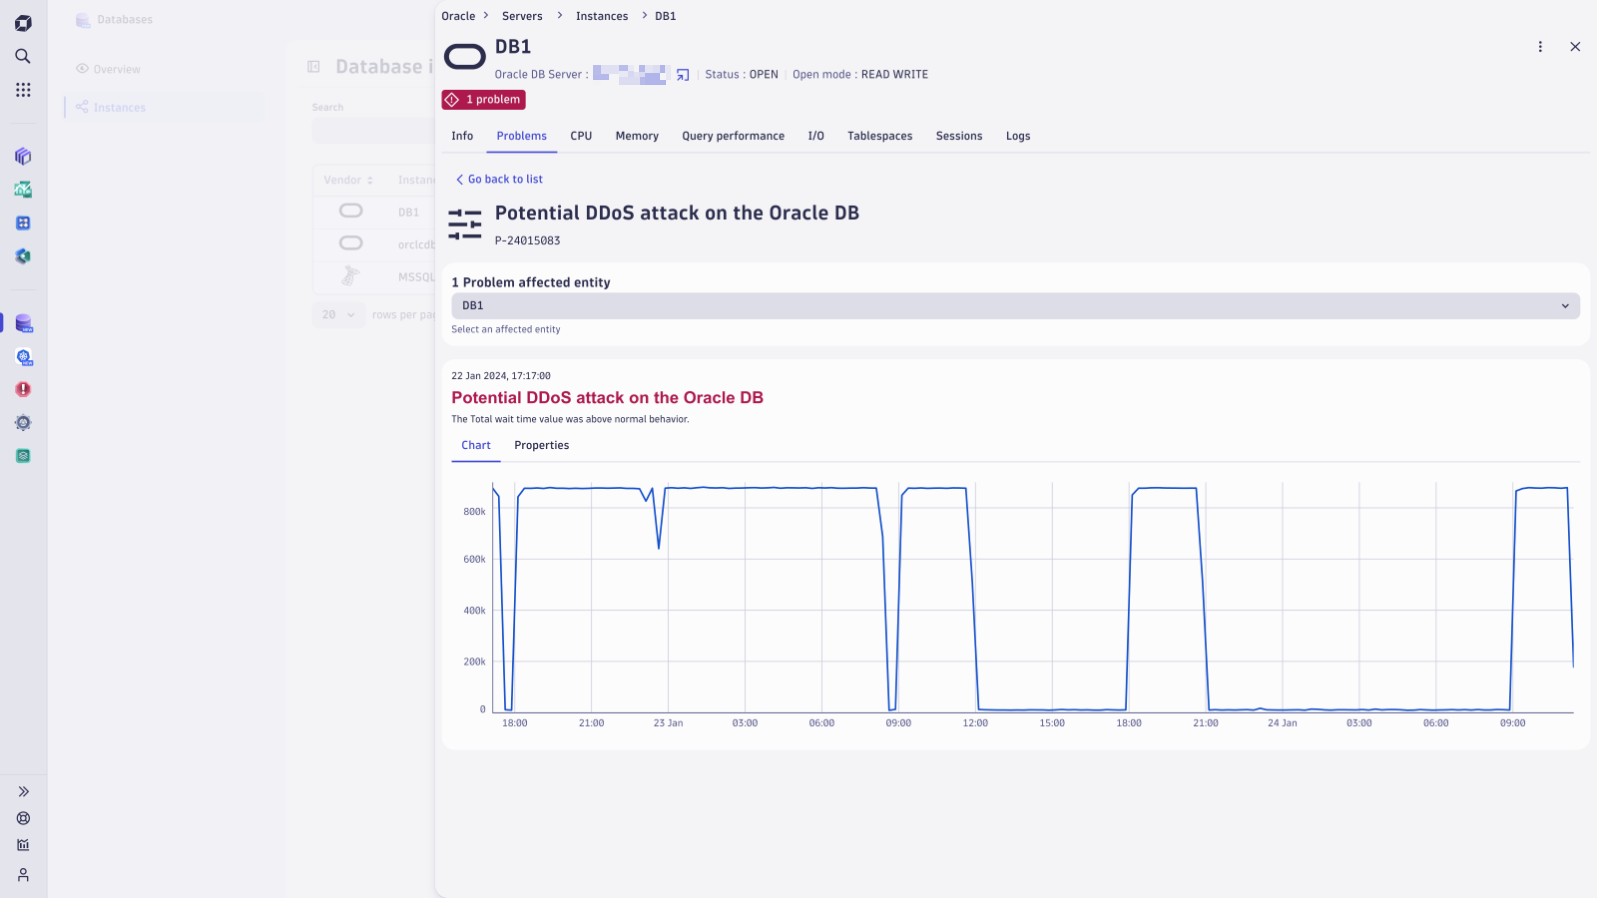
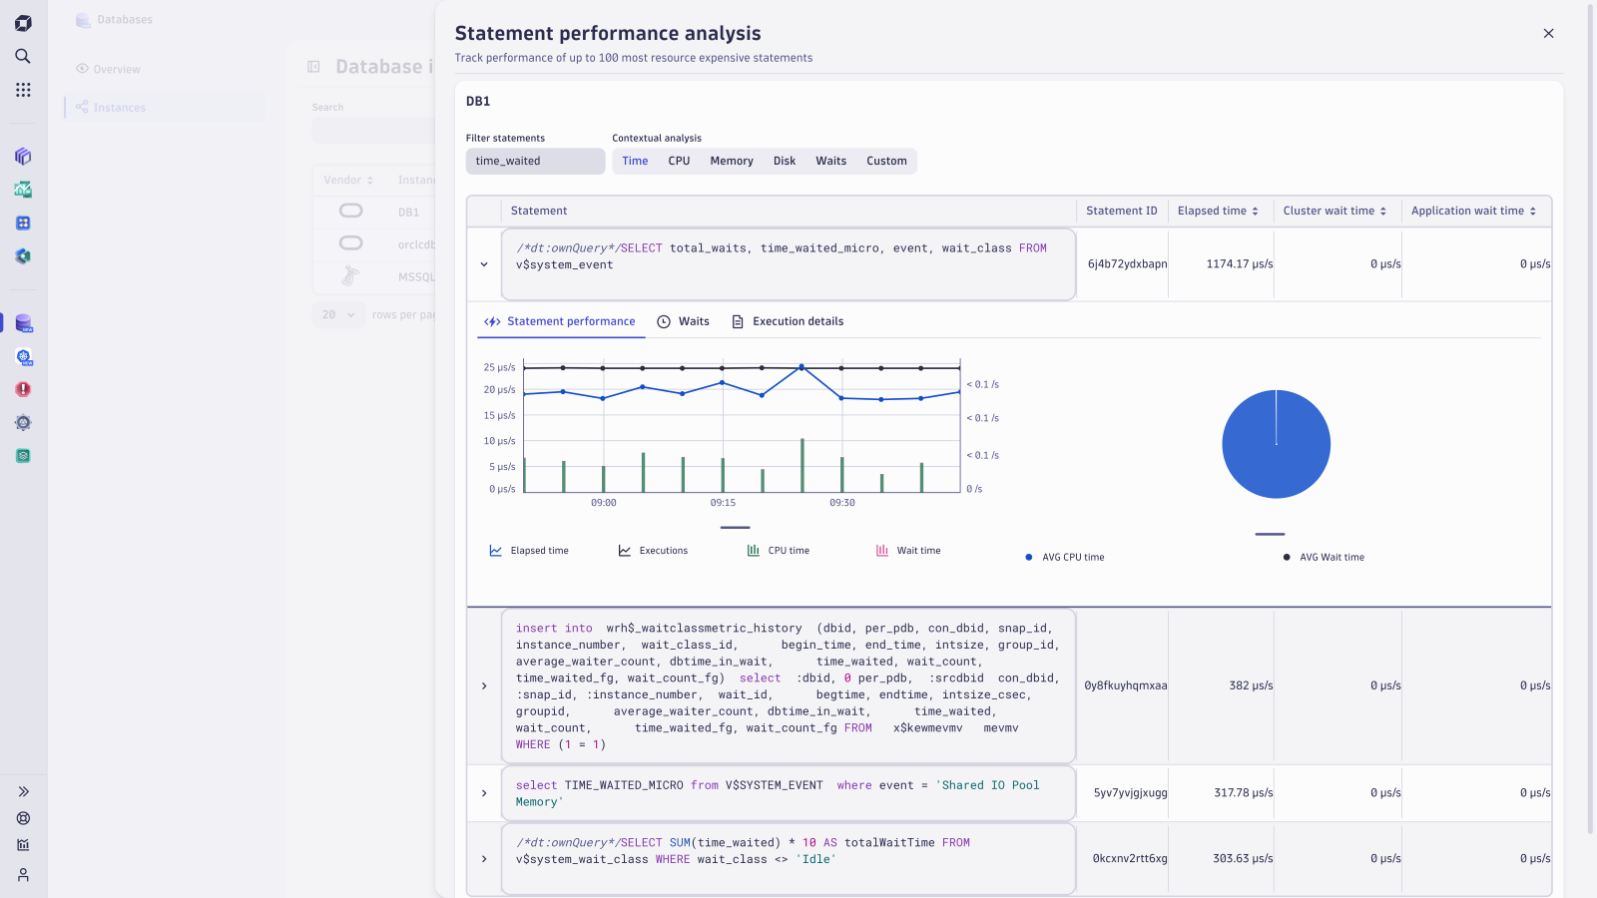
Statement performance monitoring
Discover which database statements consume the most resources and monitor their performance trends. This data equips you to adjust and optimize systems for peak efficiency.
What’s next?
We’re constantly improving the Databases app to make it even more powerful. Follow the Databases app documentation for future updates. Some of the upcoming enhancements to the app include:
- Query execution-plan accessibility, where query performance analysis is supported by accessing the execution plan of a tracked query
- Introducing database log monitoring for comprehensive insights
- Streamlining monitoring candidates’ discovery for quicker and smoother configuration
- Achieving application and infrastructure-observability synergy by consolidating all DB-related use cases within a singular, powerful application
Get ready for a game-changing experience with database observability
Embrace the opportunity to explore the Dynatrace Databases application and let your voice be heard! We’re eager to hear your thoughts and insights. Join us on our community channel and be a part of shaping the future of DB monitoring.



Looking for answers?
Start a new discussion or ask for help in our Q&A forum.
Go to forum