
In part 1 of this blog series, we explored the concept of business observability, its significance, and how real-time visibility aids in making informed decisions. In part 2, we’ll show you how to retrieve business data from a database, analyze that data using dashboards and ad hoc queries, and then use a Davis analyzer to predict metric behavior and detect behavioral anomalies.
Dataflow overview
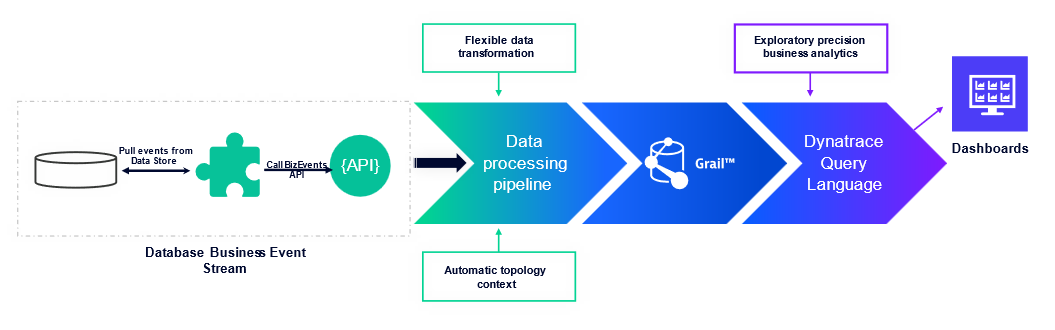
Dynatrace ActiveGate extensions allow you to extend Dynatrace monitoring to any remote technology that exposes an interface. Dynatrace users typically use extensions to pull technical monitoring data, such as device metrics, into Dynatrace.
However, as we highlighted previously, business data can be significantly more complex than simple metrics. To accommodate this complexity, we created a new Dynatrace extension.
Create an extension to query complex business data
Creating an ActiveGate extension with the Dynatrace extension framework is easy; there’s a tutorial on using the ActiveGate Extension SDK that guides you through making an extension to monitor a demo application bundled with the SDK.
Similar to the tutorial extension, we created an extension that performs queries against databases. Notably, the SQL query is not limited to specific columns or data with specific metric values (int or float). Instead, the data can be of any type, including string, Boolean, timestamp, or duration.
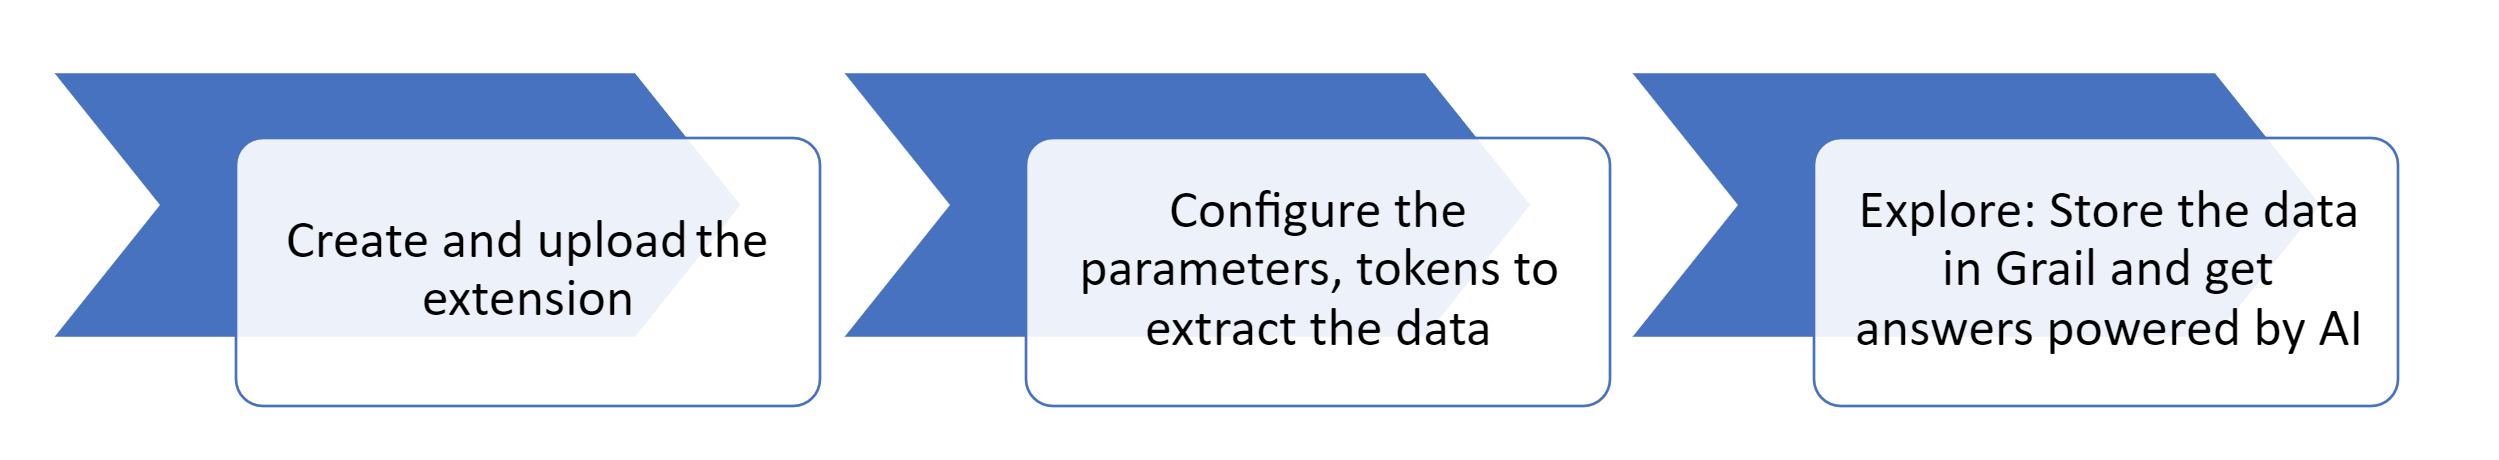
There are three high-level steps to set up the database business-event stream.
- Create and upload the extension that connects to the database and extracts business data in any form.
- Configure the extension with the appropriate database credentials, query names, Dynatrace endpoint, and tokens necessary to send the business data to Grail.
- Once the data is received in Grail, you can explore, manipulate, and analyze the data, utilizing advanced techniques such as filtering, grouping and aggregation, calculations and transformations, time windowing, and much more. Further, you can set alerts based on predefined or auto-adaptive thresholds.
Step-by-step: Set up a custom MySQL database extension
Now we’ll show you step-by-step how to create a custom MySQL database extension for querying and pushing business data to the Dynatrace business events endpoint.
Create and upload the extension
- Download the extension ZIP file. Don’t rename the file. This is a sample extension that connects to a MySQL database and pushes business events to Dynatrace.
- Unzip the ZIP file to the plugin deployment directory of your ActiveGate host (found at
/opt/dynatrace/remotepluginmodule/plugindeployment/). - In the Dynatrace menu, go to Settings > Monitored technologies > Custom extensions and select Upload Extension.
- Upload the ZIP file.
- Once uploaded, extract the ZIP file at the same location.
- Configure the information needed to query business observability data from the target database.
There are three configuration sections, as shown below in the Dynatrace web UI.
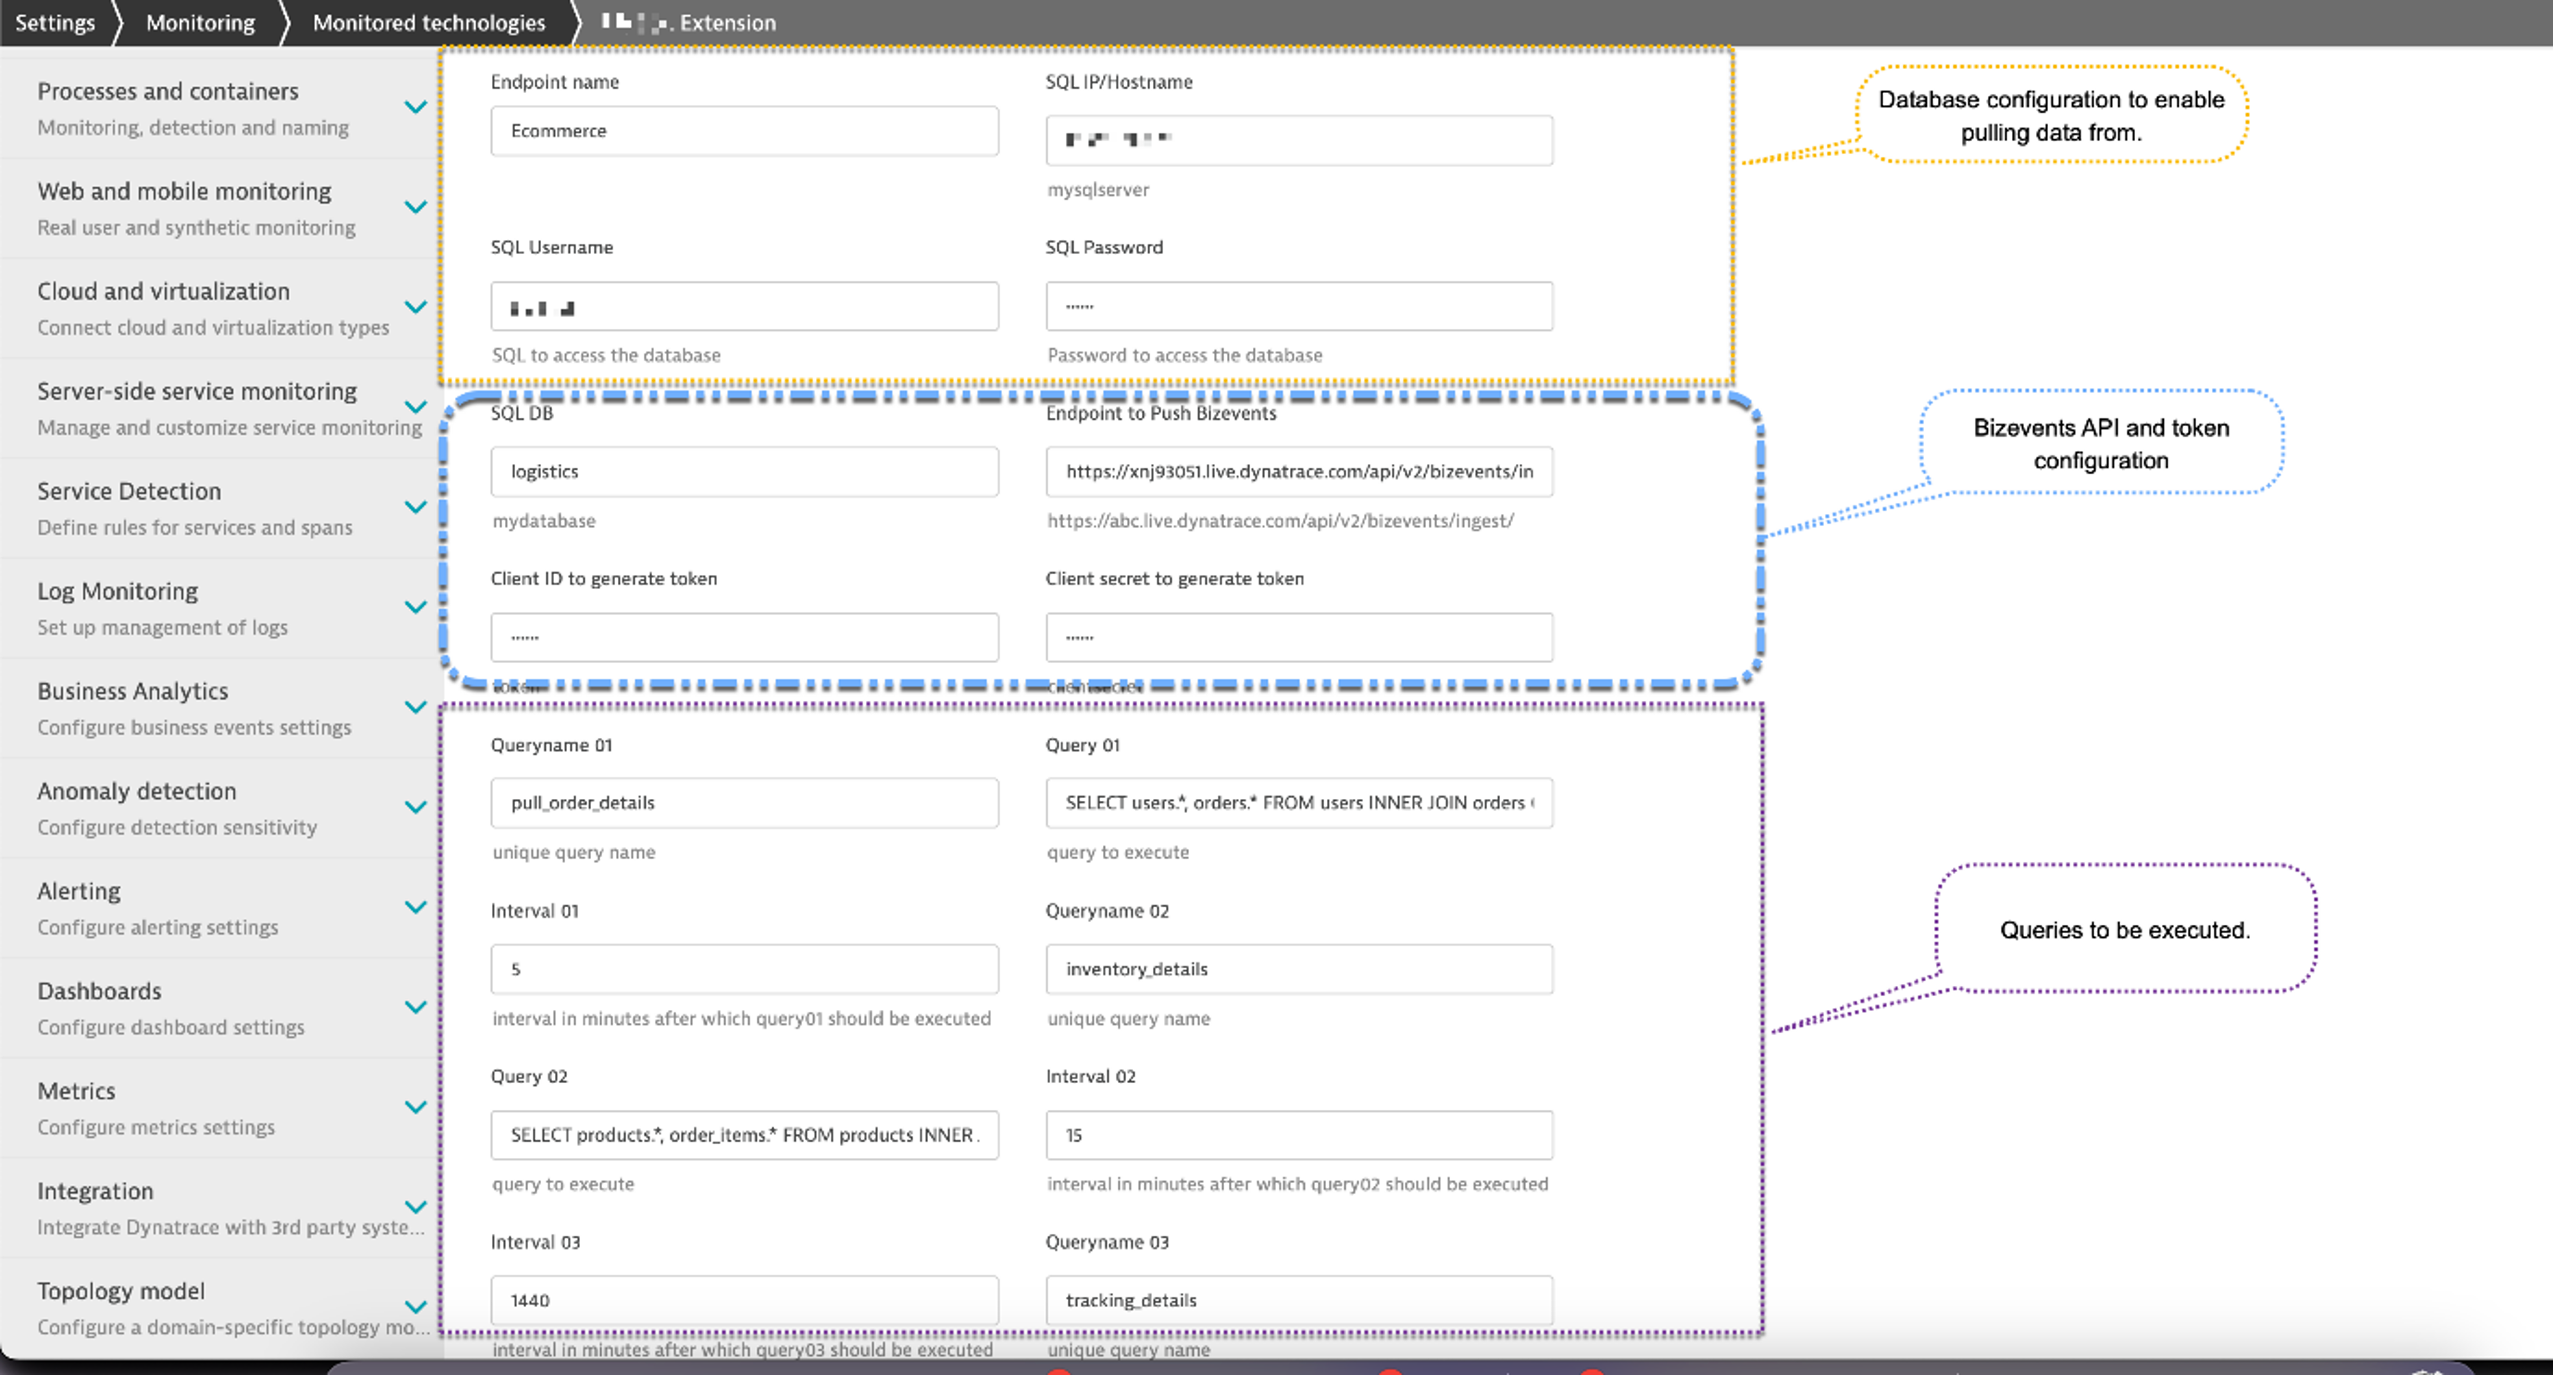
Configuration details
Database configuration
- Endpoint name: Any label to identify this connection. This is used for identification purposes.
- SQL IP/Hostname: The database IP or hostname.
- SQL Username: Username of the user who has permission to login on the SQL server remotely and access the database.
- SQL Password: Password for the username.
- SQL DB: The database name.
Bizevents API and token configuration
- Endpoint to Push Bizevents: Bizevents API that will receive the business data.
- Configure this similar to http://tenantid.live.dynatrace.com/api/v2/bizevents/ingest
- Replace
tenantidwith your tenant ID
- Client ID to generate token: Client ID used to generate OAuth token. To generate
client-id,refer to our OAuth documentation. - Client secret to generate token: Client secret for token generation.
Define your SQL Queries
- Queryname 01: Unique name to identify the query to ensure data identification and retention within Dynatrace.
- Query 01: SQL query to retrieve data.
- Interval 01: Frequency in minutes for executing the configured query.
- Add multiple queries (depending on the requirement) with the above config for each query.
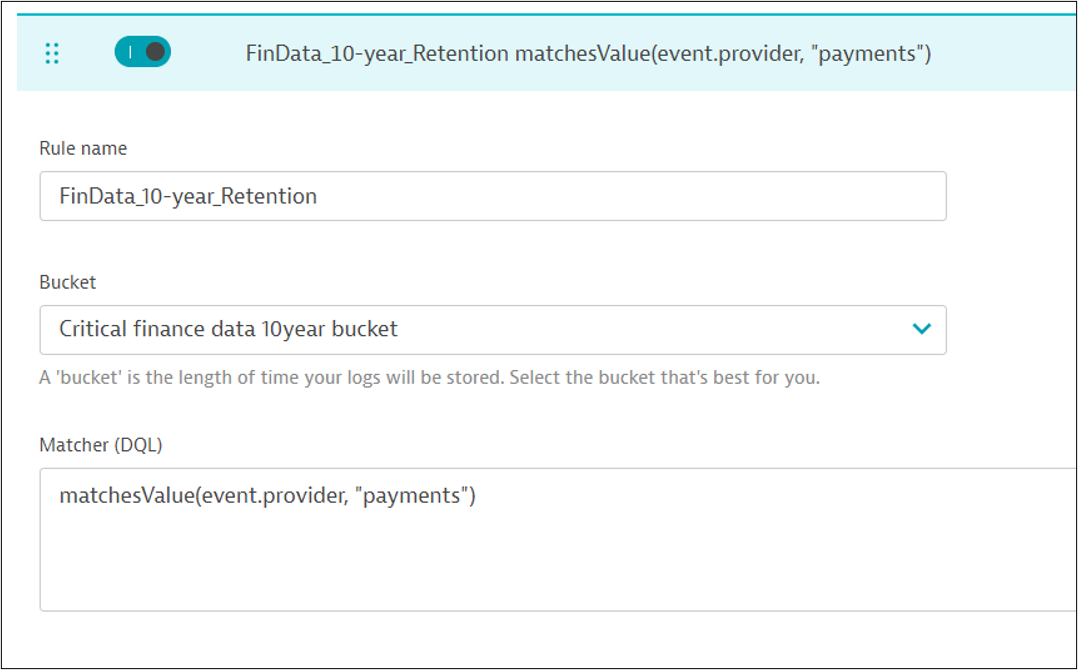
Define the retention period with matcher DQL and bucket assignment
Data stored in Grail can be preserved for extended periods, up to 10 years. To achieve this, we’ll create a Grail bucket specifically designed to retain data for a duration of 10 years (3,657 days).
Here is a JSON response from an API that successfully created a bucket capable of storing data for a period of up to 10 years.
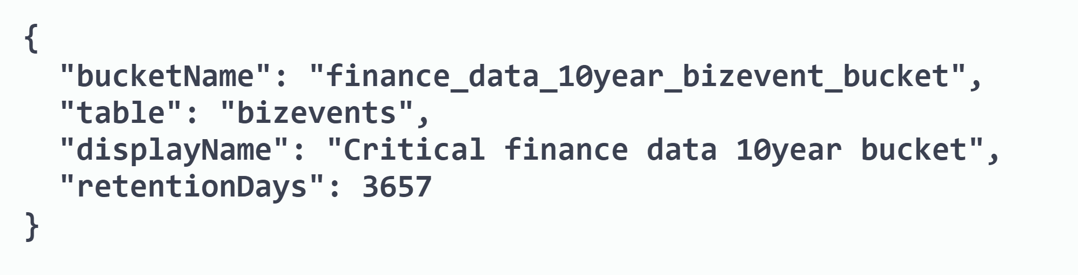
After obtaining a bucket with a suitable retention period, it’s time to create a DQL matching rule that effectively filters events and directs them to the appropriate Grail bucket. This ensures that the data is retained for the correct duration while restricting access to users who are authorized for that specific bucket.
Analyze the data in real-time using Dashboards or collaborate with colleagues using Notebooks
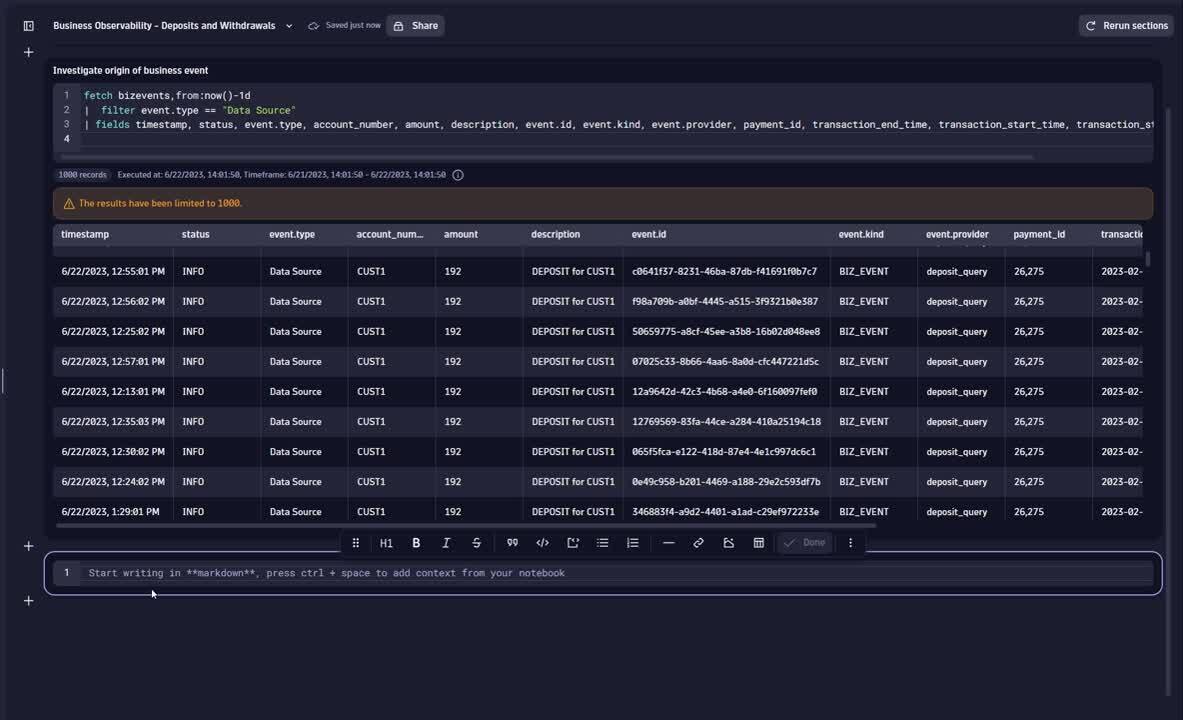
In the screen recording provided below, we begin by examining the business data ingested into Grail using a notebook. This initial overview provides a broad perspective of the ingested data. However, real insights emerge when we delve deeper and analyze specific events over time. As you follow along in the video, you’ll notice the ability to determine the day of the week for each transaction and visualize the data in a user-friendly bar chart.
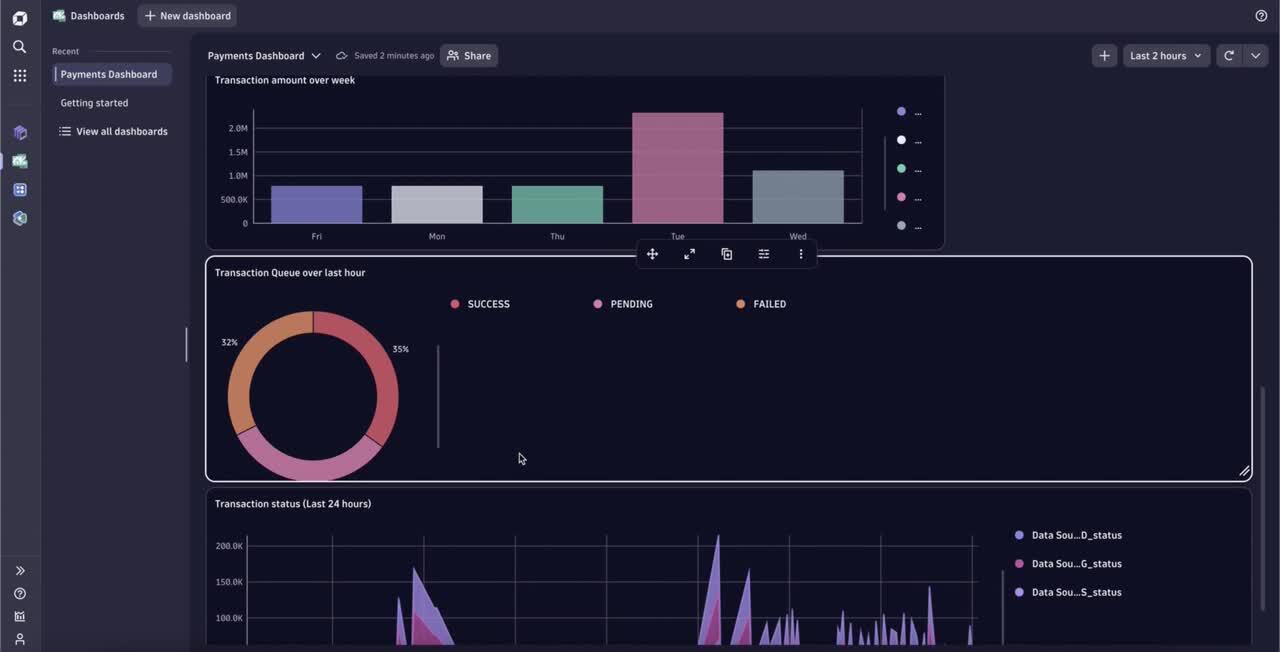
The video below showcases a business dashboard that effectively visualizes important events, including pending withdrawals and deposits from the past hour, transaction amounts throughout the week, transaction queue status from the previous hour, and the overall transaction status.
Enhance data insights with real-time ad hoc queries
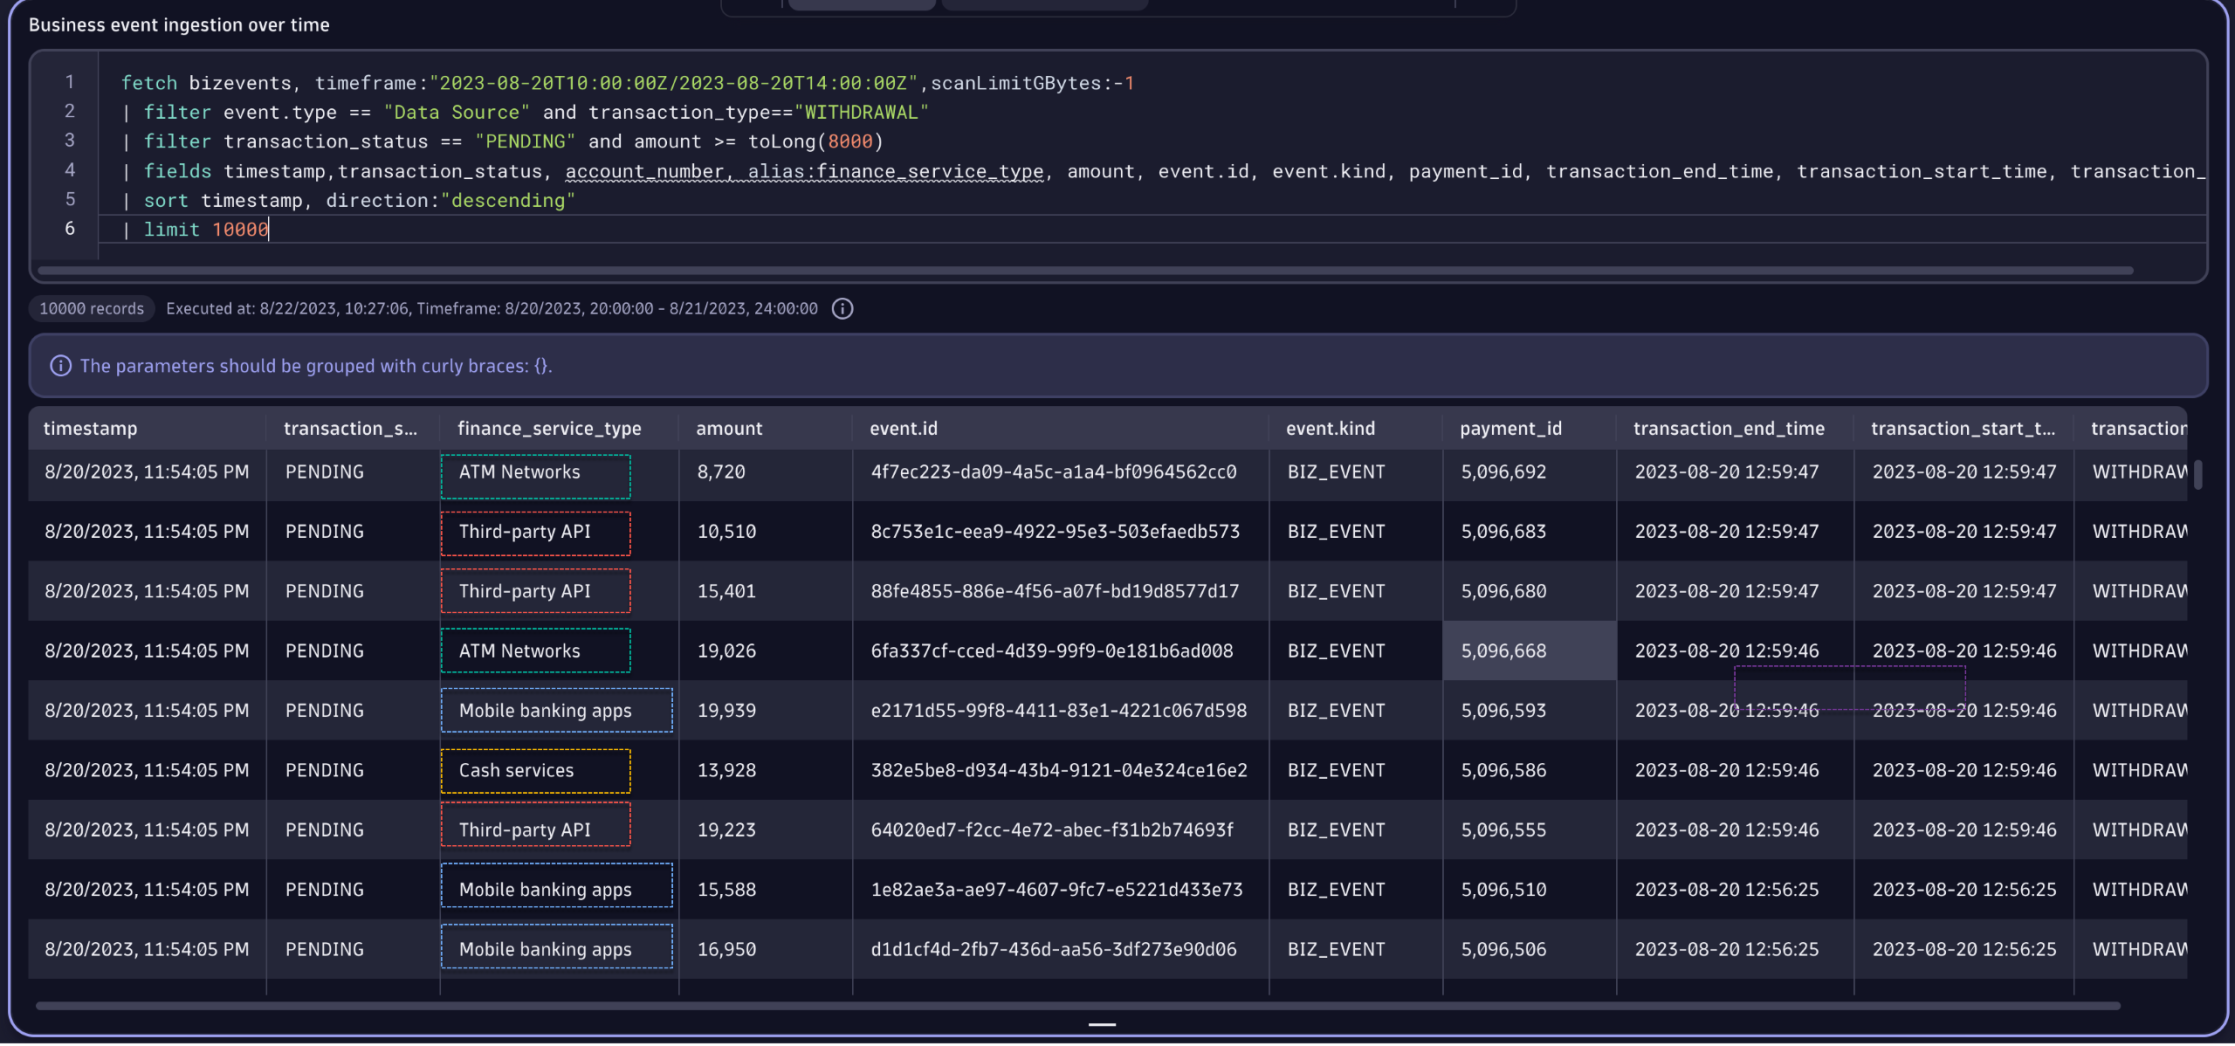
While predefined dashboards can offer comprehensive overviews, they don’t always anticipate and meet the needs of business analysts. Dynatrace Query Language (DQL) is a powerful tool for exploring your data and discovering patterns, identifying anomalies and outliers, creating statistical modeling, and more based on data stored in Dynatrace Grail. Now we’ll use a Dynatrace Notebook to execute our DQL queries.
In the below query, we’re specifically searching for pending deposit transactions greater than $8,000 that occurred between 10:00:04 AM and 12:00:00 AM on August 21, 2023. The query for pending deposit transactions within a specific time frame is useful for real-time analysis, issue investigation, performance assessment, impact assessment, and compliance/auditing purposes.
Proactive alerting for accumulating business transactions: Mitigating business impact
To ensure timely action and address potential bottlenecks, we can set up alerts that notify you when pending transactions accumulate within a short period. These alerts serve as early business warnings, allowing you to take necessary measures to prevent disruptions and minimize delays in transaction processing.
In the above recording, we demonstrate an alert specifically designed to notify when there is a significant increase in pending transactions. This alert serves as a valuable tool in maintaining operational efficiency, ensuring business continuity, and delivering optimal customer experiences.
Forecast business data Using a Davis analyzer
In the context of monitoring business-related data such as sales, orders, payments, withdrawals, deposits, and pending transactions, Dynatrace Davis analyzers offer valuable forecast analysis capabilities. Davis analyzers offer a broad range of general-purpose artificial intelligence and machine learning (AI/ML) functionality, such as learning and predicting time series, detecting anomalies, or identifying metric behavior changes within time series.
By utilizing a Davis analyzer, organizations can predict future trends and patterns in their payment and transaction data. This forecast analysis helps businesses anticipate customer behavior, plan for fluctuations in transaction volumes, and optimize their operations accordingly.
For example, by applying forecast analysis to payment data, businesses can identify potential cash flow issues or predict periods of high transaction activity. This type of insight enables you to proactively manage liquidity, ensure sufficient funds are available, and make informed decisions about resource allocation.
Conclusion
By combining proactive alerts and leveraging AI-powered insights, we can effectively manage pending transactions, optimize processes, and ensure smooth operations.
To address the business need for extracting business data from databases, we demonstrated using a custom database extension to bring the data into Dynatrace. This integration allows seamless connectivity to a variety of databases, enabling the real-time retrieval and storage of business data.
By leveraging the powerful combination of business, security, and observability, organizations gain immediate access to their critical business data without any delays or data staleness. The real-time nature of the data extraction ensures that decision-makers have up-to-date information at their fingertips, empowering them to make timely and informed decisions.
Furthermore, we showcased the flexibility and versatility of the Dynatrace platform in exploring and analyzing the extracted data. By seamlessly integrating the data into Notebooks and Dashboards, organizations can gain comprehensive insights into trends, patterns, and key performance indicators relevant to their business. This empowers data analysts and business users to delve deep into the data, uncover valuable insights, and derive actionable intelligence.
Additionally, we demonstrated the power of custom alerts in Dynatrace. By defining specific thresholds for key business KPIs, the platform can proactively monitor data and generate alerts whenever a breach or potential issue is detected. This proactive alerting capability ensures that stakeholders are promptly notified of any anomalies or deviations, enabling them to take immediate corrective actions and mitigate risks. More advanced use cases integrate with automation workflows to automate recovery actions.
Through seamless database connectivity, real-time data retrieval, exploratory capabilities, proactive alerting, and automation, organizations can enhance their overall operational efficiency, customer satisfaction, and business performance. The integration of the Dynatrace observability platform with the custom database extension provides organizations with a solution to extract, analyze, and act upon their at-rest business data, driving success in a rapidly evolving business landscape.


Looking for answers?
Start a new discussion or ask for help in our Q&A forum.
Go to forum