
Dynatrace has expanded its database monitoring features by introducing extensions for relational databases such as IBM DB2, SAP HanaDB, MySQL, PostgreSQL, and Snowflake. These extensions come with specialized domain expertise and handpicked metrics, significantly enhancing database observability. They offer query-level visibility, in-depth custom metrics, and log analysis that help you pinpoint issues in server load.
Running Databases efficiently is crucial for business success
Monitoring databases is essential in large IT environments to prevent potential issues from becoming major problems that result in data loss or downtime. Additionally, monitoring allows for proactive maintenance and optimization, leading to improved system performance and user experience.
Many environments rely on relational databases due to their structured format, which consists of tables, columns, and rows. This makes them ideal for managing structured data. However, horizontal scaling of these databases can take time and effort.
Database monitoring with topology context
With Dynatrace, you can easily monitor the performance of your database layer, even in complex environments.
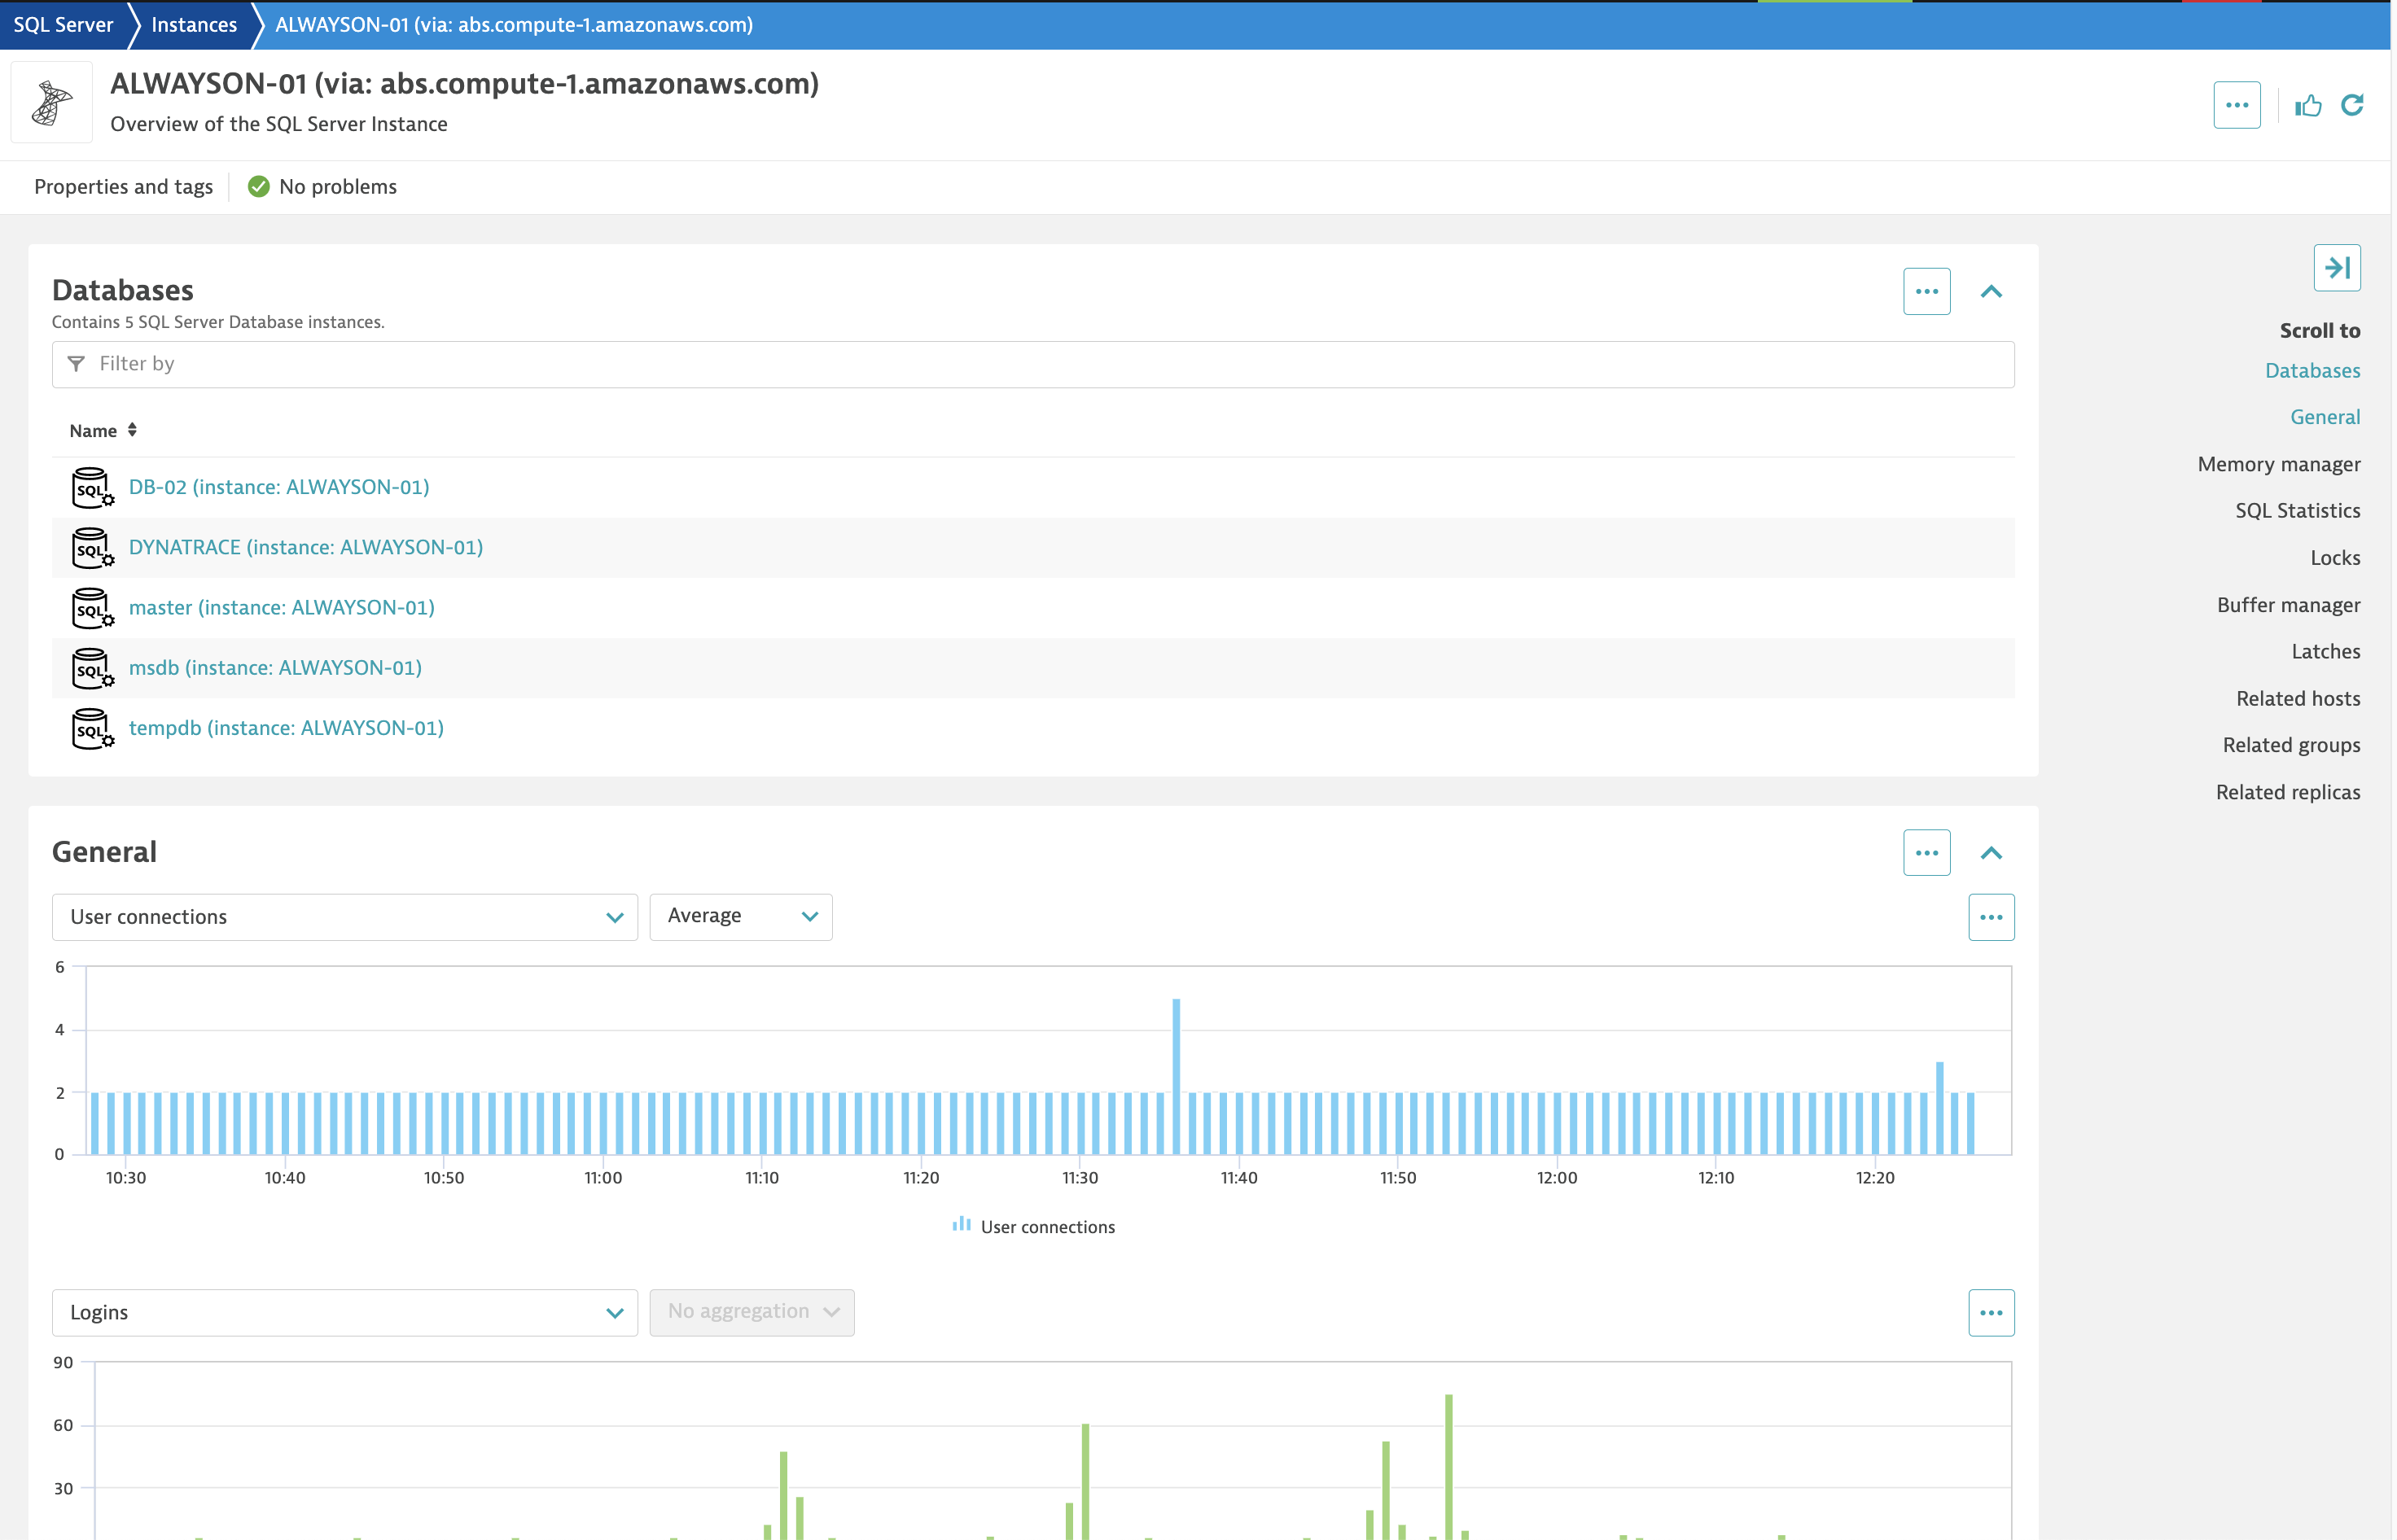
All databases running on your server instances are autodetected, so you can easily check your database performance statistics and settings.
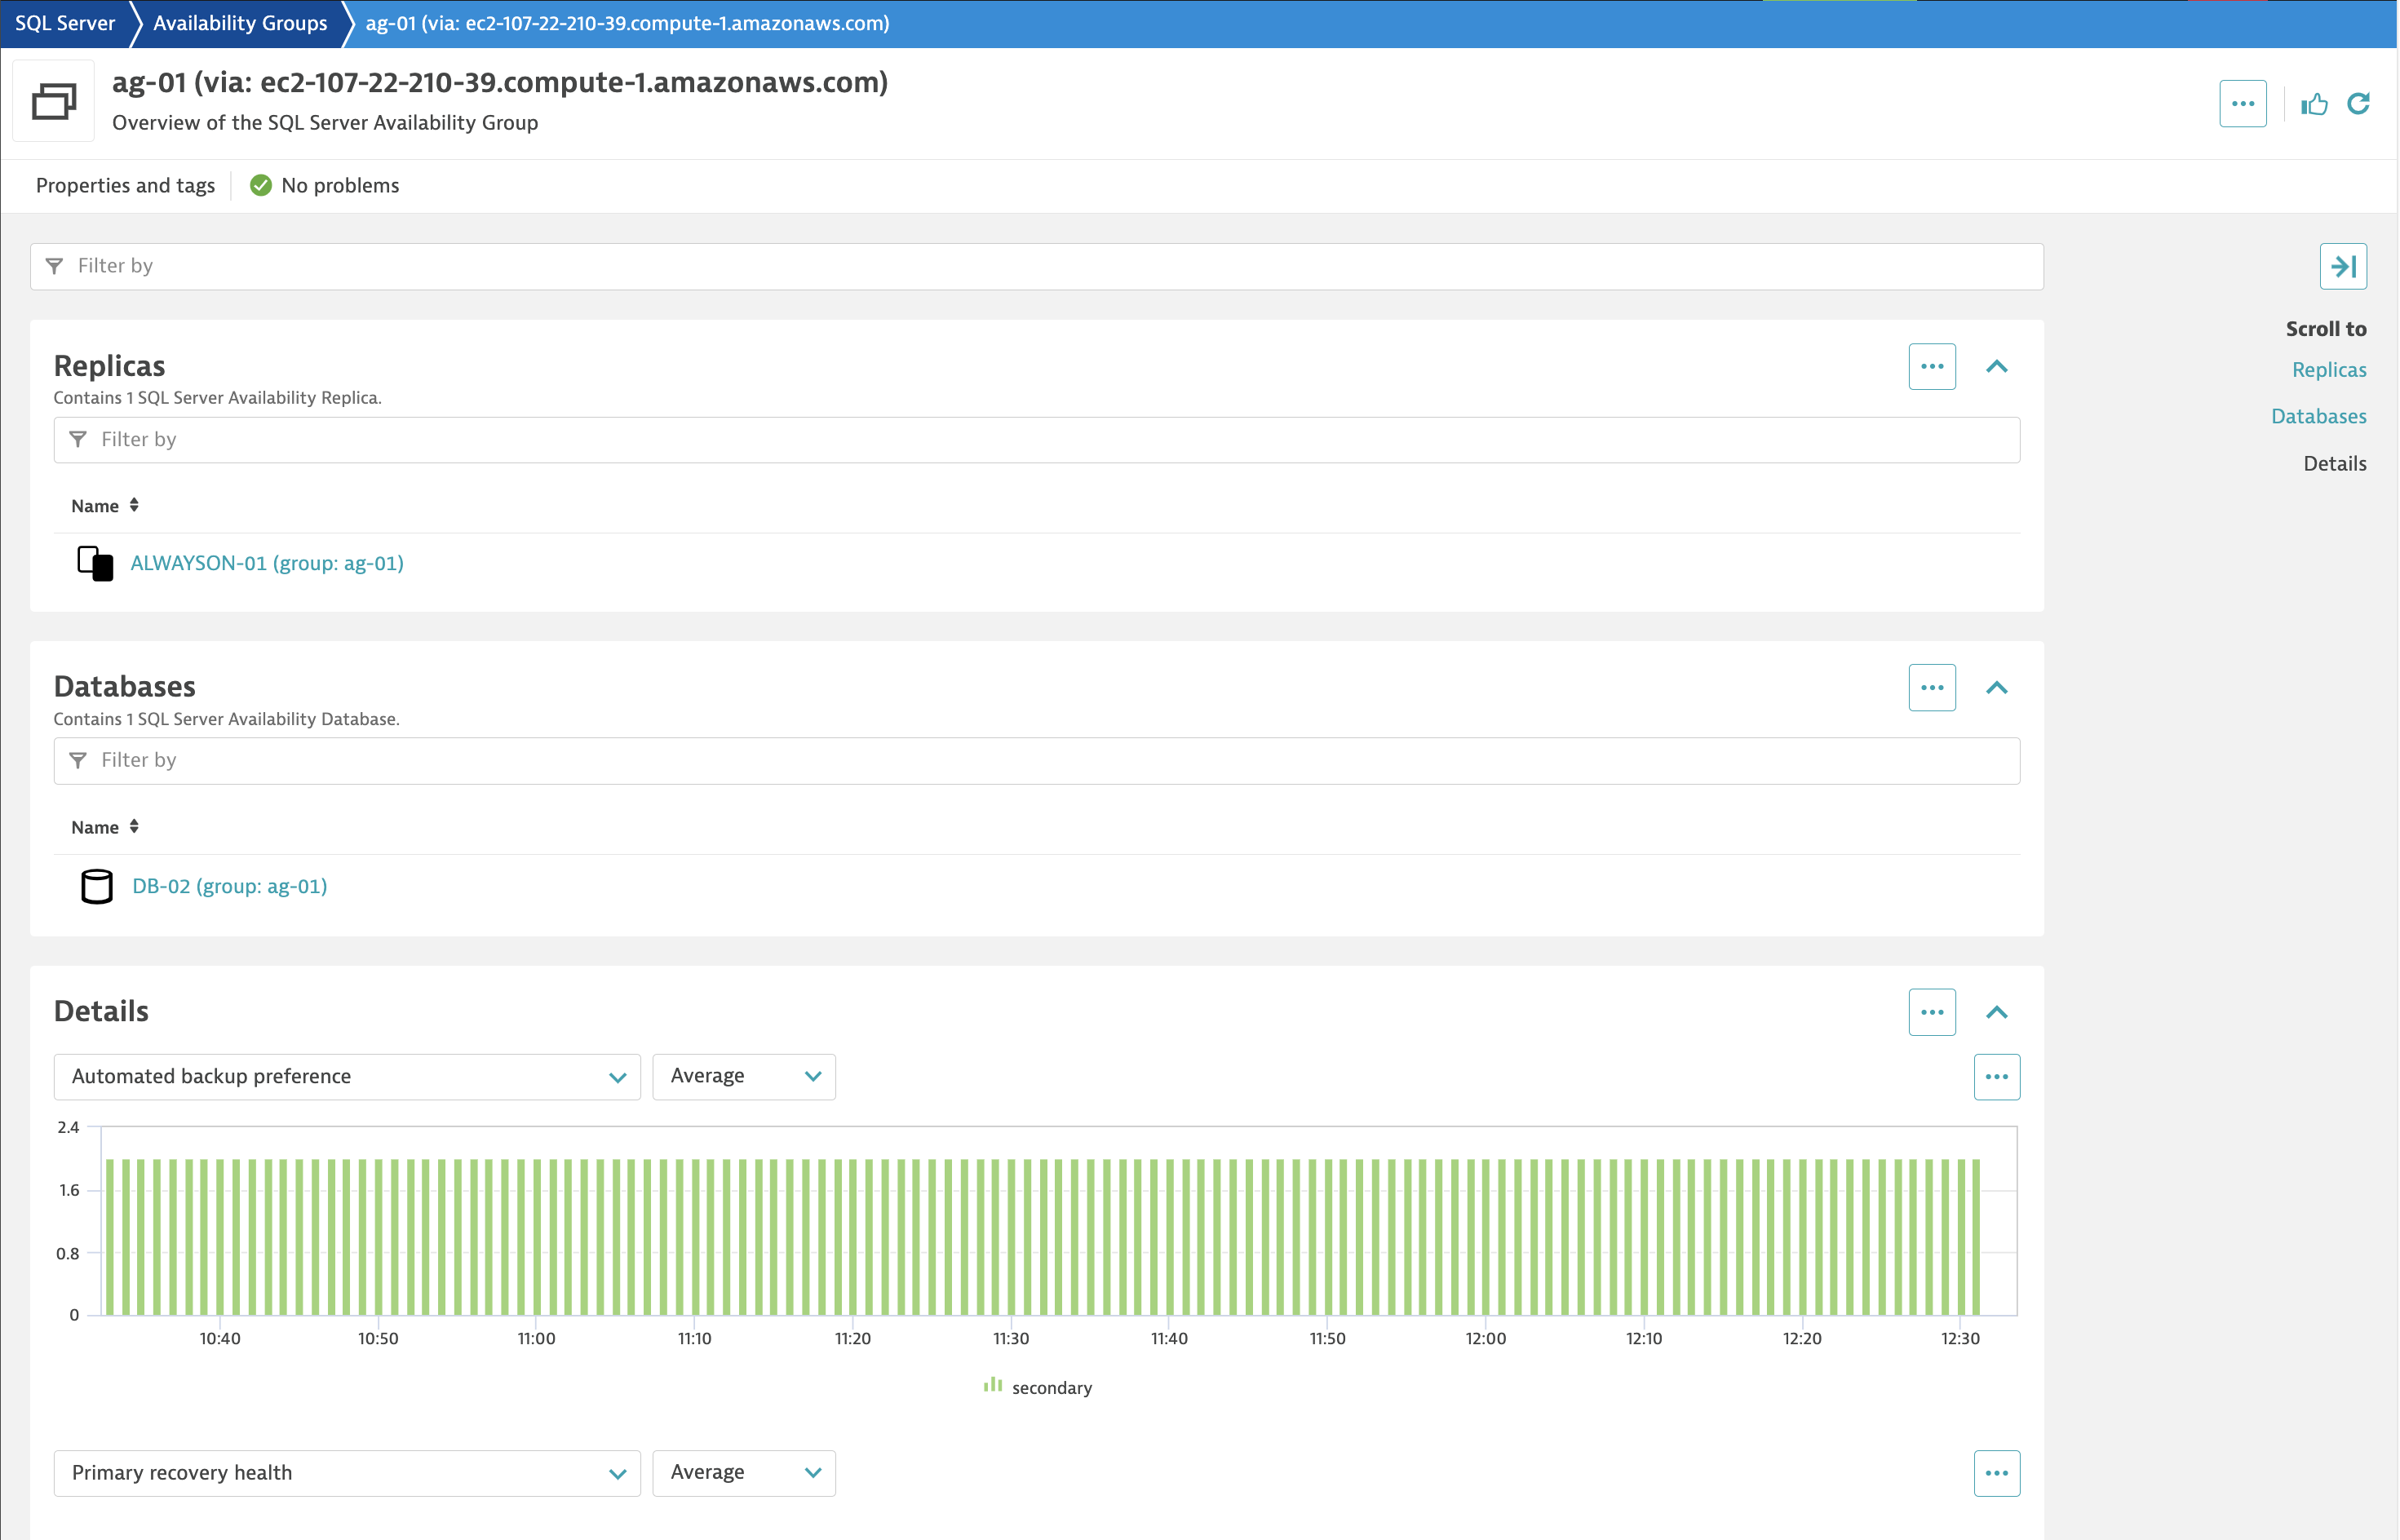
You can review the availability and performance of high availability replicas and AlwaysOn groups in SQL Server. An extension-built topology model allows you to easily navigate between all the entities that make up your database servers or cluster architecture and review specific statistics in their proper context.
Track your database performance, regardless of the vendor
We’ve expanded our database monitoring capabilities with new extensions for relational databases:
By using these extensions, you can gain access to domain expertise and carefully selected metrics that will improve the observability of your databases. They enable you to monitor the performance of your database layer, even in complex environments.
Customize database monitoring to fit your needs
In short, our solution provides a comprehensive view of your database infrastructure, enabling all stakeholders to work together seamlessly to resolve issues. With our extension framework, you can access the most relevant metrics and logs, gaining deeper insights into your database’s performance. By leveraging query-level visibility and custom metric-event tracking, you can identify areas that require improvement, ensuring your business operates smoothly.
Start monitoring your databases
To begin monitoring your critical databases, follow the link listed above that relates to your particular database type. Then, use the Extension Activation Wizard to activate your Dynatrace database extension.
What’s next?
Currently, we’re working on adding additional extensions to further improve overall performance, including JMX-based connection pool monitoring, NoSQL, in-memory extensions, better overall database entity monitoring, and query plans.


Looking for answers?
Start a new discussion or ask for help in our Q&A forum.
Go to forum