In this blog post, we’ll review how to run Linux profilers such as perf and produce flame graphs on Kubernetes environments.
Flame graphs are a graphical representation of function calls. It shows which code paths are more busy on the CPU in given samples. They can be generated with any OS profiler that contains stack traces such as perf, eBPF, and SystemTap.
An example of a flame graph can be found below:
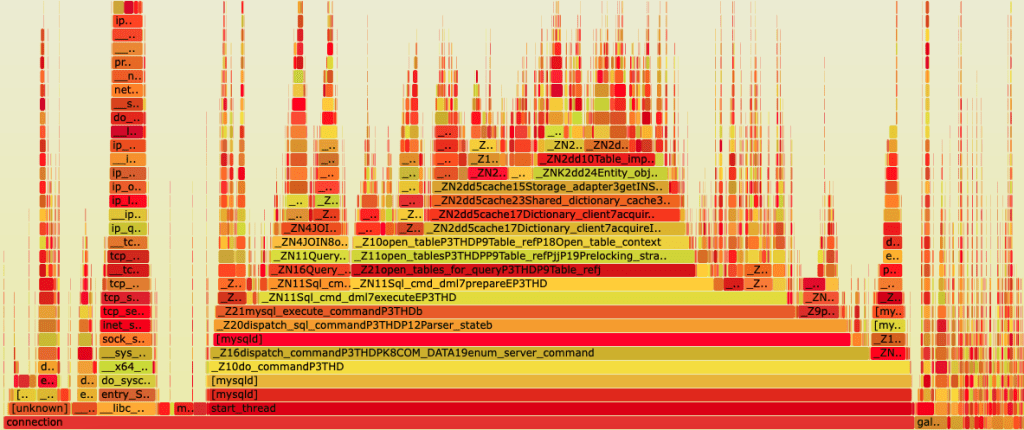
Each box is a function in the stack, and wider boxes mean more time the system was busy on CPU on these functions.
Kubernetes limitations
In Linux, by default, performance system events can’t be collected by unprivileged users. In regular environments, this can be easily worked around by running the profiler with a sudo privilege.
On the other hand, in Kubernetes environments, pods are the smallest deployable unit that consists of one or more containers. Exploits are generally targeted to pods to gain access to the underlying worker node. For this reason, and to limit the impact of a container compromise, it’s recommended not to run containers as a root privileged user. This restricts the ability of running profilers to diagnose a performance issue from inside the container.
Another Kubernetes limitation is related to container images. It’s rare to find debugging binaries, libraries, and symbols on images. Usually, application containers have only the minimum necessary packages to run the application. The idea behind this is to speed up cluster resources such as garbage collection, reduce image transfer over the network, and accelerate the application launch.
Automatically producing flame graphs with kubectl-flame
There are alternative methods to running profilers from within the container. An example is kubectl-flame (https://github.com/yahoo/kubectl-flame). We’ll review how flame graphs can be created using this tool.
kubectl-flame is a plugin to automatically generate flame graphs from a given container inside a Kubernetes pod. It does not require any modification to the application or the running pod, which makes it ideal to profile applications.
Under the hood, the tool launches a privileged pod on the same worker node as the pod to profile. The kubectl-flame container has the hostPID option enabled, and this provides visibility of the underlying Kubernetes node process ID namespace to collect system events from running processes on the host. Certainly, this can be a security concern due to privilege escalation; however, the risk lasts until the flame graph is produced, which is a few minutes. Then, the pod is deleted. In secure environments where policies are defined, launching such a pod should be done by a trusted privileged user.
The documentation mentions that the supported languages to profile are Go, Java (any JVM-based language), Python, Ruby, and NodeJS.
Depending on the application programming language, which is specified as an argument in the command line, the tool launches a compatible image profiler that contains everything it needs to successfully produce the flame graph.
For example, if you specify the NodeJS language, it produces the flame graph based on perf output. In case the application is in Go, the selected profiler will be eBPF.
That said, your application may not be in the list of supported languages, but if it’s compatible with any of the available profilers, you can still produce flame graphs.
kubectl-flame can be easily installed using the krew plugin manager for kubectl using the following command:
1 | $ kubectl krew install flame |
In the following example, we’ll produce a flame graph from a Percona Operator for MySQL based on Percona XtraDB Cluster container running the mysqld process:
1 2 3 4 5 | $ kubectl flame cluster1-pxc-0 --time 1m --lang node --file flamegraph.perf.svg pxc Verifying target pod ... ✔ Launching profiler ... ✔ Profiling ... ✔ FlameGraph saved to: flamegraph.perf.svg ? |
The first argument, cluster1-pxc-0, is the pod name running the application we want to profile. In case the pod has more than one container, we’ll need to specify as the last argument the container name, in this case, pxc, which is the container running the mysqld process.
The –time flag indicates the duration of the samples collection.
MySQL is not written in NodeJS, but we specify –lang node to launch the perf profiler, which is compatible with C/C++.
The resulting file is a flame graph in SVG format that can be displayed in a web browser.
Manual flame graphs collection
Although the tool is excellent and automatically provides flame graphs, we don’t have much control over tuning the selected profiler. A simple sysbench benchmark on MySQL shows an overhead between six and 10 percent on CPU-bound systems when running perf with the default sampling frequency of 4000 Hz. Usually, we want to reduce its default sampling frequency to 99 Hz to prevent a performance impact on the application; this is not possible when using kubectl-flame.
As an alternative, in case we want to fine-tune the profiler, we can imitate the tool process by launching a privileged pod with hostPID enabled, installing the profiler alongside all necessary tools, and then manually executing the profiler using the options we want.
In the following example, we’ll see how to manually run perf on a mysqld process inside a Kubernetes pod.
The first step is to identify the UID from the pod we want to collect system metrics and the underlying Worker node where it’s running. To obtain this information, we can execute the following command, adding the target pod:
1 2 3 | $ kubectl get pods cluster1-pxc-0 -o custom-columns=PodName:.metadata.name,PodUID:.metadata.uid,PodNode:.spec.nodeName PodName PodUID PodNode cluster1-pxc-0 5544b409-e240-40b7-9634-ec542521b225 node-02 |
Now we know the pod UID and in which Kubernetes node is running, we can launch a pod on the same node. We’ll use the following YAML file:
1 2 3 4 5 6 7 8 9 10 11 12 13 14 15 16 17 18 | apiVersion: v1 kind: Pod metadata: name: debug spec: containers: - args: - "3600" command: - sleep image: ubuntu:20.04 name: debug imagePullPolicy: Always securityContext: privileged: true hostPID: true nodeName: node-02 restartPolicy: Never |
Note the nodeName value is node-02, which is the same worker node as the pxc pod. Similar to kube-flame, we’ll need hostPID enabled to see other processes and privileged to be able to run the profiler.
I’m using an Ubuntu image since most profilers can be easily installed using apt.
We apply the YAML file to create the pod:
1 2 | $ kubectl apply -f debug.yaml pod/debug created |
The AGE field shows the debug pod was recently launched:
1 2 3 | $ kubectl get pods debug NAME READY STATUS RESTARTS AGE debug 1/1 Running 0 31s |
We can access the container by running the kubectl exec command:
1 | $ kubectl exec -it debug -- bash |
Once inside, we need to install the package that contains perf:
1 | root@debug:/# apt-get update && apt-get install -y linux-tools-`uname -r` |
And then identify the mysqld process to run perf on it.
One of the key elements of Kubernetes is multi-tenancy. This means multiple workloads or applications can share the same Kubernetes cluster. So, it’s possible when accessing a worker node process ID namespace to see several different processes with the same name. Similar to the following example:
1 2 3 | root@debug:/# ps -ef | grep mysqld 1001 1335771 1335375 2 Sep17 ? 00:10:15 mysqld 1001 1396816 1334387 3 Sep17 ? 00:15:17 mysqld |
How can we determine which process belongs to the target pod?
Based on the pod UID, we can identify the mysqld process we want to profile by checking the process cgroup information. Depending on the Kubernetes implementation, the cgroup information may show the pod UID in a different format. So we extract a portion from the UID pod taken in the first step and check the corresponding cgroup process information:
1 2 | root@debug:/# grep -H ec542521b225 /proc/{1335771,1396816}/cgroup /proc/1396816/cgroup:0::/kubepods.slice/kubepods-burstable.slice/kubepods-burstable-pod5544b409_e240_40b7_9634_ec542521b225.slice/cri-containerd-7063cf6fcb1c5740f4f3edcc61267c6005df515a9856c9d98a3d61a7fa831c02.scope |
In this case, we see the related pod UID information in the process 1396816. This means this is the process we want to profile.
We execute the perf record command on the target process, reducing the frequency as mentioned:
1 2 3 4 5 | root@debug:/# perf record -a -g -F99 -p 1396816 -o perf.data -- sleep 60; Warning: PID/TID switch overriding SYSTEM [ perf record: Woken up 1 times to write data ] [ perf record: Captured and wrote 0.047 MB perf.data (121 samples) ] |
Install Git and clone the FlameGraph repository:
1 2 | root@debug:/# apt-get install -y git root@debug:/# git clone https://github.com/brendangregg/FlameGraph |
Then run the perf script and generate the flame graph output file:
1 2 | root@debug:/# perf script | ./FlameGraph/stackcollapse-perf.pl > out.perf-folded root@debug:/# ./FlameGraph/flamegraph.pl out.perf-folded > perf.svg |
Finally, you can exit the debug pod, copy the output file, and delete the pod:
1 2 3 4 5 | root@debug:/# exit exit $ kubectl cp debug:perf.svg perf.svg $ kubectl delete pod debug pod "debug" deleted |
Conclusion
Due to container complexity and security aspects, it’s pretty challenging to achieve Kubernetes observability. Fortunately, there are tools such as kubectl-flame that automate profiling gathering. In some cases, it’s possible to run profilers manually on Kubernetes to have more control over the data collection process.
Percona Distribution for MySQL is the most complete, stable, scalable, and secure open source MySQL solution available, delivering enterprise-grade database environments for your most critical business applications… and it’s free to use!
Try Percona Distribution for MySQL today!