
Edge computing brings compute and data storage closer to where data is generated. Red Hat offers Red Hat Device Edge which aggregates an enterprise-ready and supported distribution of the Red Hat-led open source community project, MicroShift (a lightweight Kubernetes project derived from the edge capabilities of Red Hat OpenShift), Red Hat Ansible Automation Platform, along with an edge-optimized operating system built from Red Hat Enterprise Linux for the far edge. Cloud-native workloads at the edge save costs and boost performance. However, edge observability can be challenging due to distribution, resource limits, and security issues. Dynatrace offers a scalable observability and security solution for enterprise edge scenarios, featuring topology, open observability, Grail data lakehouse, parallel processing, and AI-driven analytics for unified data context.
Cloud-native workloads on edge devices are gaining momentum among organizations as they extend the hybrid cloud closer to the data source and end users at the edge. Successful deployments of cloud-native workloads at the edge help to reduce costs, boost performance, and improve customer experience. As an example, many retailers already leverage containerized workloads in-store to enhance customer experiences using video analytics or streamline inventory management using RFID tracking for improved security.
The challenge of cloud-native observability at the enterprise edge
In aggregate, connected devices generate huge volumes of data. As organizations see an increasingly high number of compute locations, assessing health and finding root causes of emerging problems across heavily distributed workloads, at scale, has become a daunting task. At the same time, privacy and security have never been more critical.
Observability on edge devices presents unique challenges compared to traditional data-center or cloud-based environments. These challenges stem from the distributed and often resource-constrained nature of edge computing. But there’s more than just a need for minimizing resource (CPU, memory, storage) and network (bandwidth) consumption for observability at the edge. Edge devices often handle sensitive data, and ensuring the security and privacy of observability data is crucial. Moreover, edge environments can be highly dynamic, with devices frequently joining and leaving the network. Thus, understanding the end-to-end topology and all observability signals in context is required to detect anomalies and assess end-user impact. Finally, edge deployments may be distributed across many locations, making it challenging to have personnel physically check and maintain devices. Remote management and automated alerting are, therefore, crucial.
Dynatrace on Red Hat Device Edge for enterprise edge scenarios
Many enterprises seek to extend their cloud-native workloads to remote locations while keeping storage and analytics centralized in public or hybrid clouds. For such enterprise edge setups, it’s necessary to keep all data in context and maintain a unified approach for observability and security that can scale on top of the ever-increasing data volume.
The Dynatrace® unified observability and security platform addresses the needs of enterprise-edge scenarios by managing the health and performance of containerized applications and multi-cloud infrastructures with metrics, traces, and logs in one place.
Deploy Dynatrace on Red Hat Device Edge with MicroShift
Dynatrace can be deployed in various ways depending on the desired observability value and resource constraints of edge devices:
- Application observability
Brings the full power of Davis® AI for anomaly detection and causal correlation, world-class distributed tracing, memory and CPU profiling, and powerful deep code-level insights using method hotspots to application workloads. Application observability also helps to improve end-user experiences when combined with Dynatrace Digital Experience monitoring. Applications are automatically instrumented during runtime by leveraging Dynatrace Operator or at build time by including Dynatrace OneAgent® in your Docker file. - Kubernetes observability
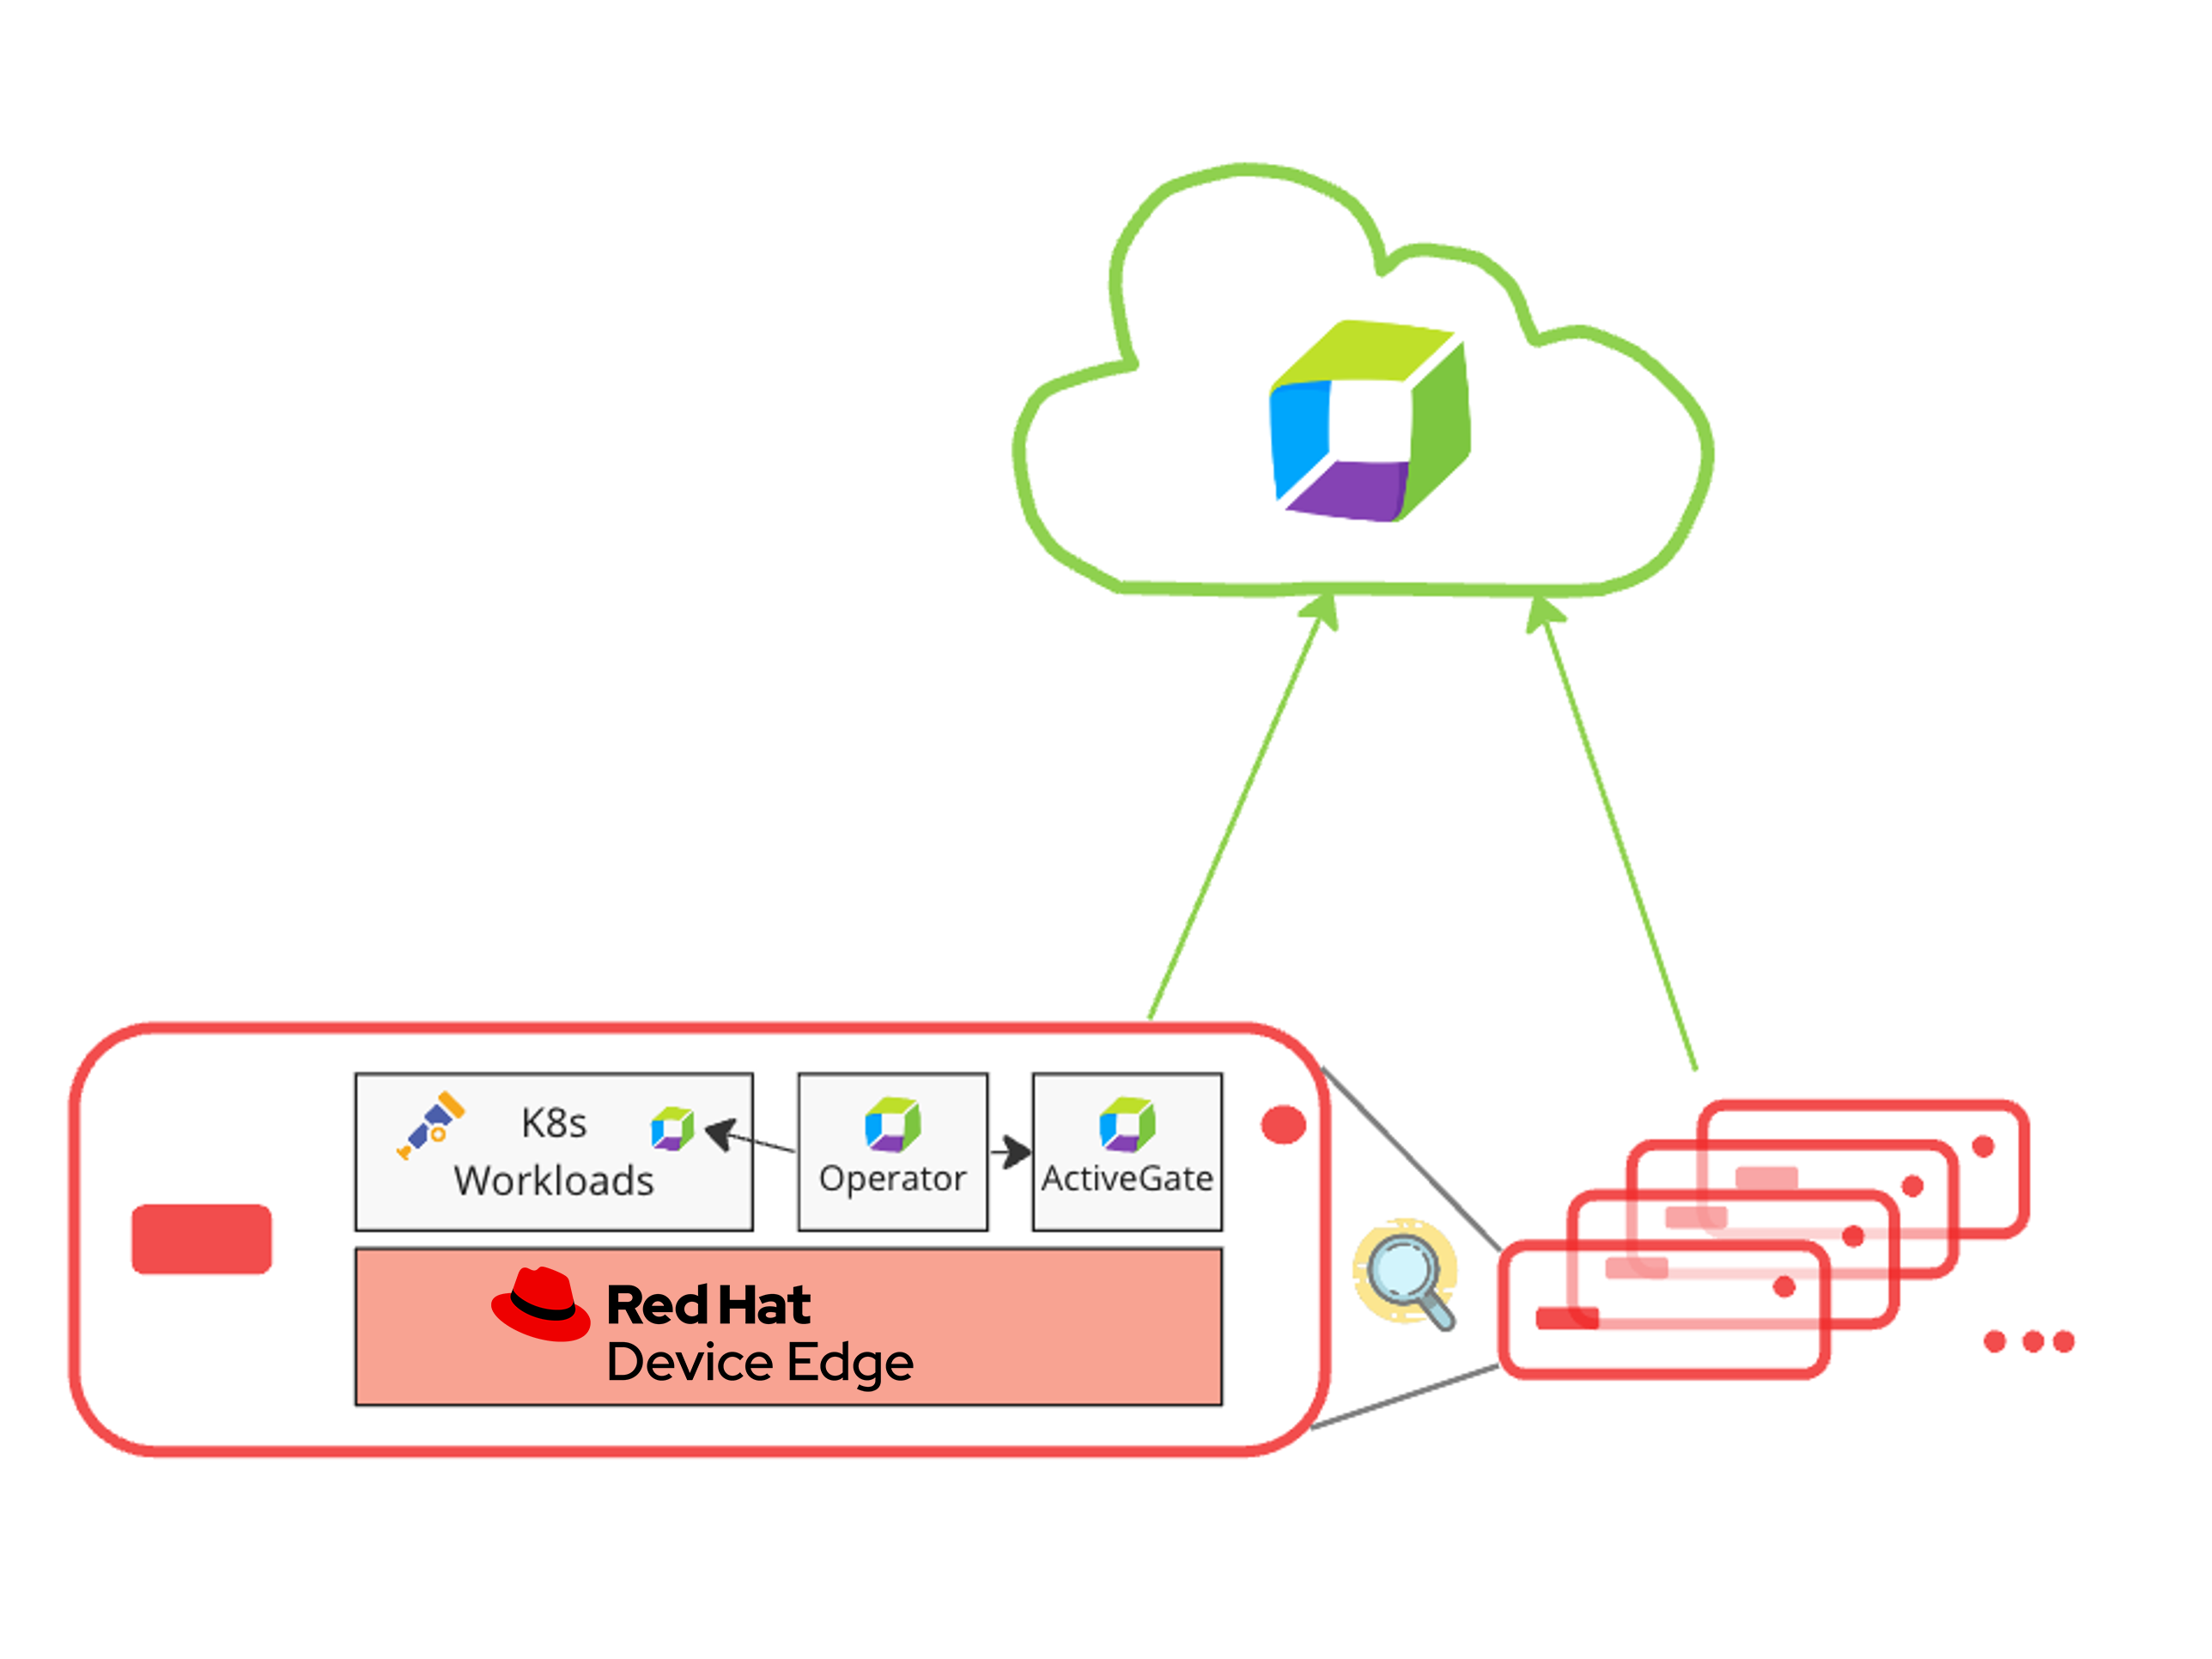
Helps to understand and troubleshoot the health and performance of your MicroShift deployments and optimize resources by providing out-of-the-box alerting and anomaly detection, automated root cause analysis, as well as metrics, events, and topology in context. The Kubernetes-based app platform can be deployed inside or outside a data center using distributed OpenShift topologies alongside even smaller Red Hat Device Edge. ActiveGate acts as a secure proxy and compresses and routes observability signals in an optimized manner to Dynatrace servers.
Dynatrace customers can ingest data from sources like Prometheus and OpenTelemetry alongside data from Dynatrace OneAgent for automated Kubernetes monitoring. Data is integrated seamlessly with Kubernetes topology. Signals are uniform, regardless of origin. The following illustrations outline a typical Red Hat Device Edge and Dynatrace setup.
The following sections highlight a few use cases supported by Dynatrace on Red Hat Device Edge, including node resource utilization, workload metrics in the context of resource utilization with Davis AI, and service insights.
Red Hat Device Edge node resource utilization
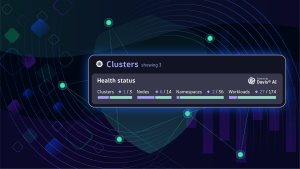
Built-in Dynatrace node analysis for Kubernetes, including Red Hat Device Edge nodes, provides out-of-the-box insights into CPU and memory utilization by comparing actual usage against requests/limits as well as an overview of all node events and pods running on the selected node.
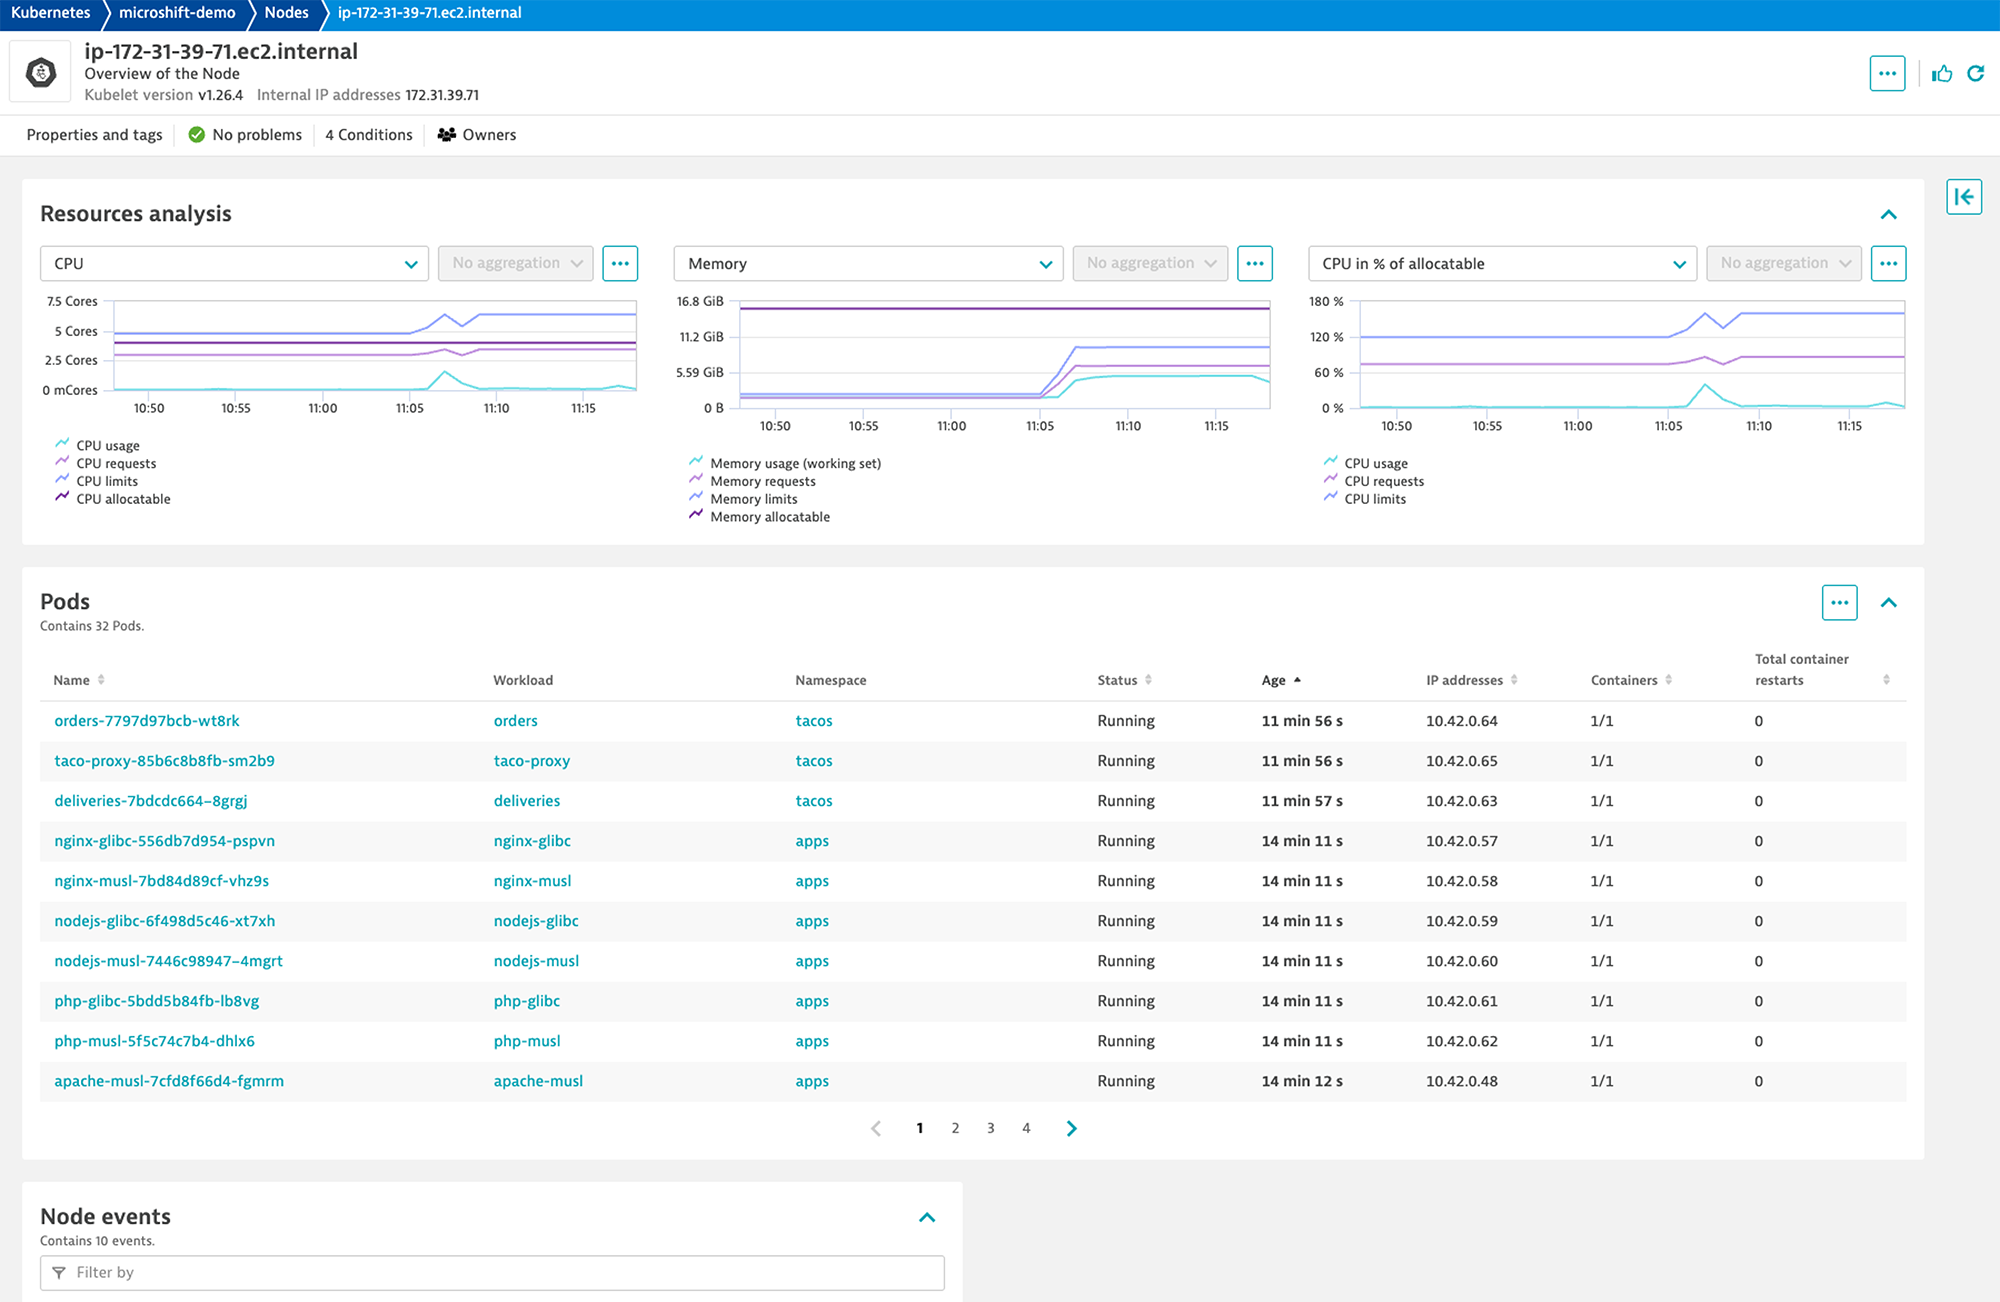
By drilling down further on the workload level, you can gain valuable insights into the performance and potential problems of any containerized workload.
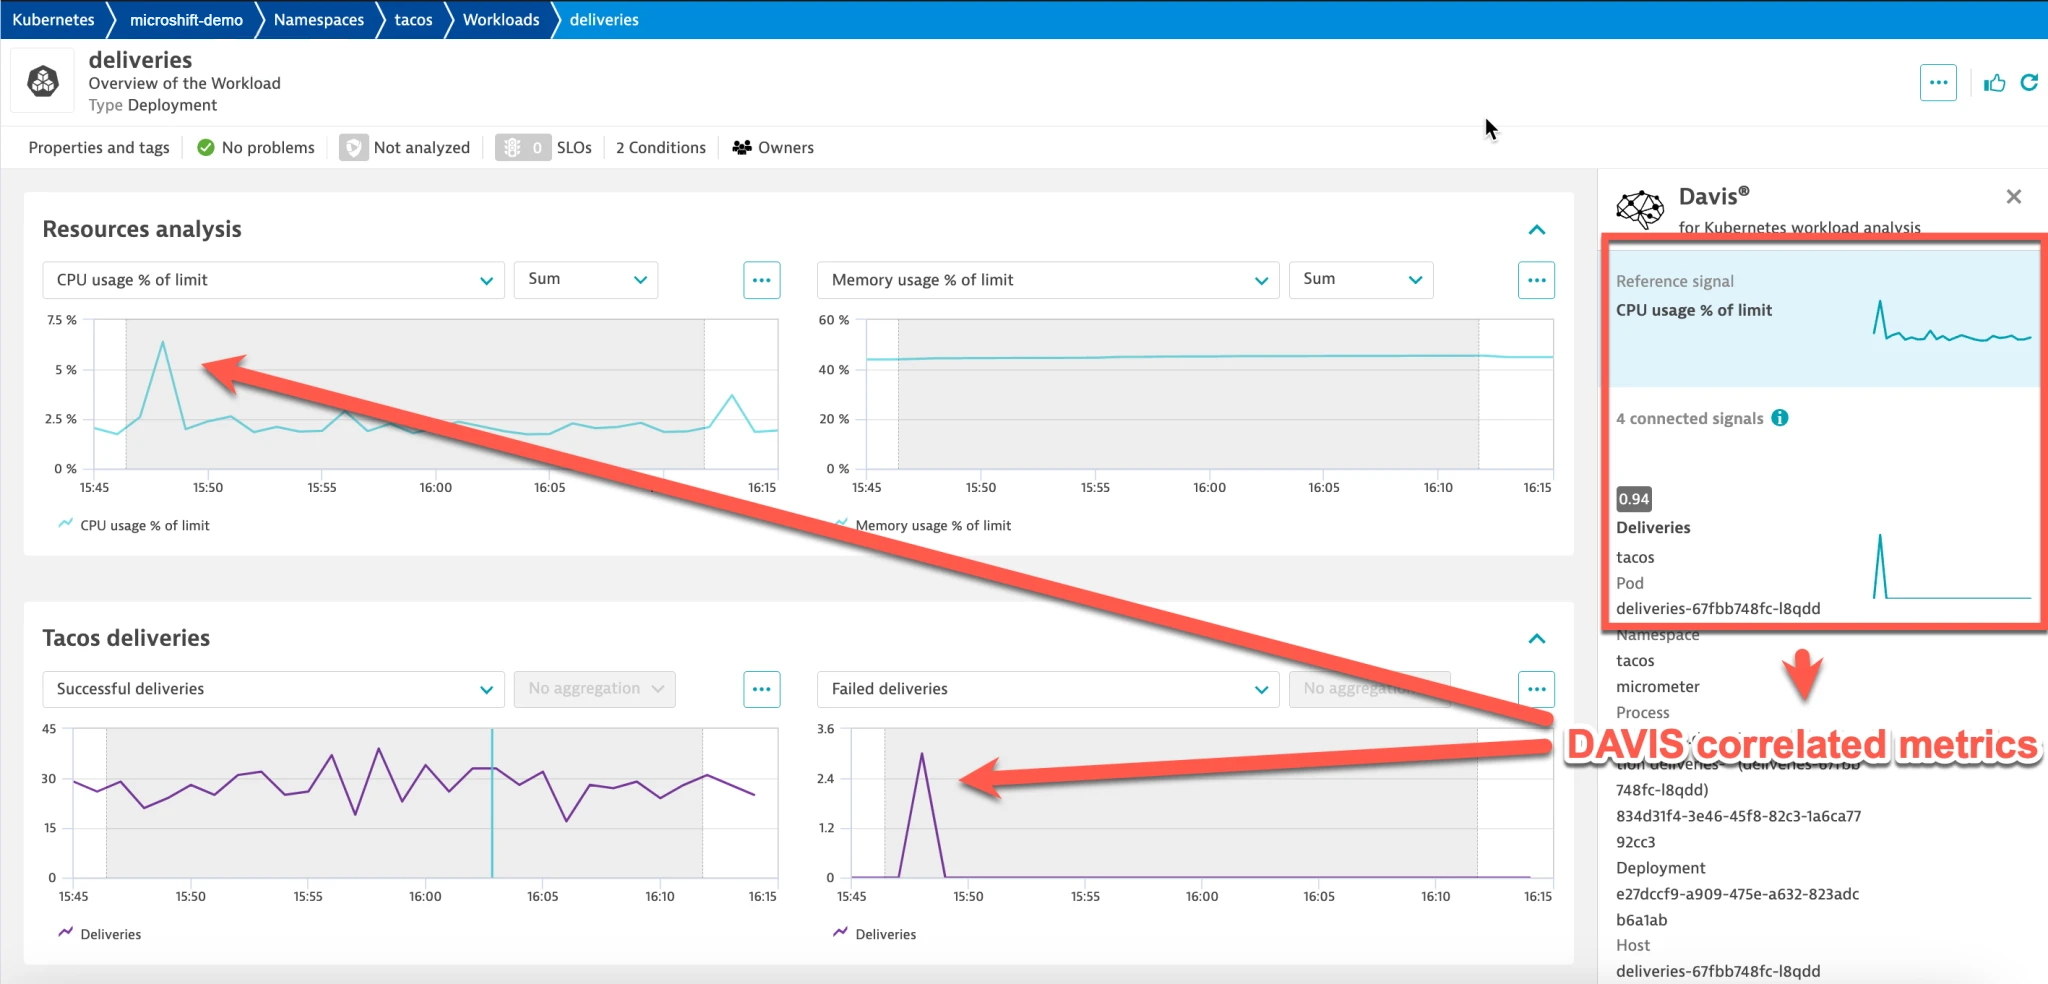
Red Hat Device Edge workload view
This built-in Dynatrace view shows resource utilization, throughput, related pods, Kubernetes Services, microservices, logs, and events for a workload called “deliveries.” You can ask Davis, the Dynatrace AI engine, to correlate CPU usage against other signals. In this case, Davis finds that a Java Spring Micrometer metric called Failed deliveries is highly correlated with CPU spikes.
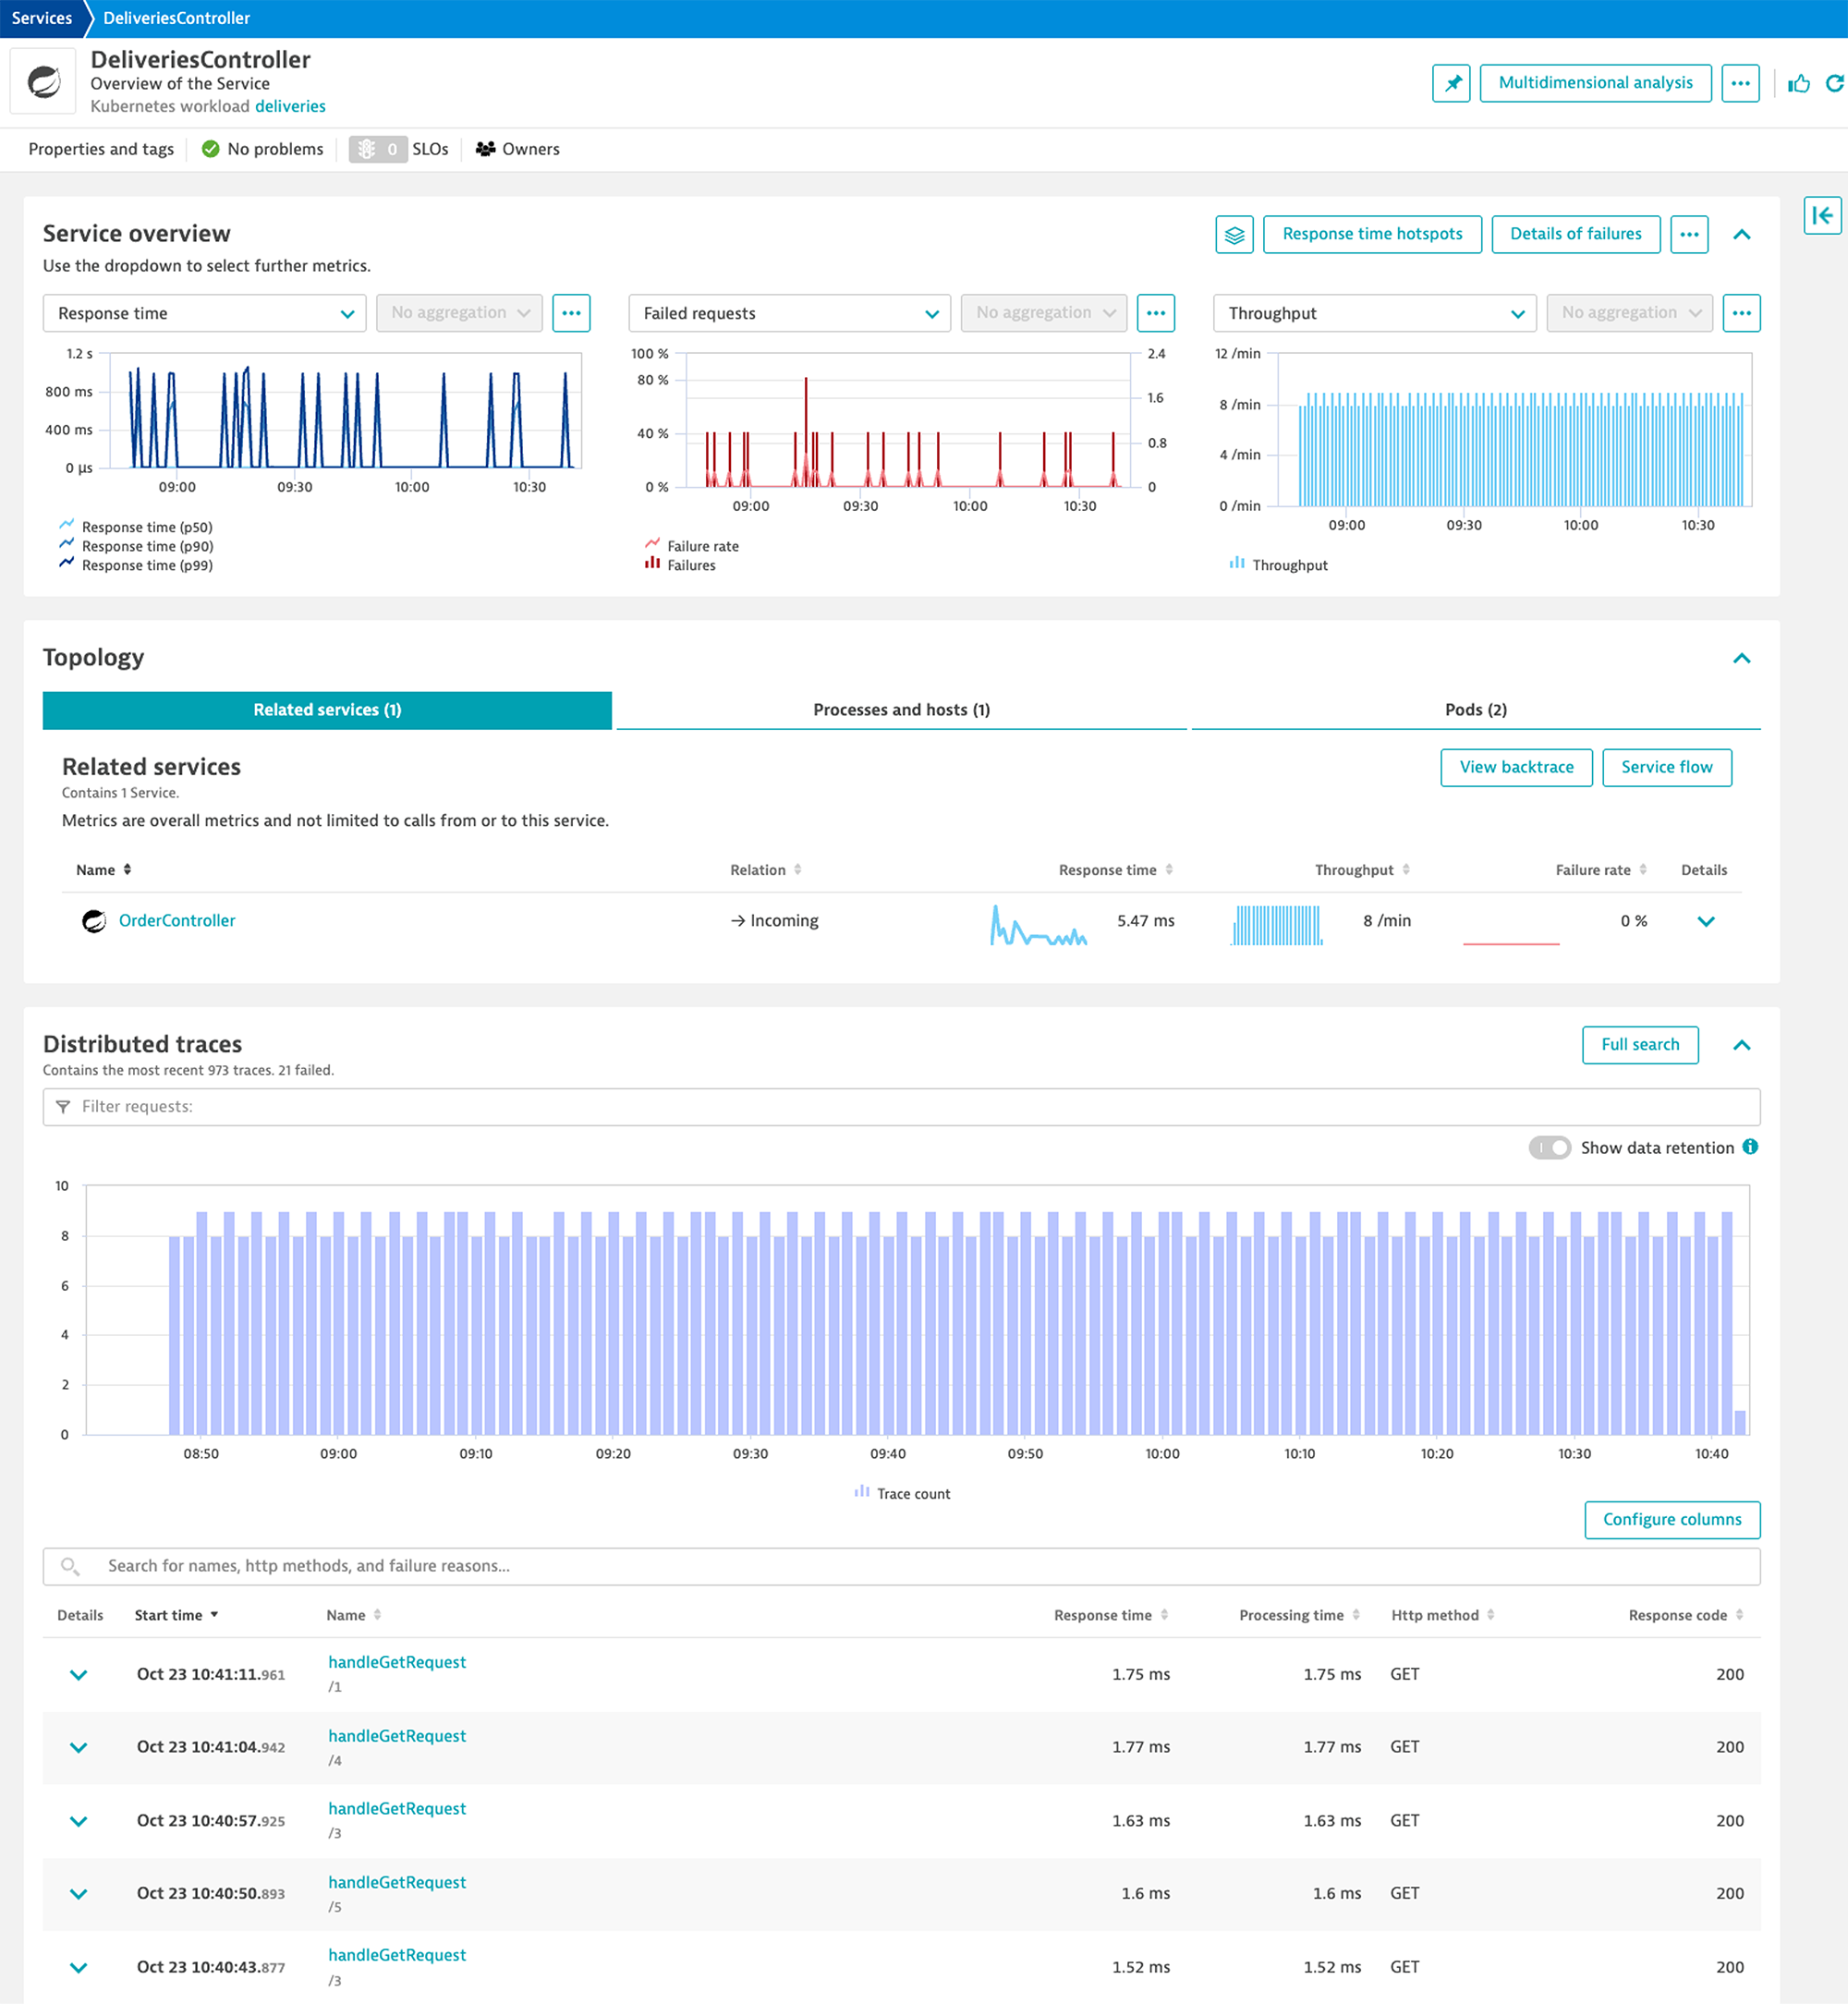
Service view
The service view provides out-of-the-box insights into the golden signals (response time, failure rate, and throughput) of the application, its topology, as well as distributed traces. In addition, it allows you to identify details of failed requests and drill down on the code level (for example, response time hotspots and memory profiles).
Seeing is believing
- You can find out more about Dynatrace and Red Hat here.
- Try it out with a free trial.
- Learn more about Red Hat Device Edge here.


Looking for answers?
Start a new discussion or ask for help in our Q&A forum.
Go to forum