
The new Dynatrace Infrastructure & Operations app provides ITOps and SRE teams with an up-to-date and comprehensive view of their monitored environments. The app offers a consolidated overview across data centers and all monitored hosts. The app helps users to quickly identify areas that require attention and drill down to the host level, where all necessary information is provided to quickly address any issue.
Infrastructure and operations teams must maintain infrastructure health for IT environments. Traditional tools struggle with the intricacy of modern cloud services and containerized applications. These complex cloud environments obscure visibility and complicate troubleshooting, especially as teams take on the daunting task of pinpointing the exact root cause of issues.
The complex interconnections in cloud-based systems make it crucial to always have a topological overview to understand dependencies. Any problem, such as a simple software update overburdening a critical database, can cause a ripple effect that degrades the performance of dependent services or applications. For example, an unnoticed database strain could slow down the response time of a web frontend, resulting in poor user experience.
To overcome these complex issues, teams must quickly find root causes among numerous alerts and metrics.
Dynatrace automatically detects and analyzes problems
This is where Dynatrace sets itself apart, using Dynatrace Smartscape® and Davis® AI to transform IT operations. It provides accurate real-time insights to ensure operational integrity and optimal performance to meet an organization’s service-level objectives (SLOs).
Supported by Dynatrace Smartscape, Davis AI automatically detects and analyzes problems. Based on the topology model, detected dependencies, and thousands of events and metrics, Davis AI can pinpoint the origin of an issue.
However, small operations and SRE teams often deal with numerous concurrent issues managing vast IT ecosystems. Identifying a problem’s severity and prioritizing effectively can be challenging.
How do they know if it’s a $5 problem or a $1 million problem?
The Infrastructure & Operations app provides a comprehensive overview for effective prioritization
The new Infrastructure & Operations app provides situational awareness to help ops and SRE teams group and categorize problems efficiently based on their impact. This helps teams to anticipate problems, rather than just react to them, which fosters strategic, value-based decision making.
With the Infrastructure & Operations app ITOps teams can quickly track down performance issues at their source, in the problematic infrastructure entities, by following items indicated in red. This approach provides an immediate understanding of how entities such as hosts, processes, and their associated relationships contribute to the identified issue. Customers can access a real-time, granular view of their environment’s status.
Data center overview
Beginning with a comprehensive view of all interconnected data centers, Dynatrace Davis AI instantly recognizes and categorizes any issues. This allows you to pinpoint troubled data centers at a glance.
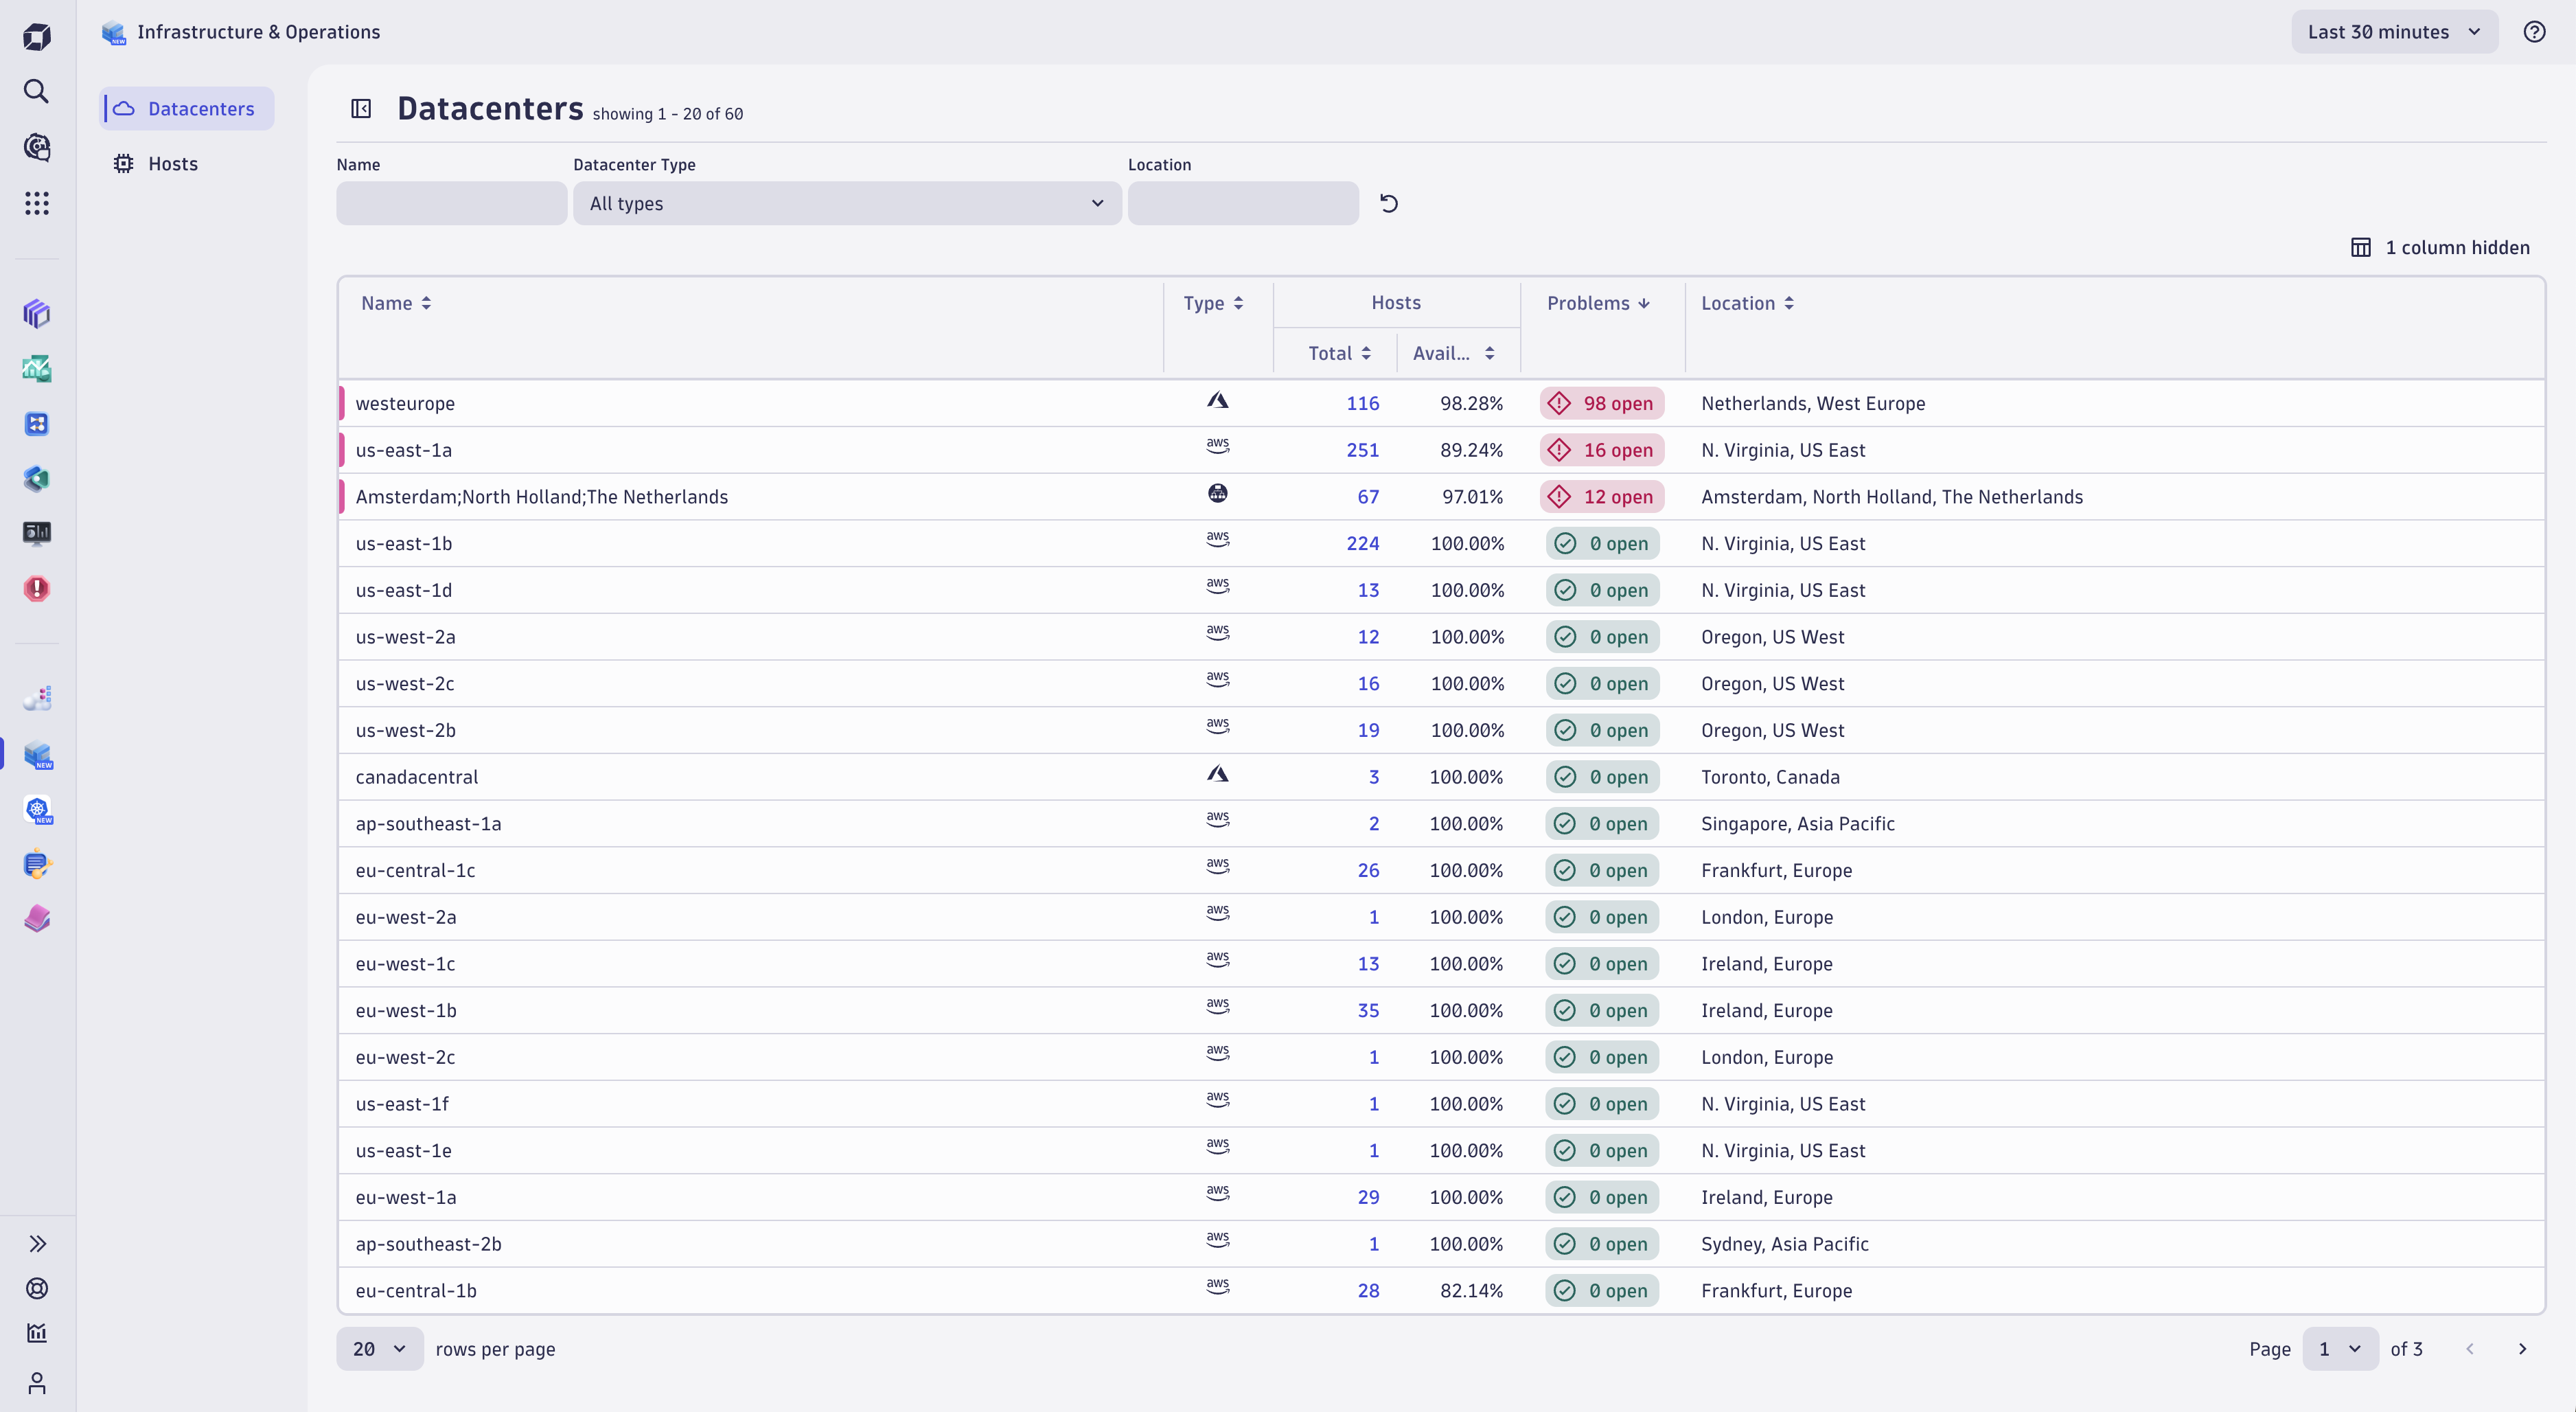
Focusing on a particular data center reveals a detailed list of all the monitored hosts. You can filter data centers based on their type and location, then sort the number of open problems.
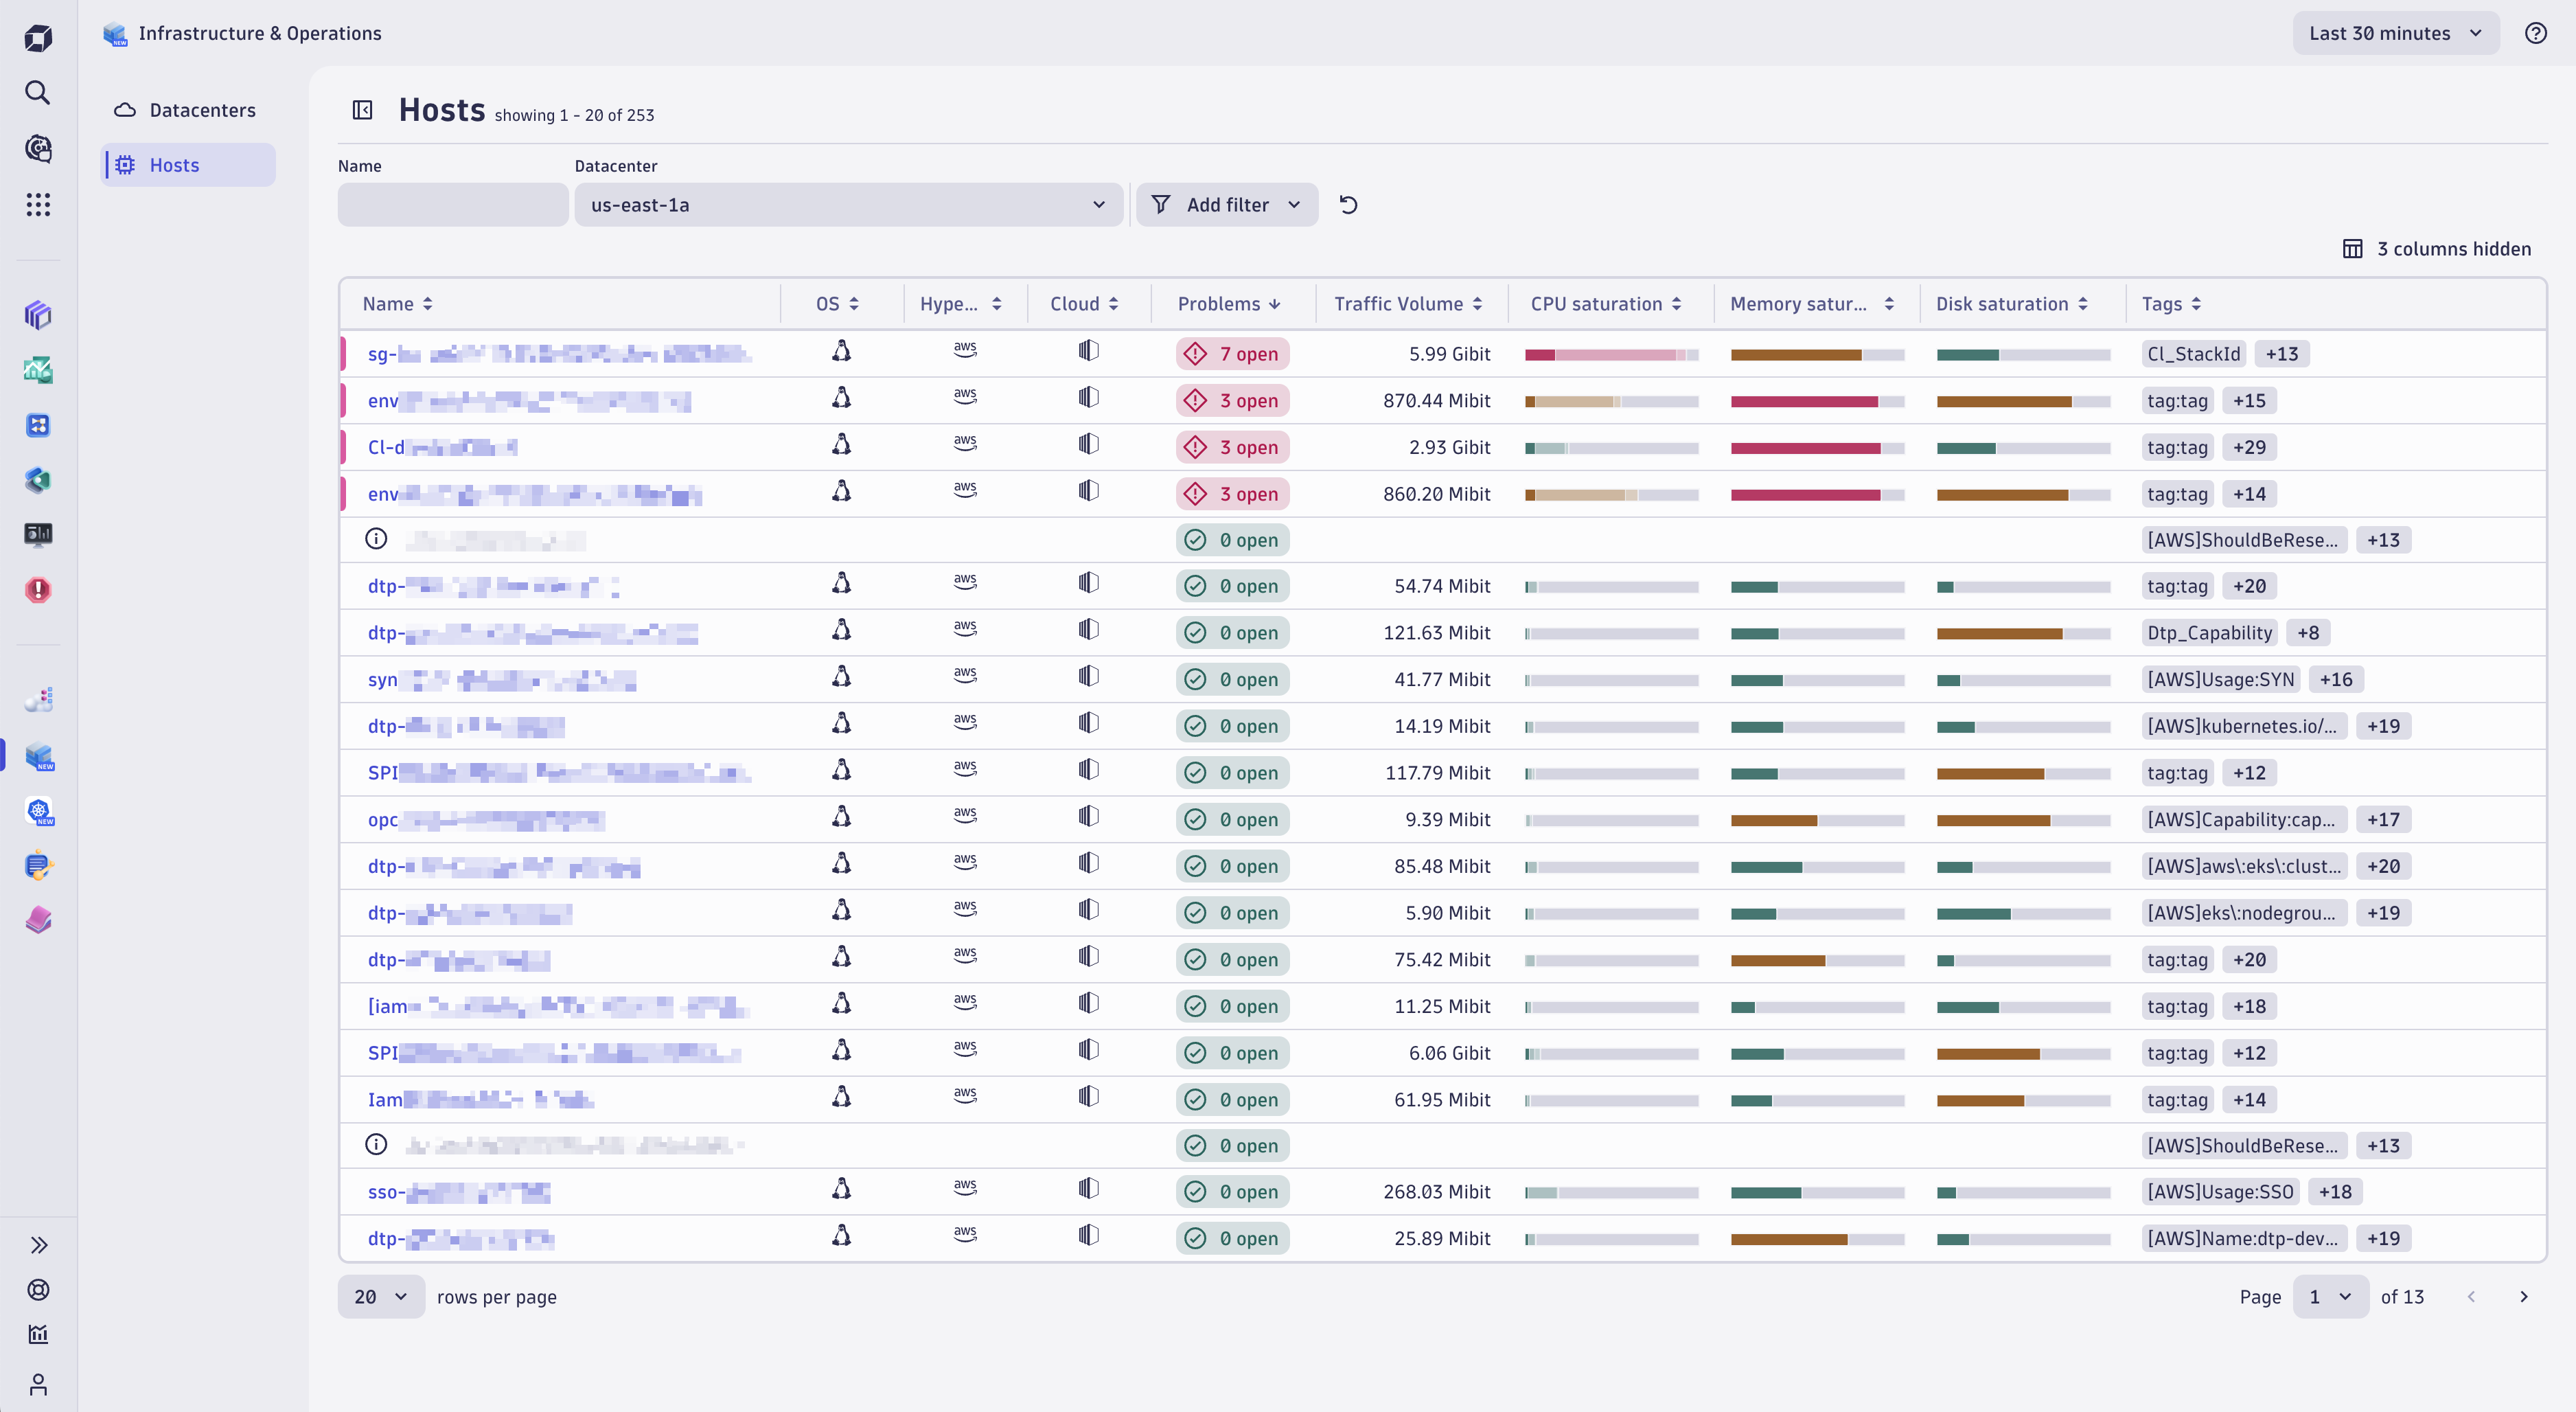
The hosts page allows teams to quickly identify hosts requiring attention through straightforward sorting and filtering tools. Immediately, you can spot and understand issues with problematic hosts and seamlessly organize them according to vital health metrics, such as CPU load, available memory, disk capacity, and network connectivity, facilitating prompt and efficient issue resolution.
Furthermore, the sorting feature organizes hosts based on key health indicators, including CPU usage, memory capacity, disk space, and network performance, making it easy to quickly identify the most critical areas of concern.
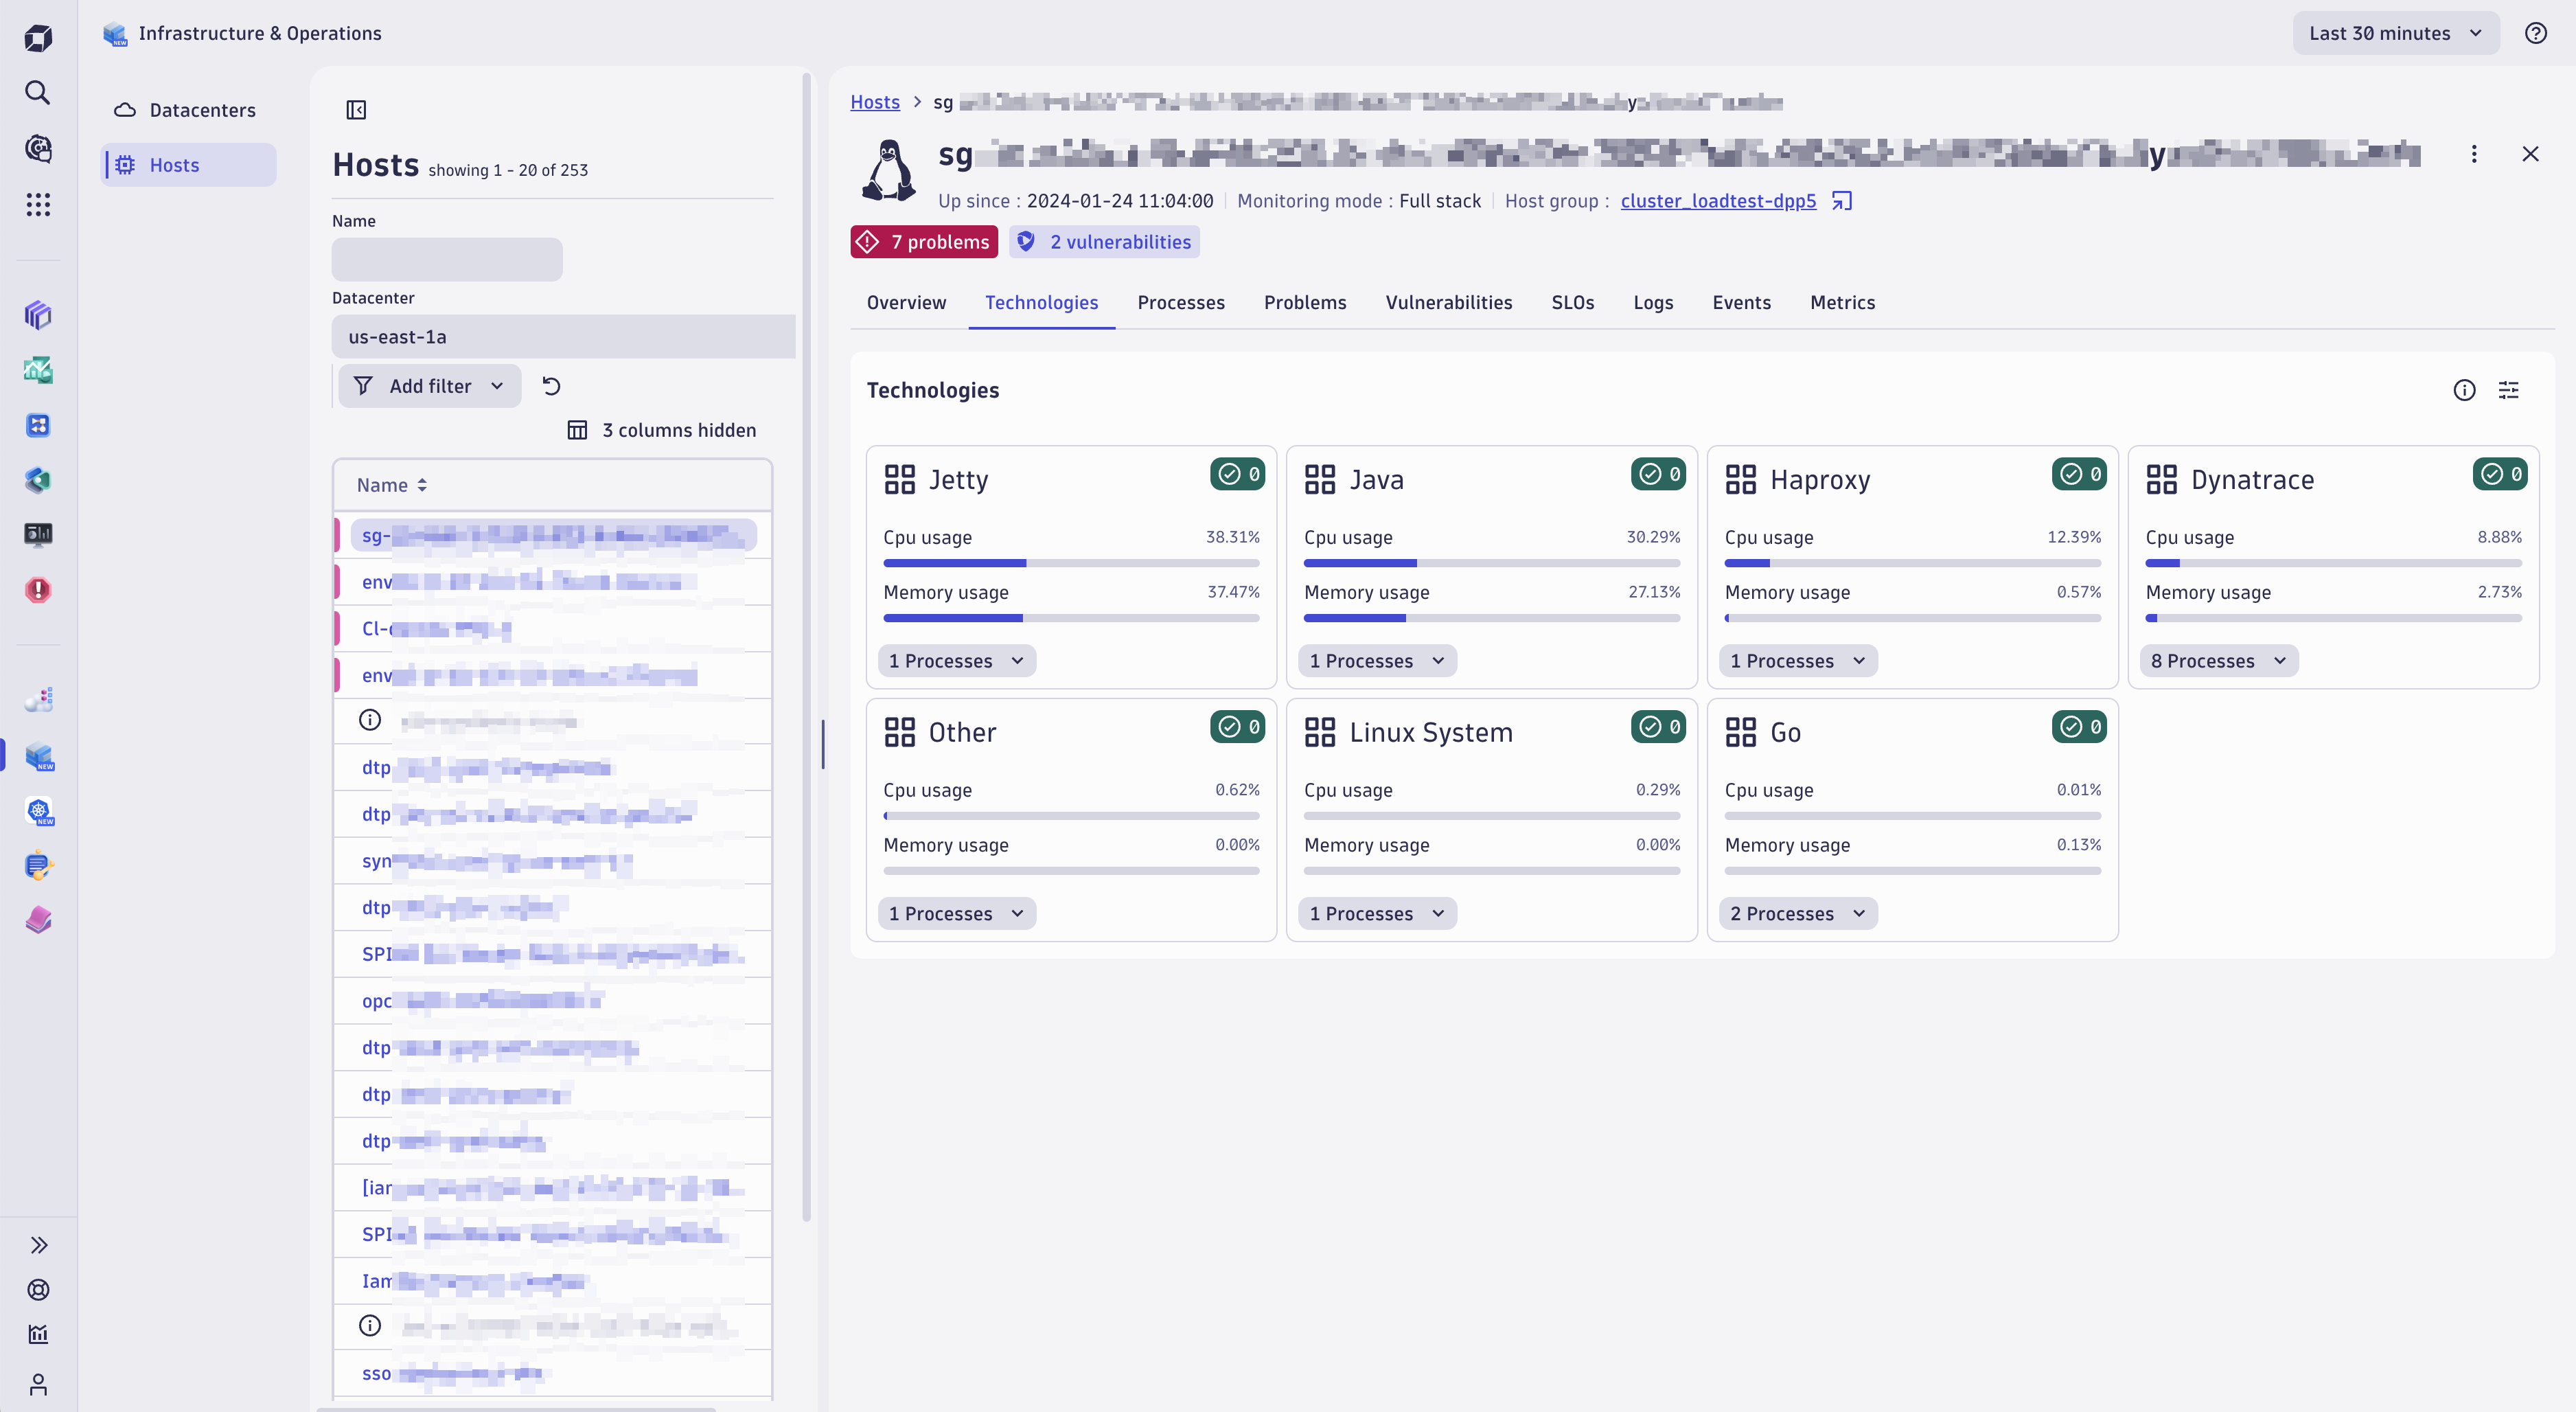
Host details
Focusing on a specific host, you can see all used technologies with detailed status information and links to processes.
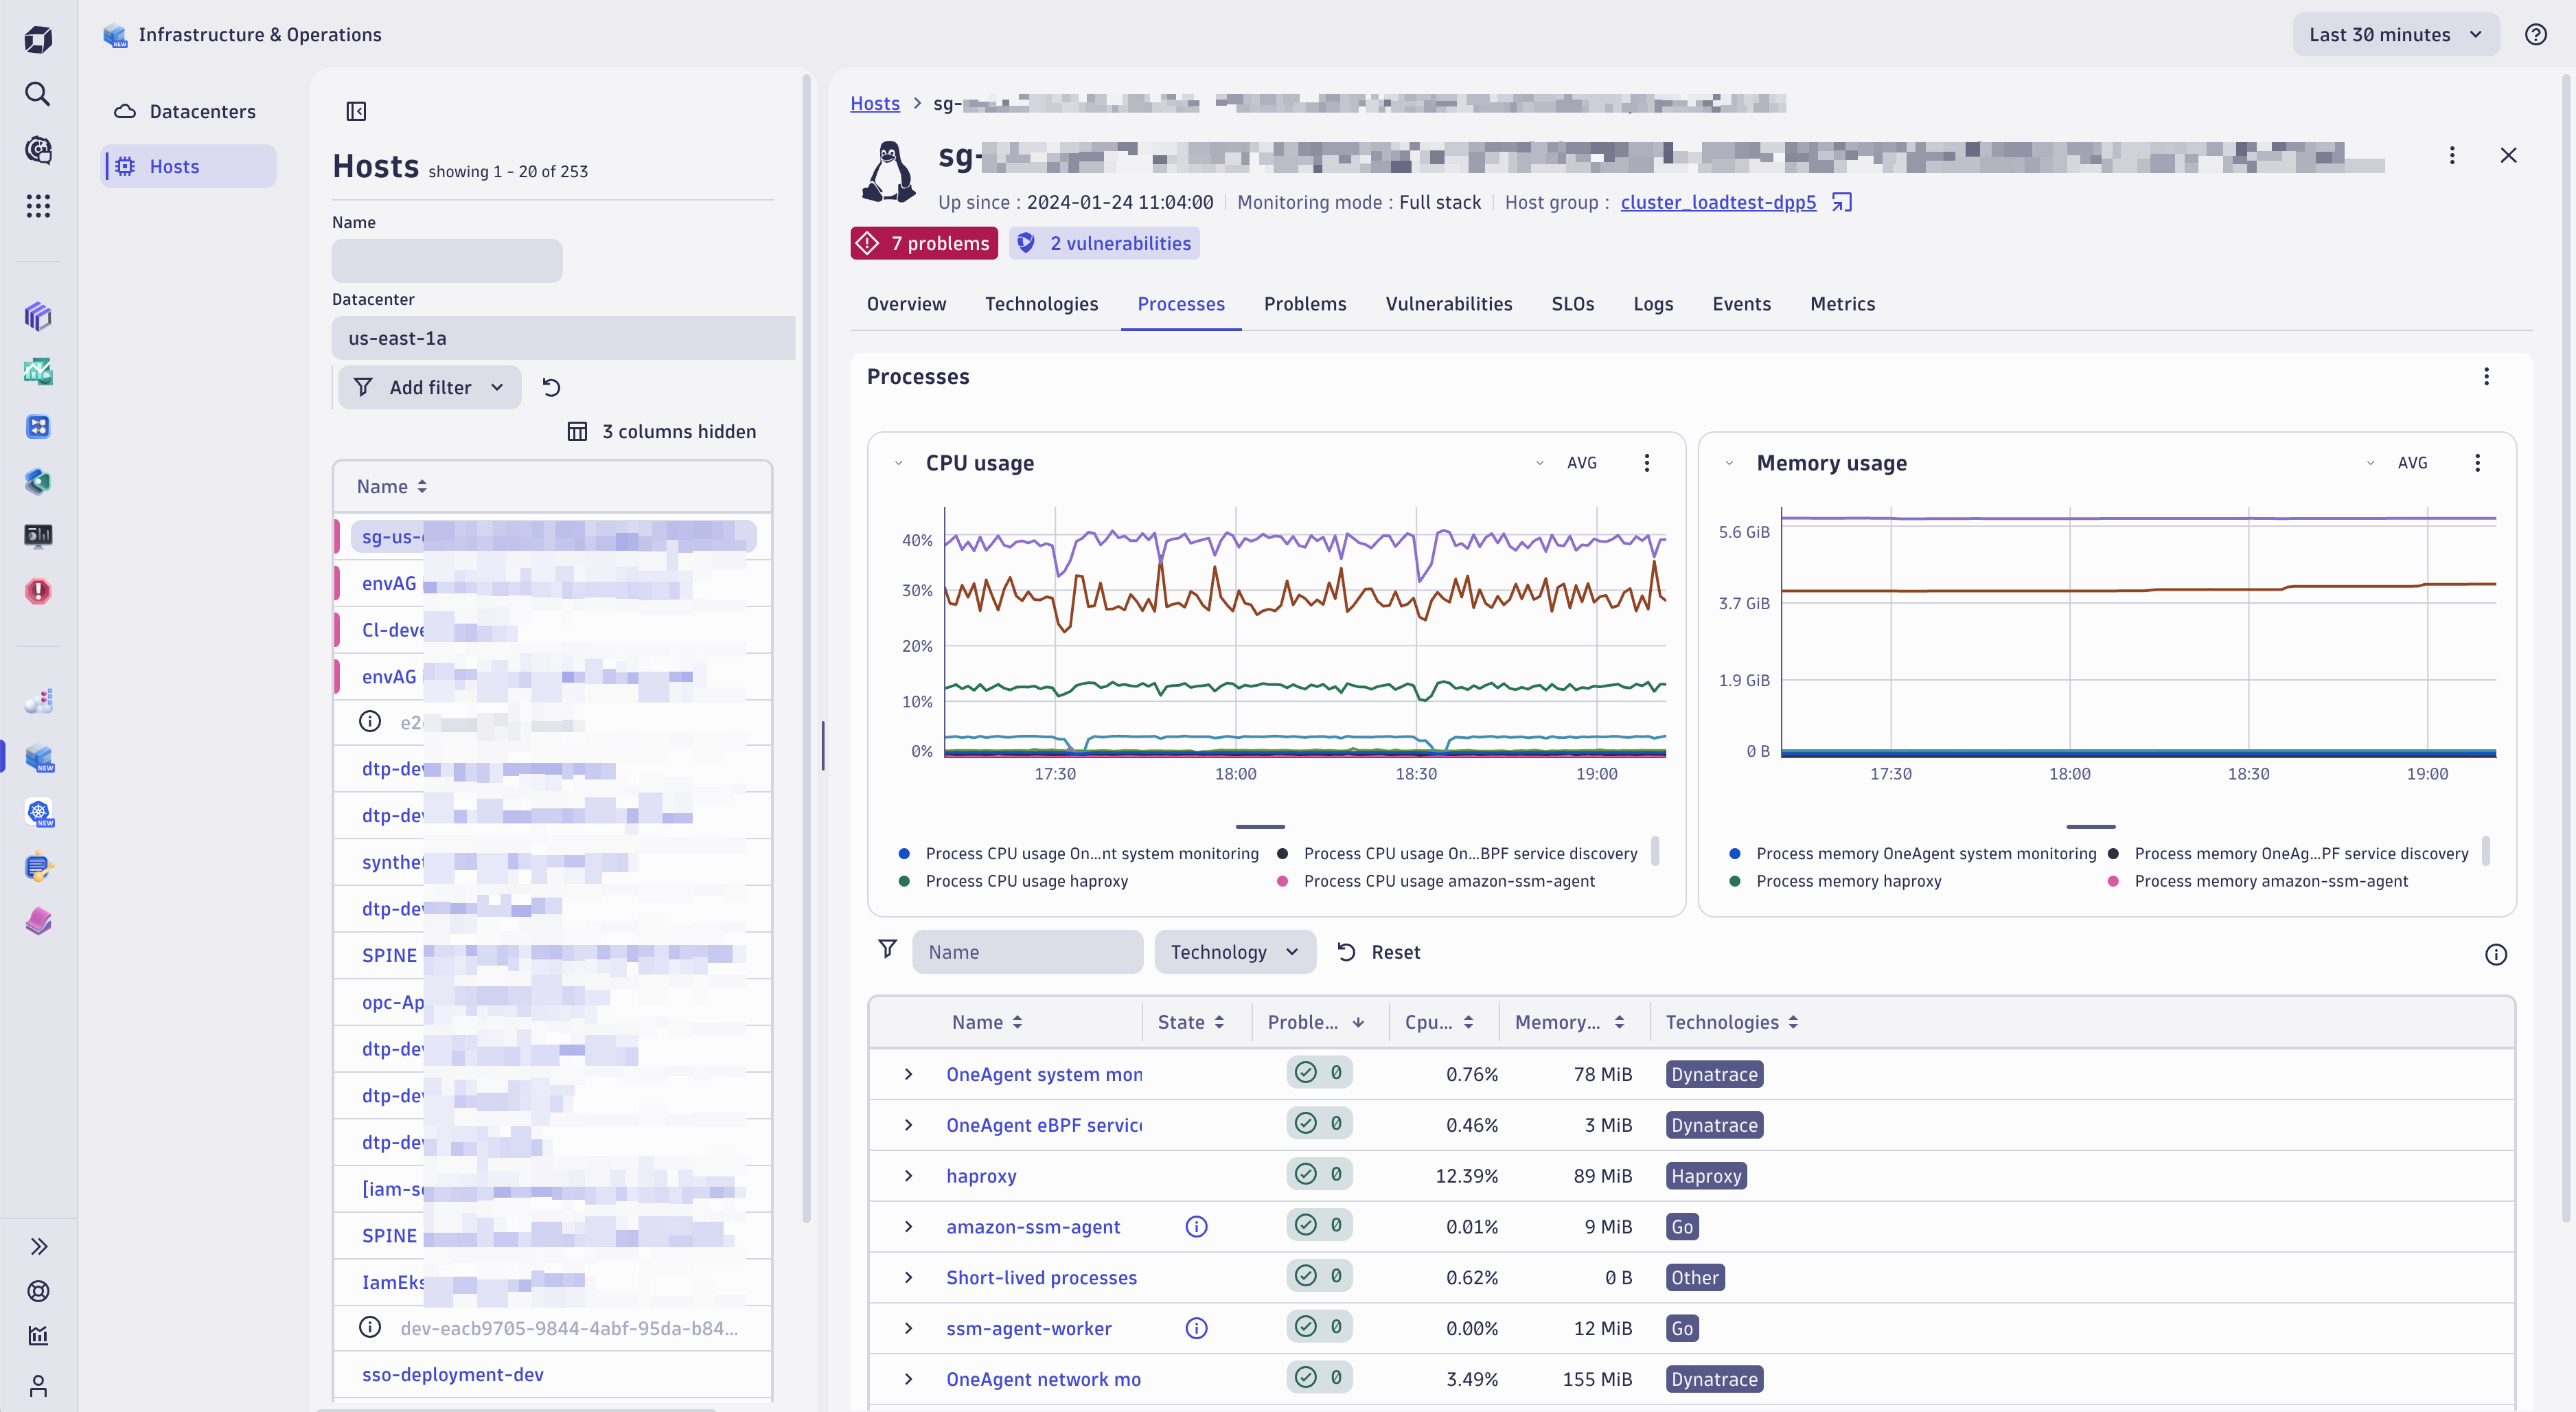
The process analysis page enables you to quickly identify problematic processes. Individual process metrics for each critical process and combined metrics make analysis more accessible and faster. The ability to sort by technology, CPU usage, and memory usage combined with process state display gives you complete process observability.
Gone are the days of toggling between multiple tools and sifting through disjointed data. Customers can now see all data required on the level of data centers and hosts in context, providing a comprehensive overview of how each one affects overall system health.
Start using the app now
Start enhancing your monitoring capabilities today by setting up Dynatrace OneAgent® or by integrating your cloud infrastructure. For the most granular metrics and network insights, OneAgent is the optimal choice.
Start using the Infrastructure & Operations app now to assess the health of your system. Embrace proactive monitoring with Dynatrace to keep your IT environment performing at its best.
What’s next?
Dynatrace is constantly improving the Infrastructure & Operations app to make it even more powerful. Some of the upcoming enhancements to the app include the following:
- Topological presentation of problematic entities and their relationships
- Mini dashboards at the data center level
- More detailed host analytics, including OS services
- More detailed networking observability tools
Embrace the opportunity to explore the Dynatrace Infrastructure & Operations application and let your voice be heard. Join us on our community channel and be a part of shaping the future of the Infrastructure & Operations app.


Looking for answers?
Start a new discussion or ask for help in our Q&A forum.
Go to forum