
In the first blog post of this series, we explored how the Dynatrace® observability and security platform boosts the reliability of Site Reliability Engineers (SRE) CI/CD pipelines and enhances their ability to focus on innovation. This blog post guides you through configuring Dynatrace to automate CI/CD processes to achieve these objectives.
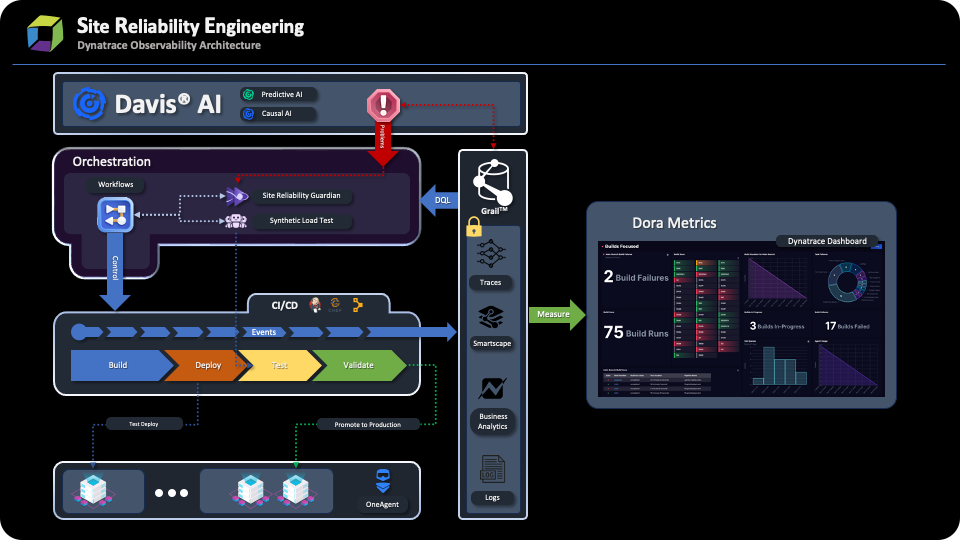
Dynatrace observability architecture can be classified into three layers:
- Orchestration (Dynatrace)
- CI/CD toolset (Jenkins / Chef / Puppet / Bamboo, etc.)
- Infrastructure layer (Kubernetes Cluster, GCP, Standalone server, etc.)
A conventional pipeline has the following stages:
- Build
- Deploy
- Test
- Validation
Now, let’s explore the challenges that arise in the different stages of the pipeline and examine how the role of Dynatrace as the orchestrator can contribute to overcoming these challenges. In this blog post, we’ll focus on the first stage of the pipeline, the Build stage.
Build stage
The build stage involves pulling the latest code, compiling it, and ensuring its proper functionality by running feature tests.
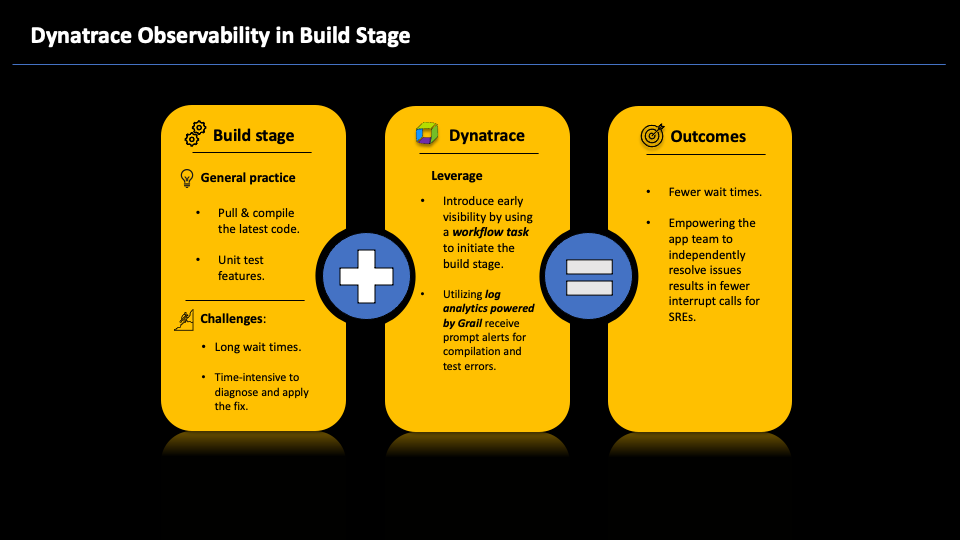
Mitigate challenges
While the application is building, you might see compilation problems that necessitate debugging, and there might be considerable delay before the root causes of such issues are identified. The build process must be restarted once a solution is identified and deployed. A high rate of build failures indicates that the team is investing significant time into diagnosing and rectifying issues. This waiting and problem-solving can hinder your overall software development process.
Enhancing visibility during the build stage can help identify compilation and integration errors earlier in the development cycle. This proactive approach reduces wait times and allows SREs to redirect their efforts toward innovation.
Leverage Dynatrace features
The instrumentation flow currently operates as follows:
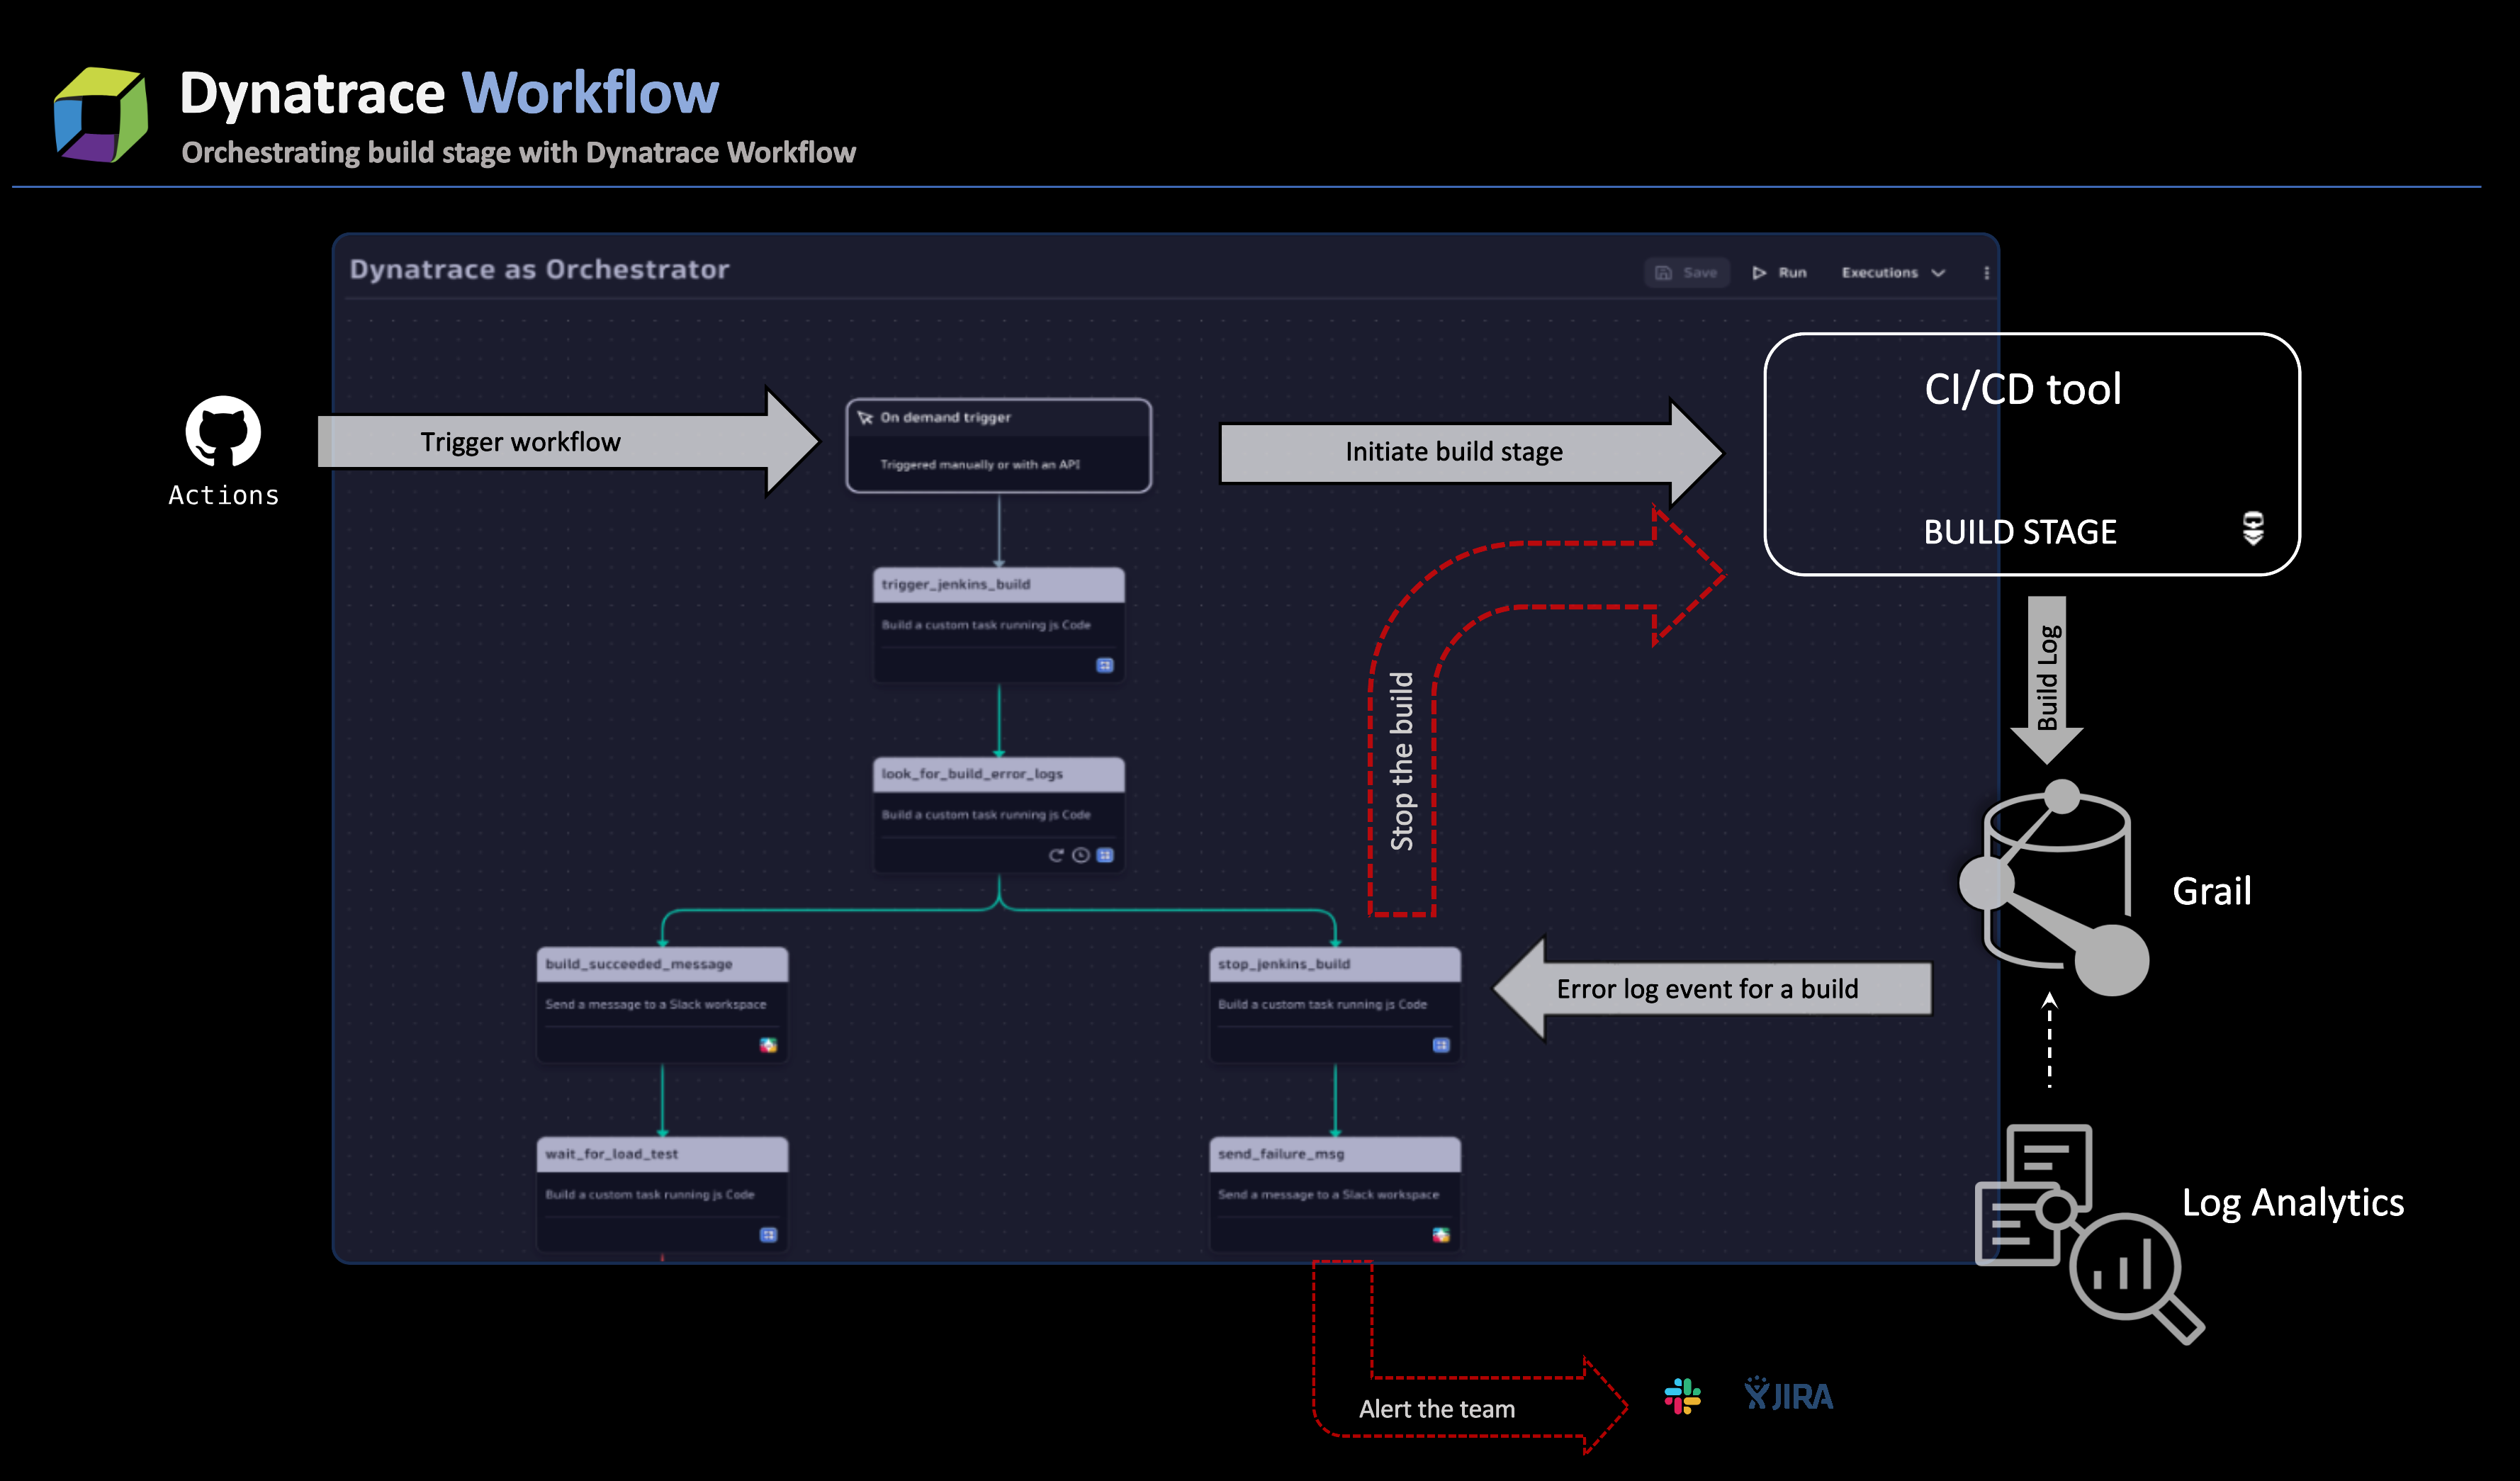
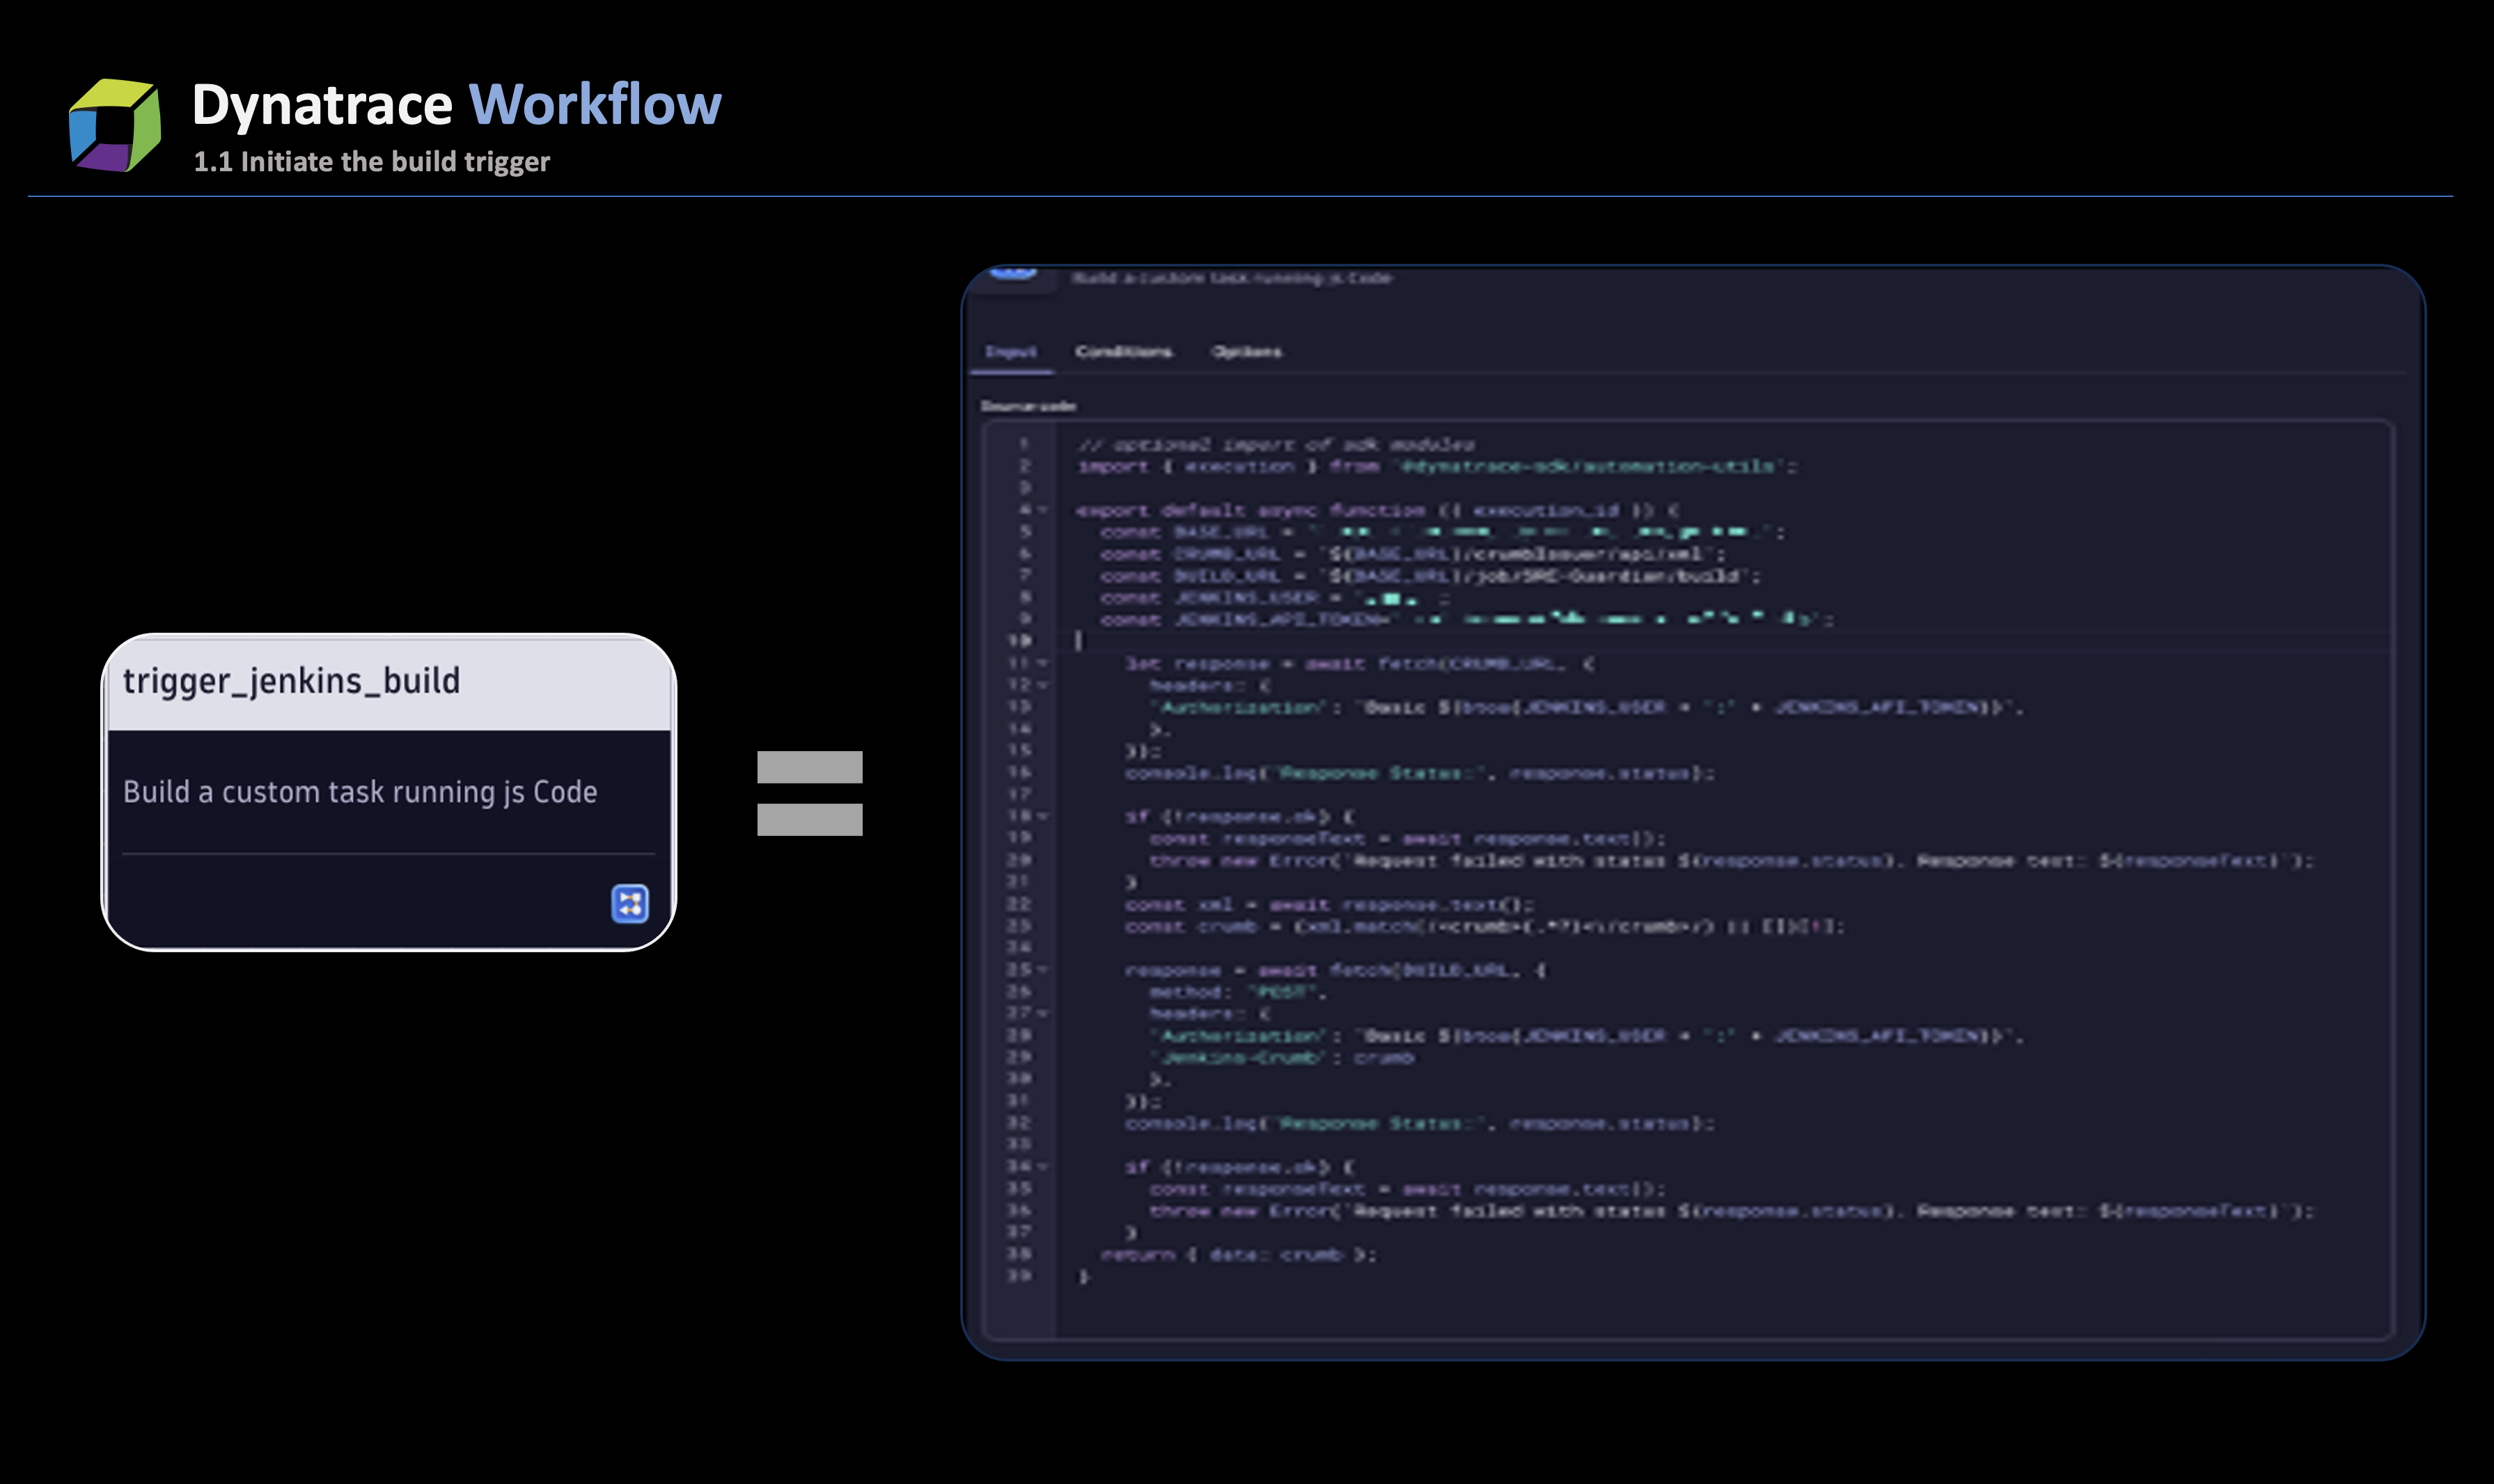
- After code commits, a GitHub action is employed to trigger the workflow, utilizing the workflow API. Within this workflow, a designated task, powered by JavaScript, initiates the build stage of the pipeline job, commencing a new build. The below screenshot shows the code initiating the Jenkins job.
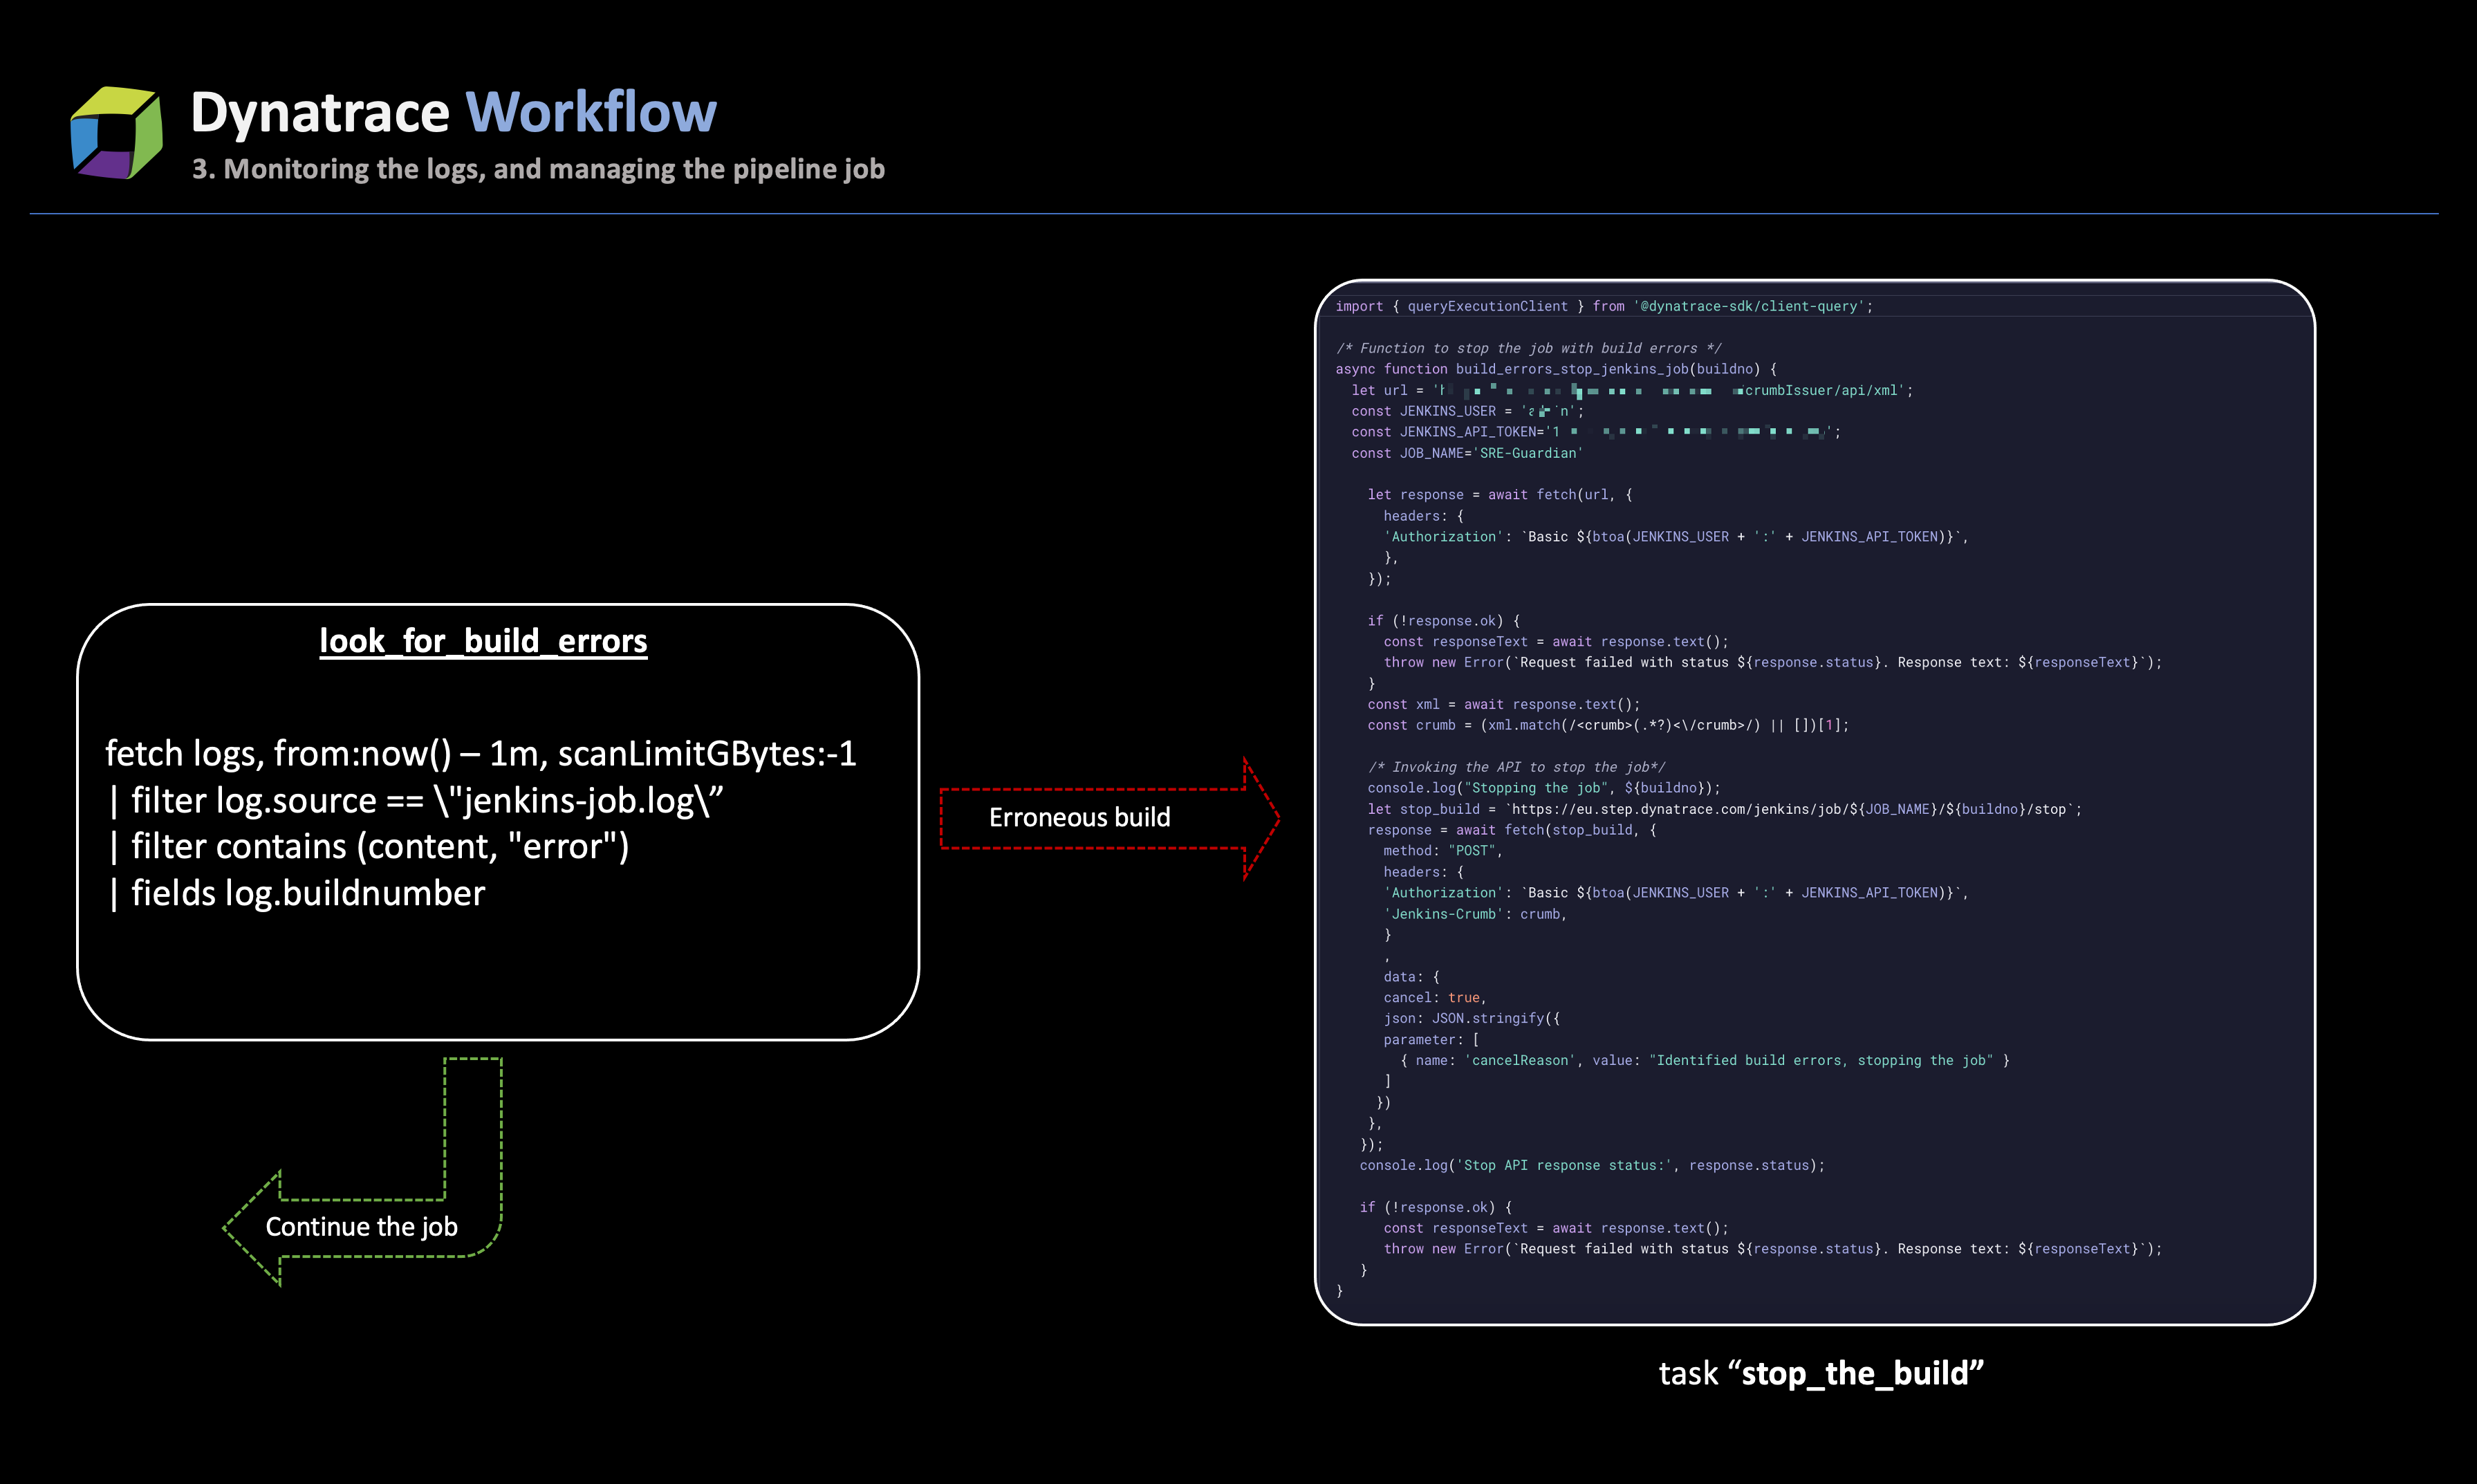
- During the job pipeline execution, logs are extracted and pushed to Grail. Log reading can be facilitated by installing OneAgent or employing a log ingestion system to ingest the logs into Dynatrace. Subsequently, a workflow DQL task named
look_for_build_errorswill scrutinize the build stage for errors. - Based on the outcome of the log analysis, one of two paths is pursued:
- If build errors are detected
Should the job logs reveal errors, the task promptly flags the build as erroneous and initiates the process to halt the ongoing job. The taskstop_the_jenkins_jobleverages the CI/CD API (in this case, Jenkins) to stop the build, as indicated in the output from step 2. This task also extracts additional job metadata to incorporate in the generated alert.
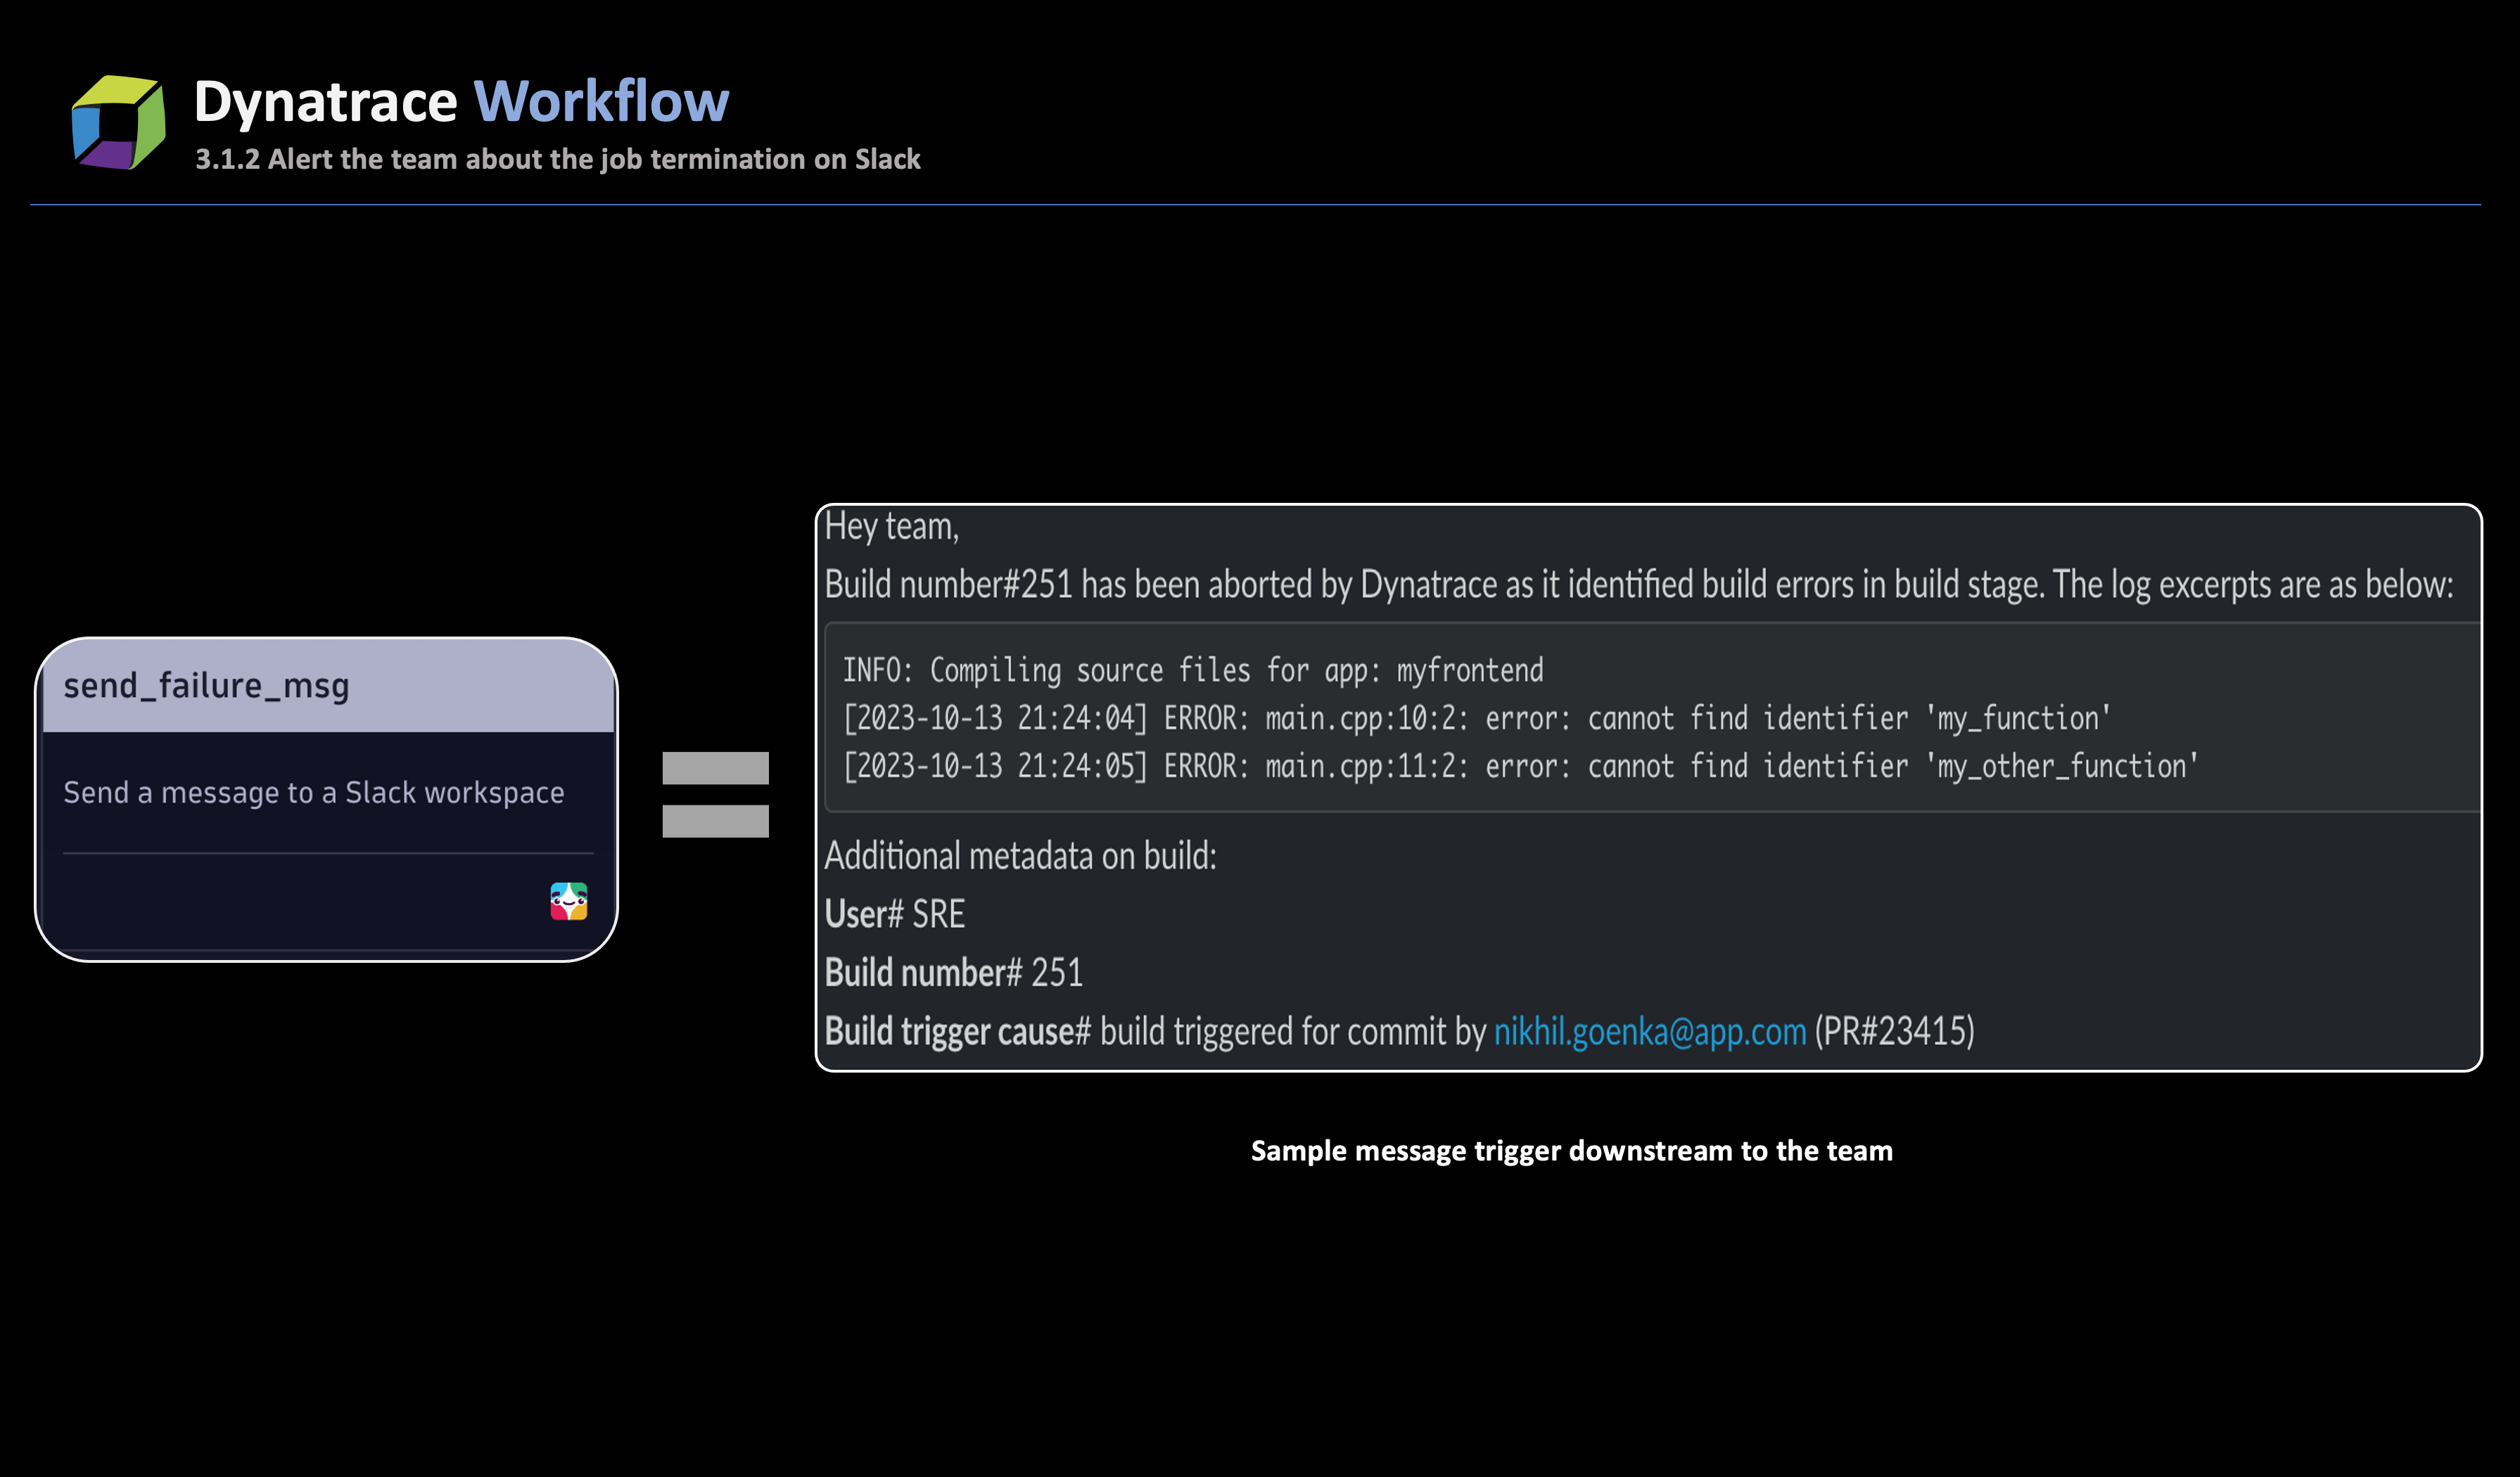
In tandem with stopping the job, another task in the workflow,send_alert_to_team, activates, sending a Slack message to the team responsible for initiating the job. The immediate alerting mechanism ensures that SREs are promptly informed about build errors, thereby circumventing high wait times.
- If no errors are detected
If no errors are identified, the workflow seamlessly advances the job to the Deploy stage. As a good practice, we recommend that you incorporate a workflow with a JavaScript task that periodically retrieves job details and ingests them as business events to enhance visibility into the pipeline stages and provide insights into current trends.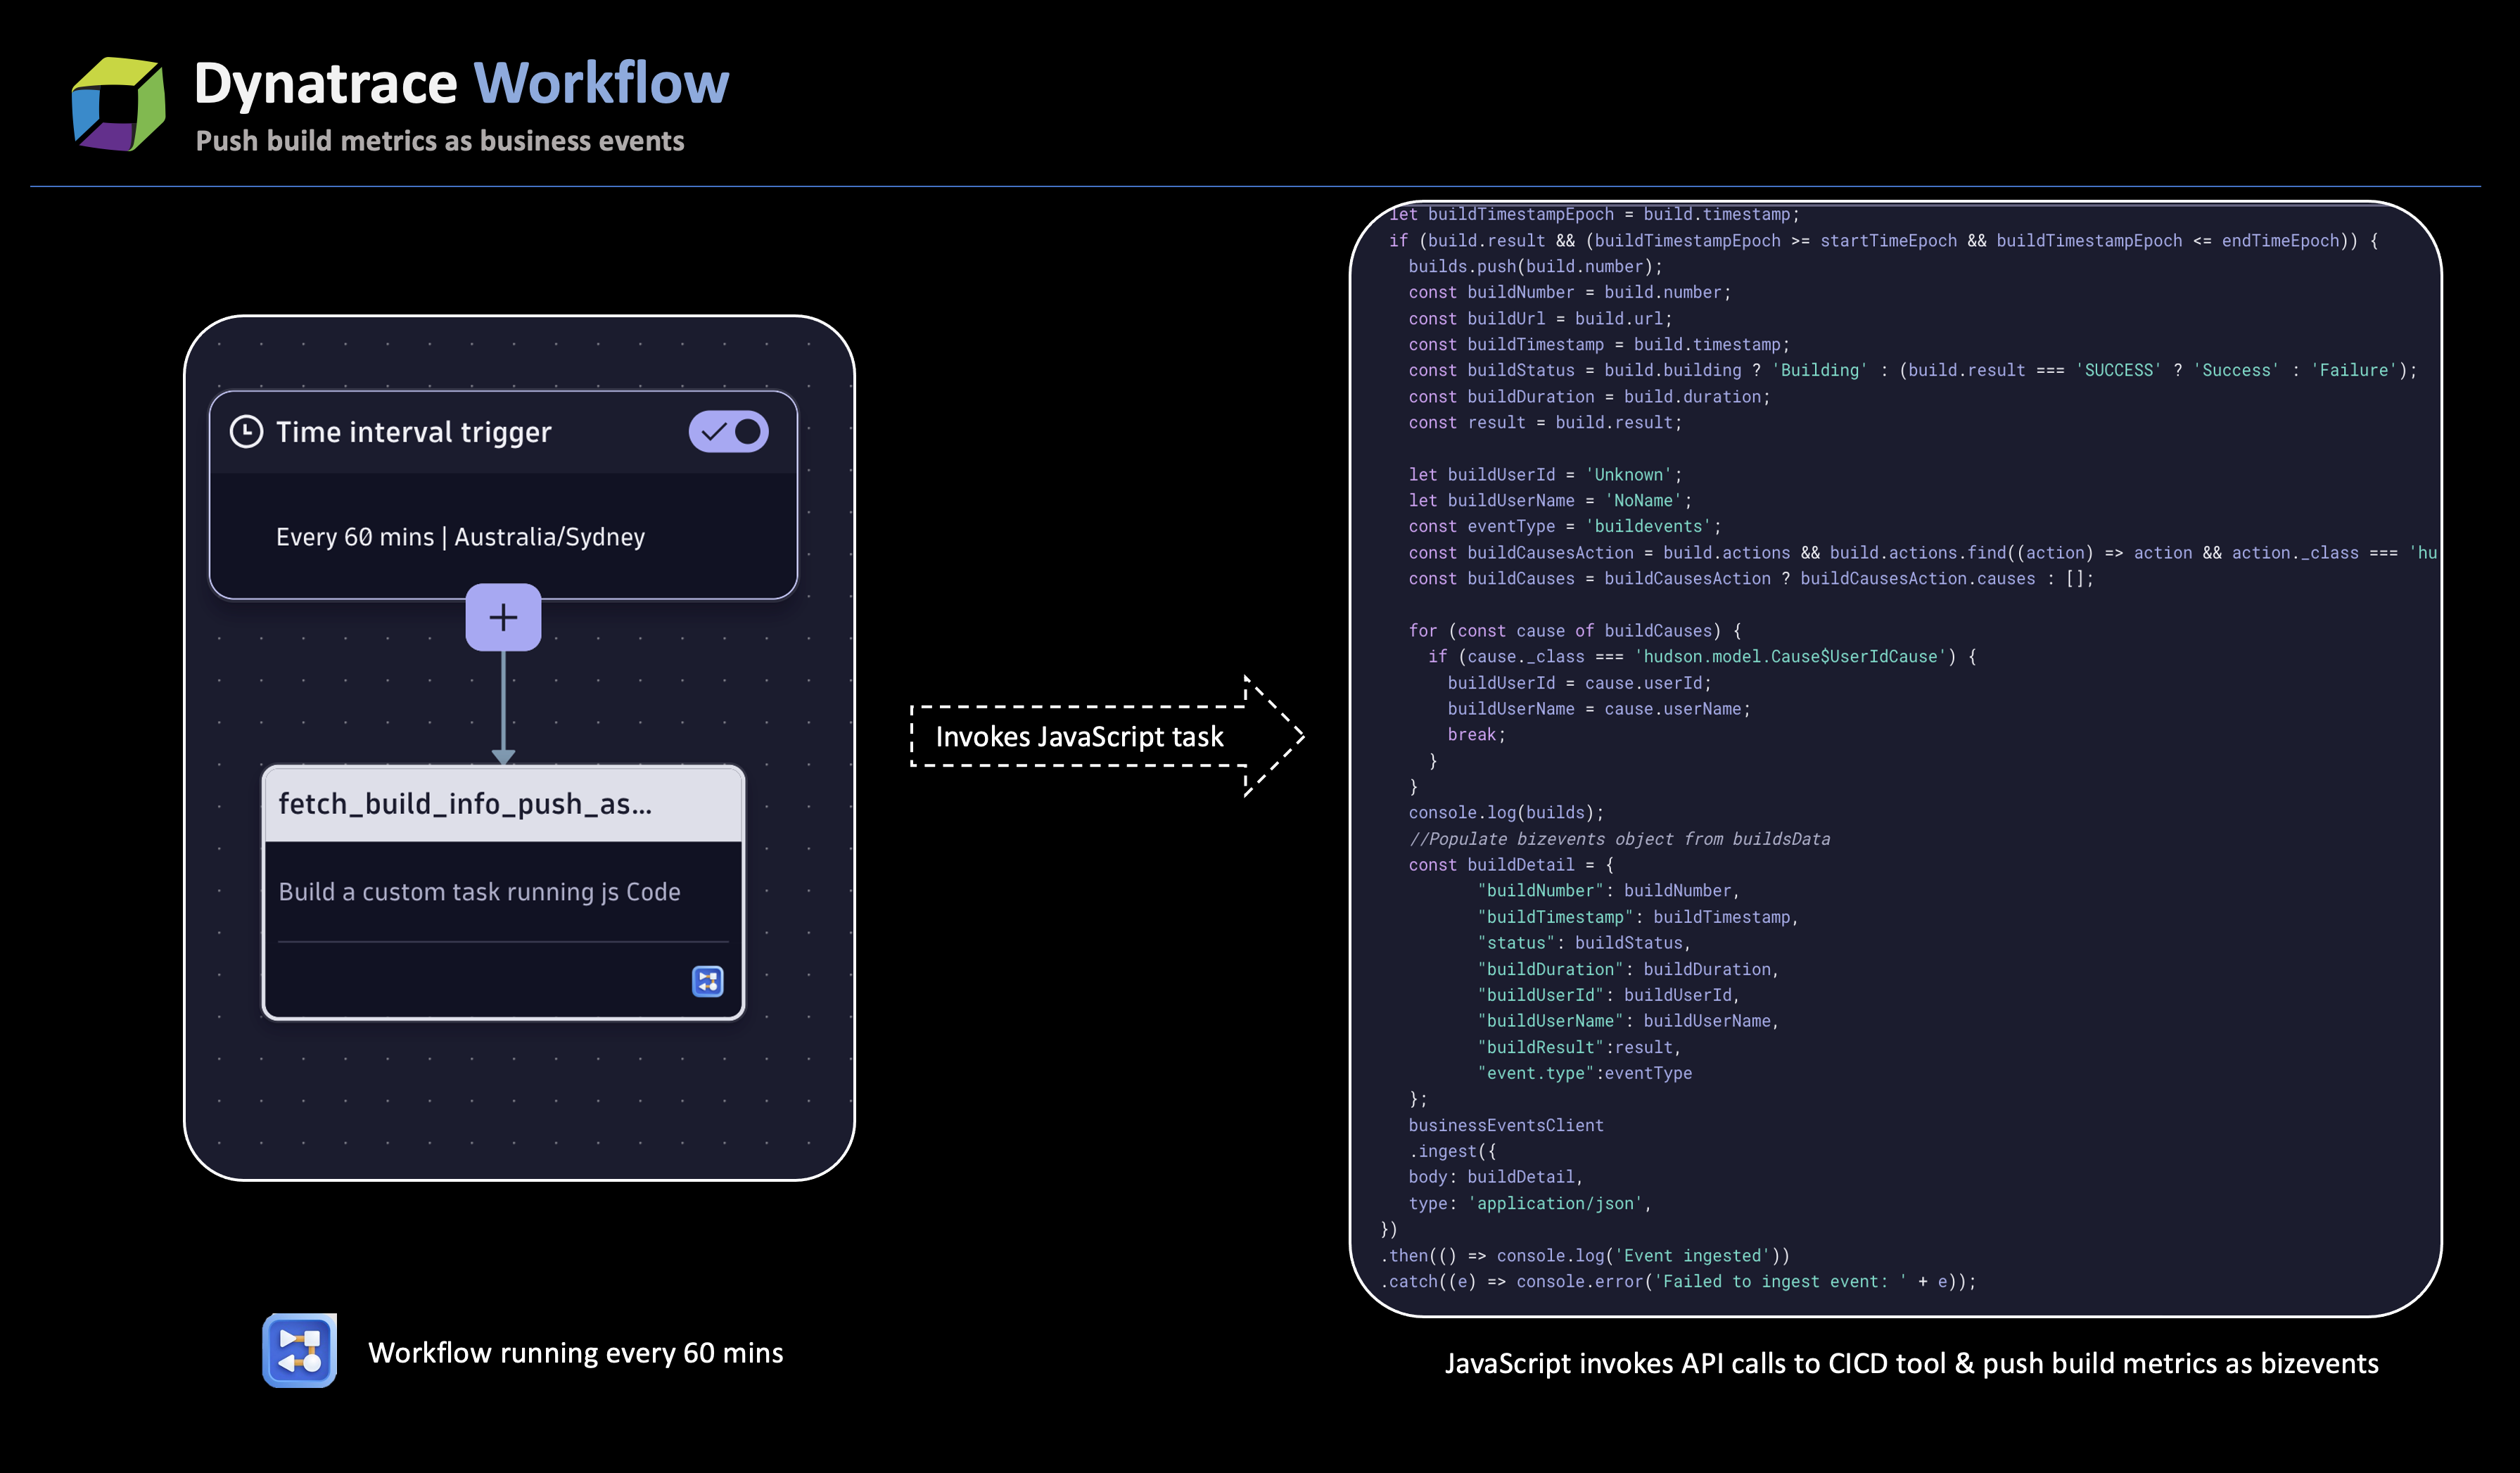
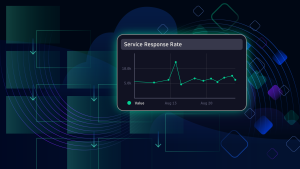
Above is a sample JavaScript workflow that extracts data from the Jenkins pipeline via API calls and the dashboard capturing current trends.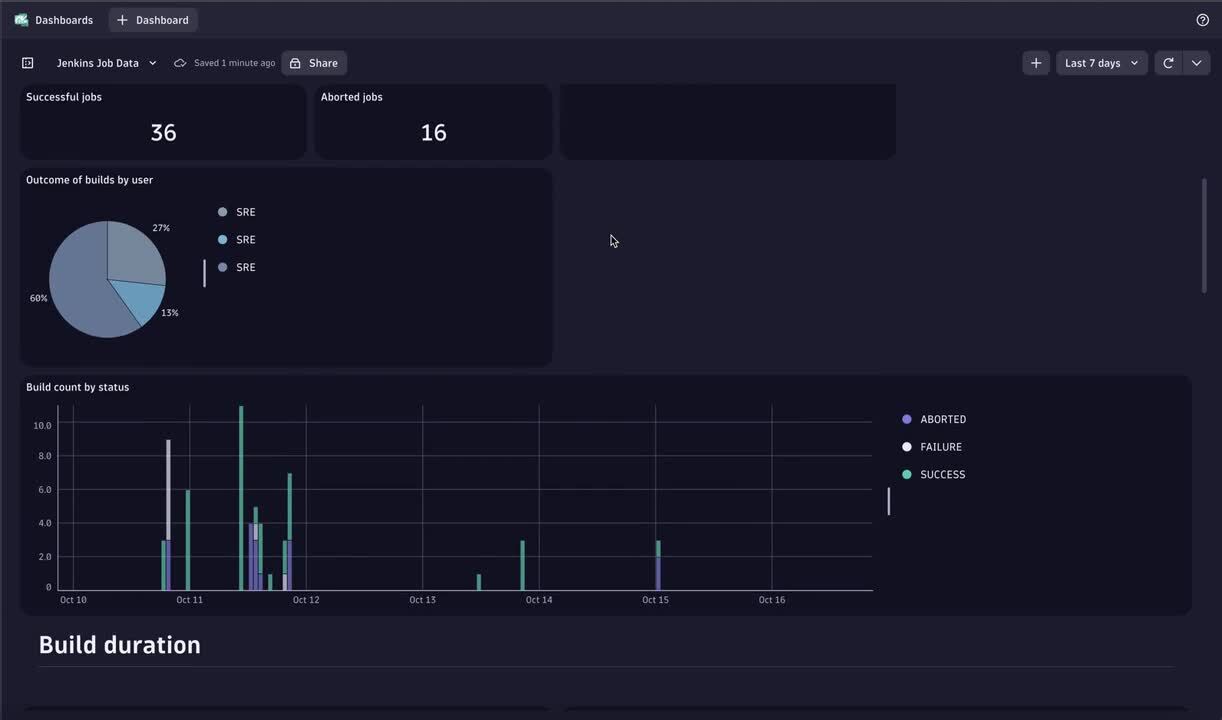 The Jenkins Build Stage Insights dashboard provides visualizations of the build stages represented as business events.
- If build errors are detected
Build stage orchestration in a platform engineering context
In the realm of platform engineering, the focus is on relieving the cognitive burden on development teams and boosting their efficiency by offering predefined pathways, essentially treating the development platform as a product.
With build-log monitoring and the initiation of diverse workflows within Dynatrace based on log outcomes, automation is now a reality for many development teams. Furthermore, the insights gained from the build stage provide SREs and app teams with valuable information for optimizing existing pipelines and areas for improvement.
What’s next
Now, it should be clear how Dynatrace orchestration can be introduced early in the pipeline process and how it can significantly decrease wait times during the build stage by notifying the teams of any errors during the application build process.
In the next blog post in this series, we’ll delve into how this orchestration further aids SRE teams in addressing the challenges encountered during the Deploy stage.
All the resources you need to set up Dynatrace as a build-stage orchestrator
In the meantime, you’ll find all the resources you need to set up Dynatrace as a build-stage orchestrator (workflows, JavaScript tasks, and the referenced dashboard) in this Git repository.


Looking for answers?
Start a new discussion or ask for help in our Q&A forum.
Go to forum