
Rapid Kubernetes adoption is driven—and challenged by—a growing ecosystem of advanced technologies. In this Kubernetes survey report, learn how top organizations use Kubernetes and related technologies in production, including observability, security, infrastructure models, and open source software.
Kubernetes adoption survey executive summary
Modern, cloud-native computing is impossible to separate from containers and Kubernetes adoption. While Kubernetes is still a relatively young technology, a large majority of global enterprises use it to run business-critical applications in production. The rapid adoption is driven—and challenged by—an ever-growing ecosystem of Kubernetes technologies that add advanced platform features, such as security, microservice communications, observability, scaling, resource utilization, and so on.
This Kubernetes survey shows how organizations actually use Kubernetes in production. The study analyzes factual Kubernetes production data from thousands of organizations worldwide that are using the Dynatrace Software Intelligence Platform to keep their Kubernetes clusters secure, healthy, and high performing.
Findings provide insights into Kubernetes practitioners’ infrastructure preferences and how they use advanced Kubernetes platform technologies. The report also reveals the leading programming languages practitioners use for application workloads. As Kubernetes adoption increases and it continues to advance technologically, Kubernetes has emerged as the “operating system” of the cloud.
- Kubernetes moved to the cloud in 2022
- Kubernetes infrastructure models differ between cloud and on-premises
- Kubernetes is emerging as the “operating system” of the cloud
- The strongest Kubernetes growth areas are security, databases, and CI/CD technologies
- Open-source software drives a vibrant Kubernetes ecosystem
- Java, Go, and Node.js are the top 3 programming languages for Kubernetes application workloads

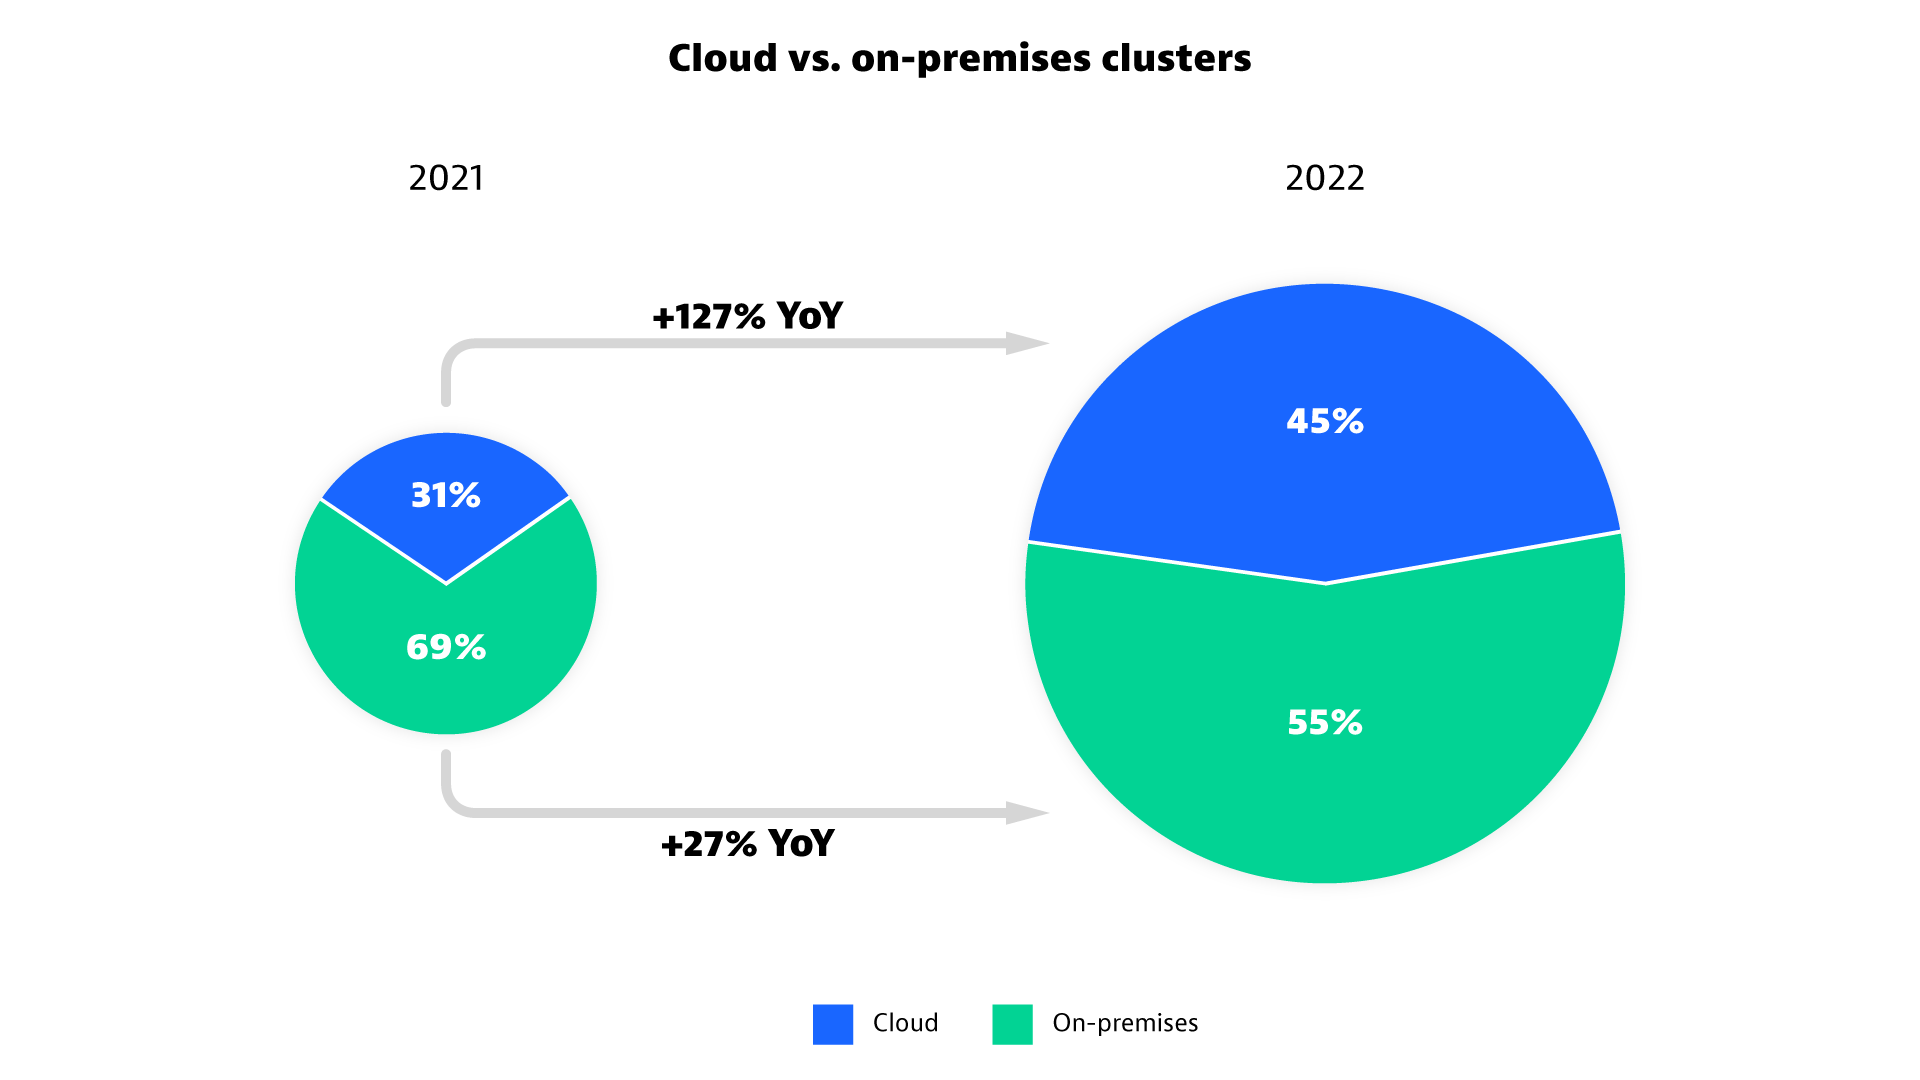
Kubernetes moved to the cloud in 2022
In 2022, Kubernetes became the key platform for moving workloads to the public cloud. At an annual growth rate of +127 percent, the number of Kubernetes clusters hosted in the cloud grew about five times as fast as clusters hosted on-premises. Likewise, the share of cloud-hosted clusters increased from 31% in 2021 to 45% in 2022. Cloud-hosted Kubernetes clusters are on par to overtake on-premises deployments in 2023.
Most Kubernetes clusters in the cloud (73%) are built on top of managed distributions from the hyperscalers like AWS Elastic Kubernetes Service (EKS), Azure Kubernetes Service (AKS), or Google Kubernetes Engine (GKE). Accordingly, the remaining 27% of clusters are self-managed by the customer on cloud virtual machines.
Kubernetes hosting decisions are guided by a set of parameters, including cost, ease of provisioning and scaling, data security, and regulatory compliance. As hyperscalers invest in all these areas and expand their presence into more geographic regions, they become more attractive to a broader set of organizations.

Kubernetes infrastructure models differ between cloud and on-premises
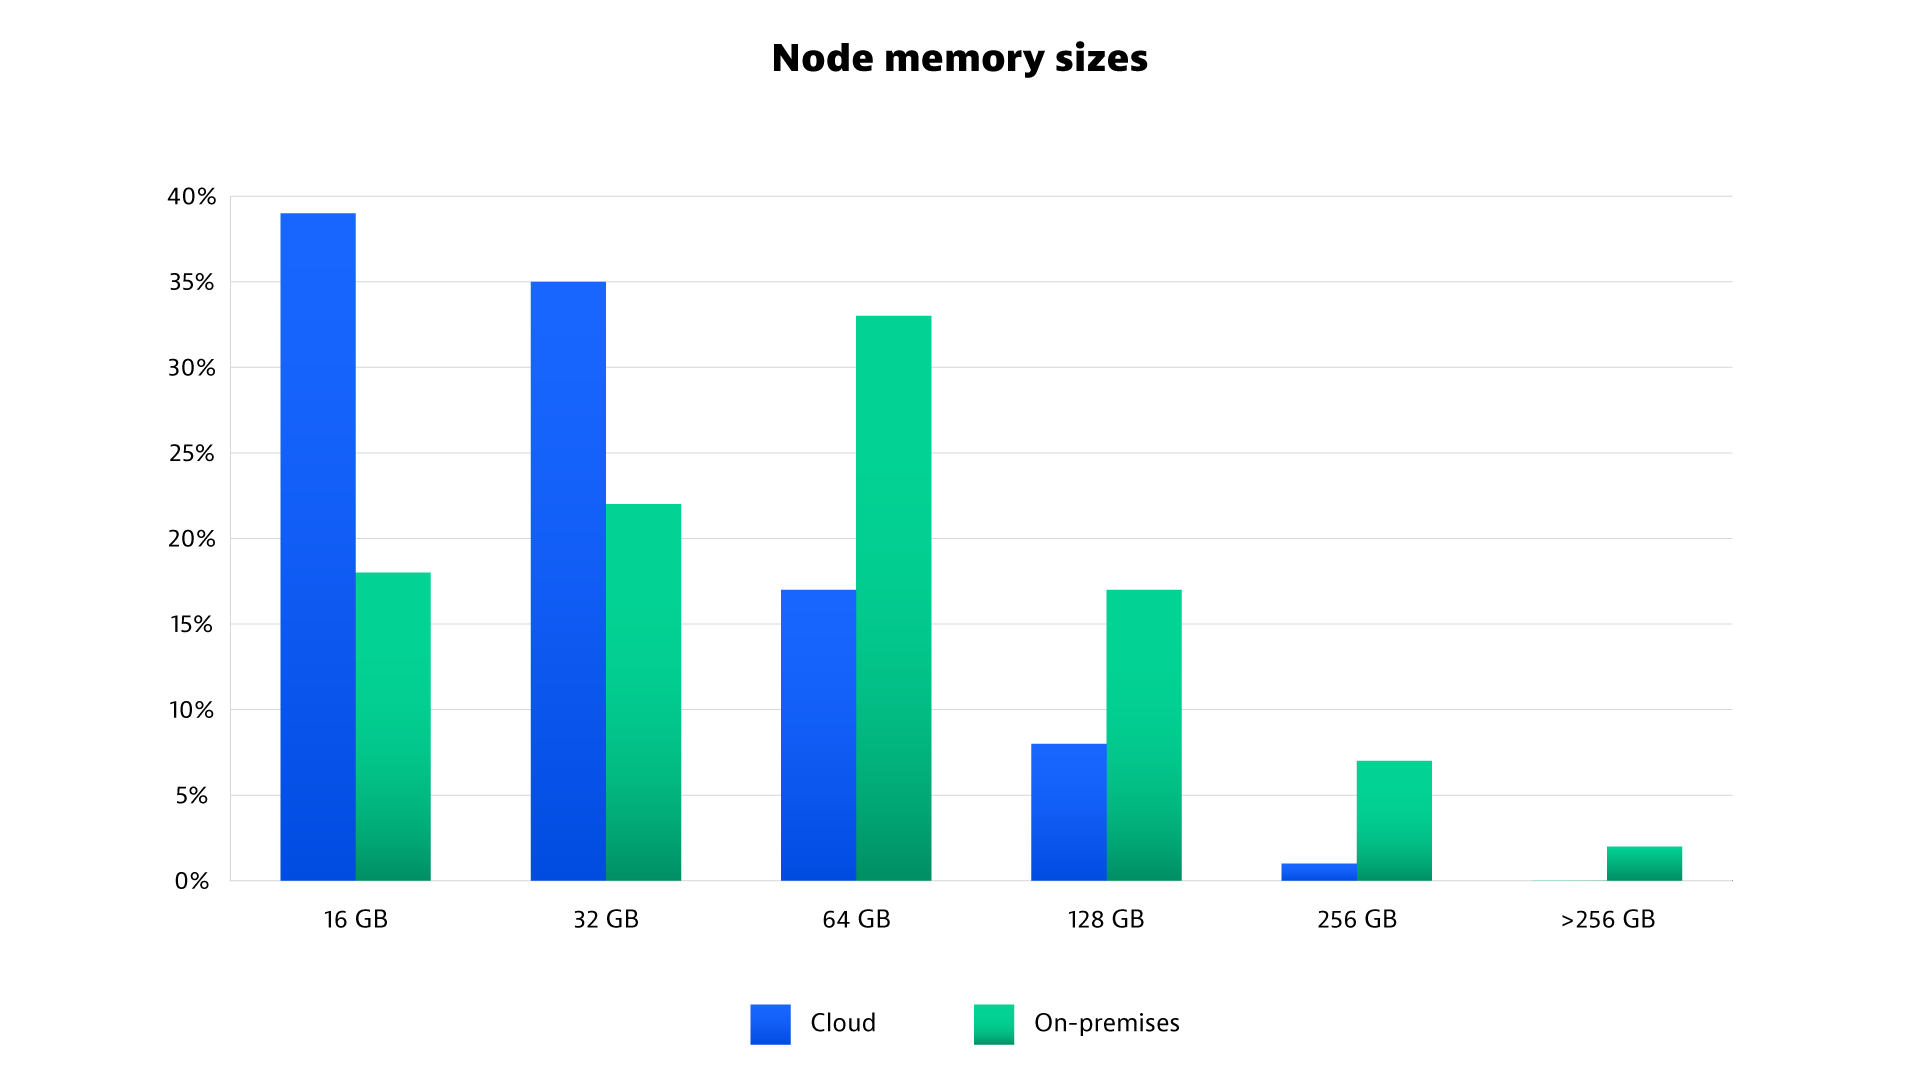
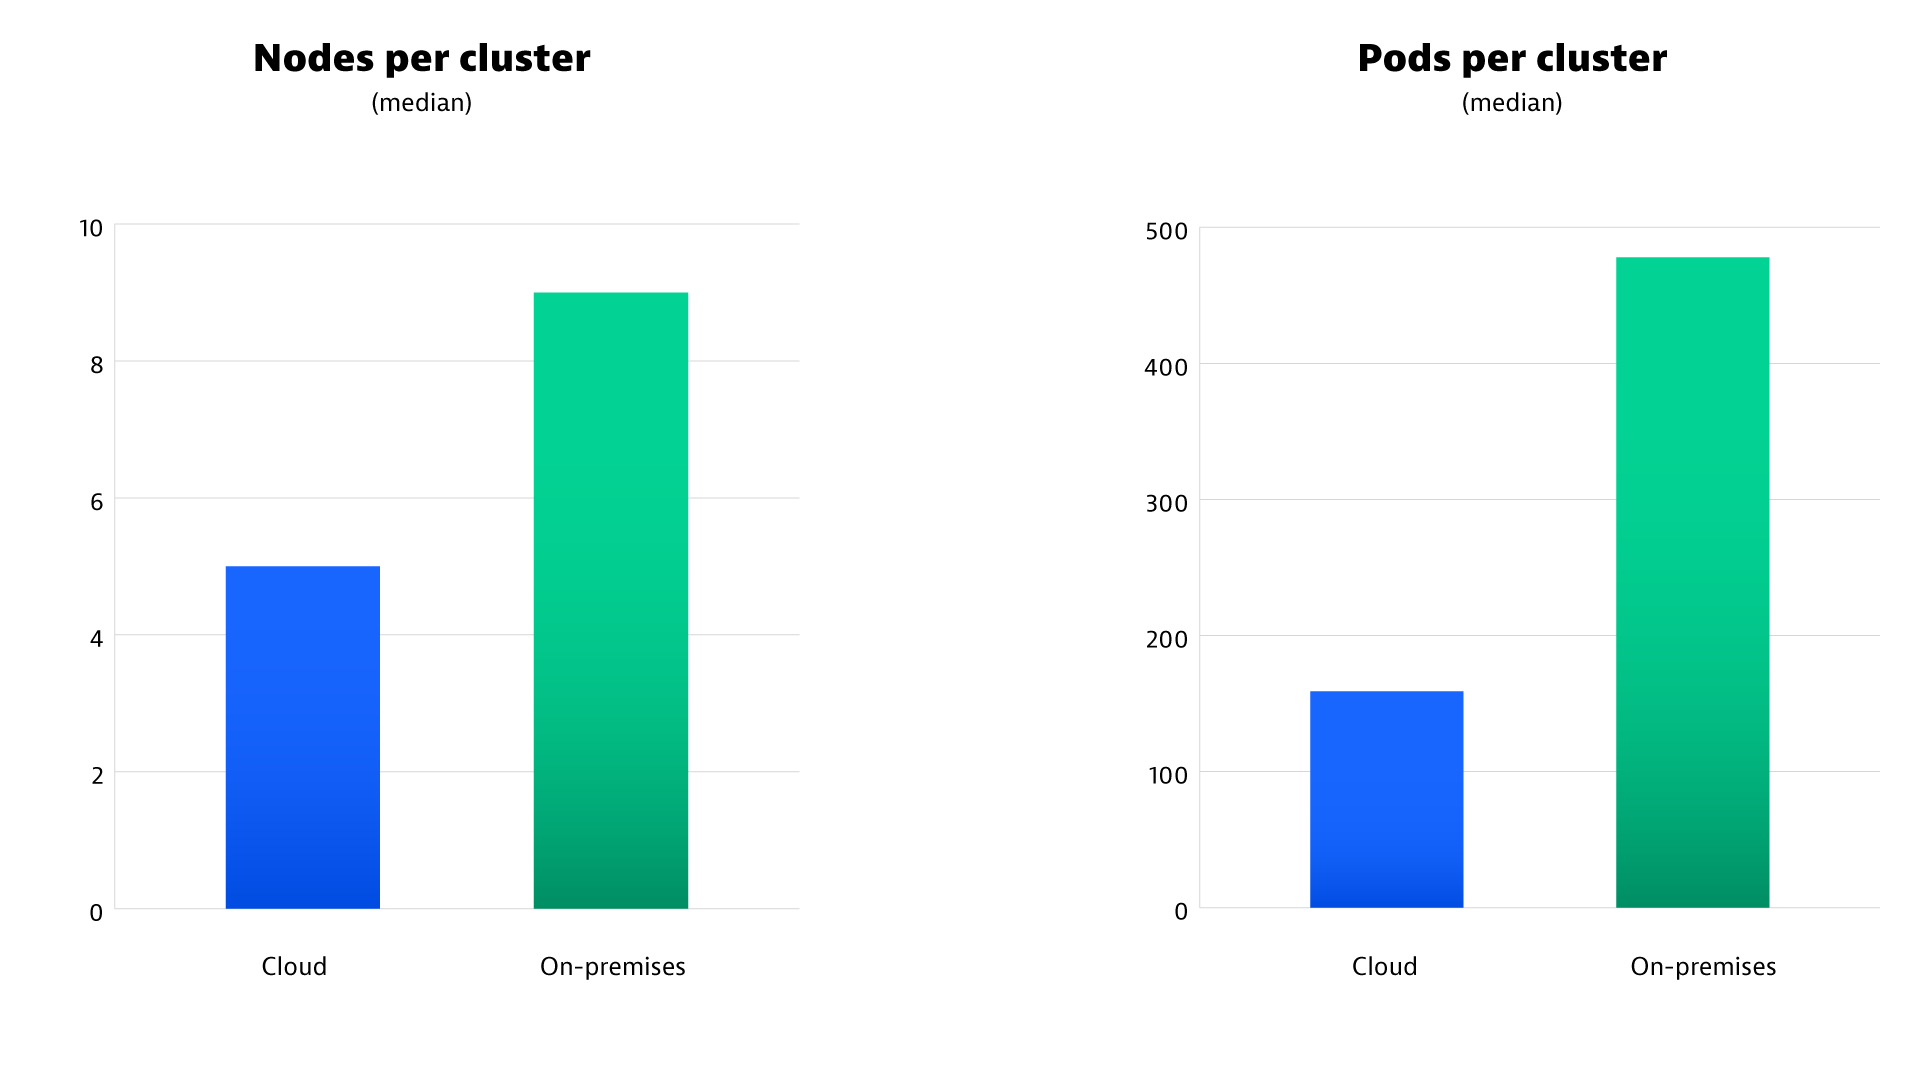
A typical cluster running in the public cloud consists of 5 relatively small nodes with just 16 to 32 GB of memory each. In comparison, on-premises clusters have more and larger nodes: on average, 9 nodes with 32 to 64 GB of memory.
The different infrastructure setup reflects economic and technical considerations. Hyperscalers offer a competitive price point for small to medium-sized hosts. Through effortless provisioning, a larger number of small hosts provide a cost-effective and scalable platform. On-premises data centers invest in higher capacity servers since they provide more flexibility in the long run, while the procurement price of hardware is only one of many cost factors.

Kubernetes is emerging as the “operating system” of the cloud
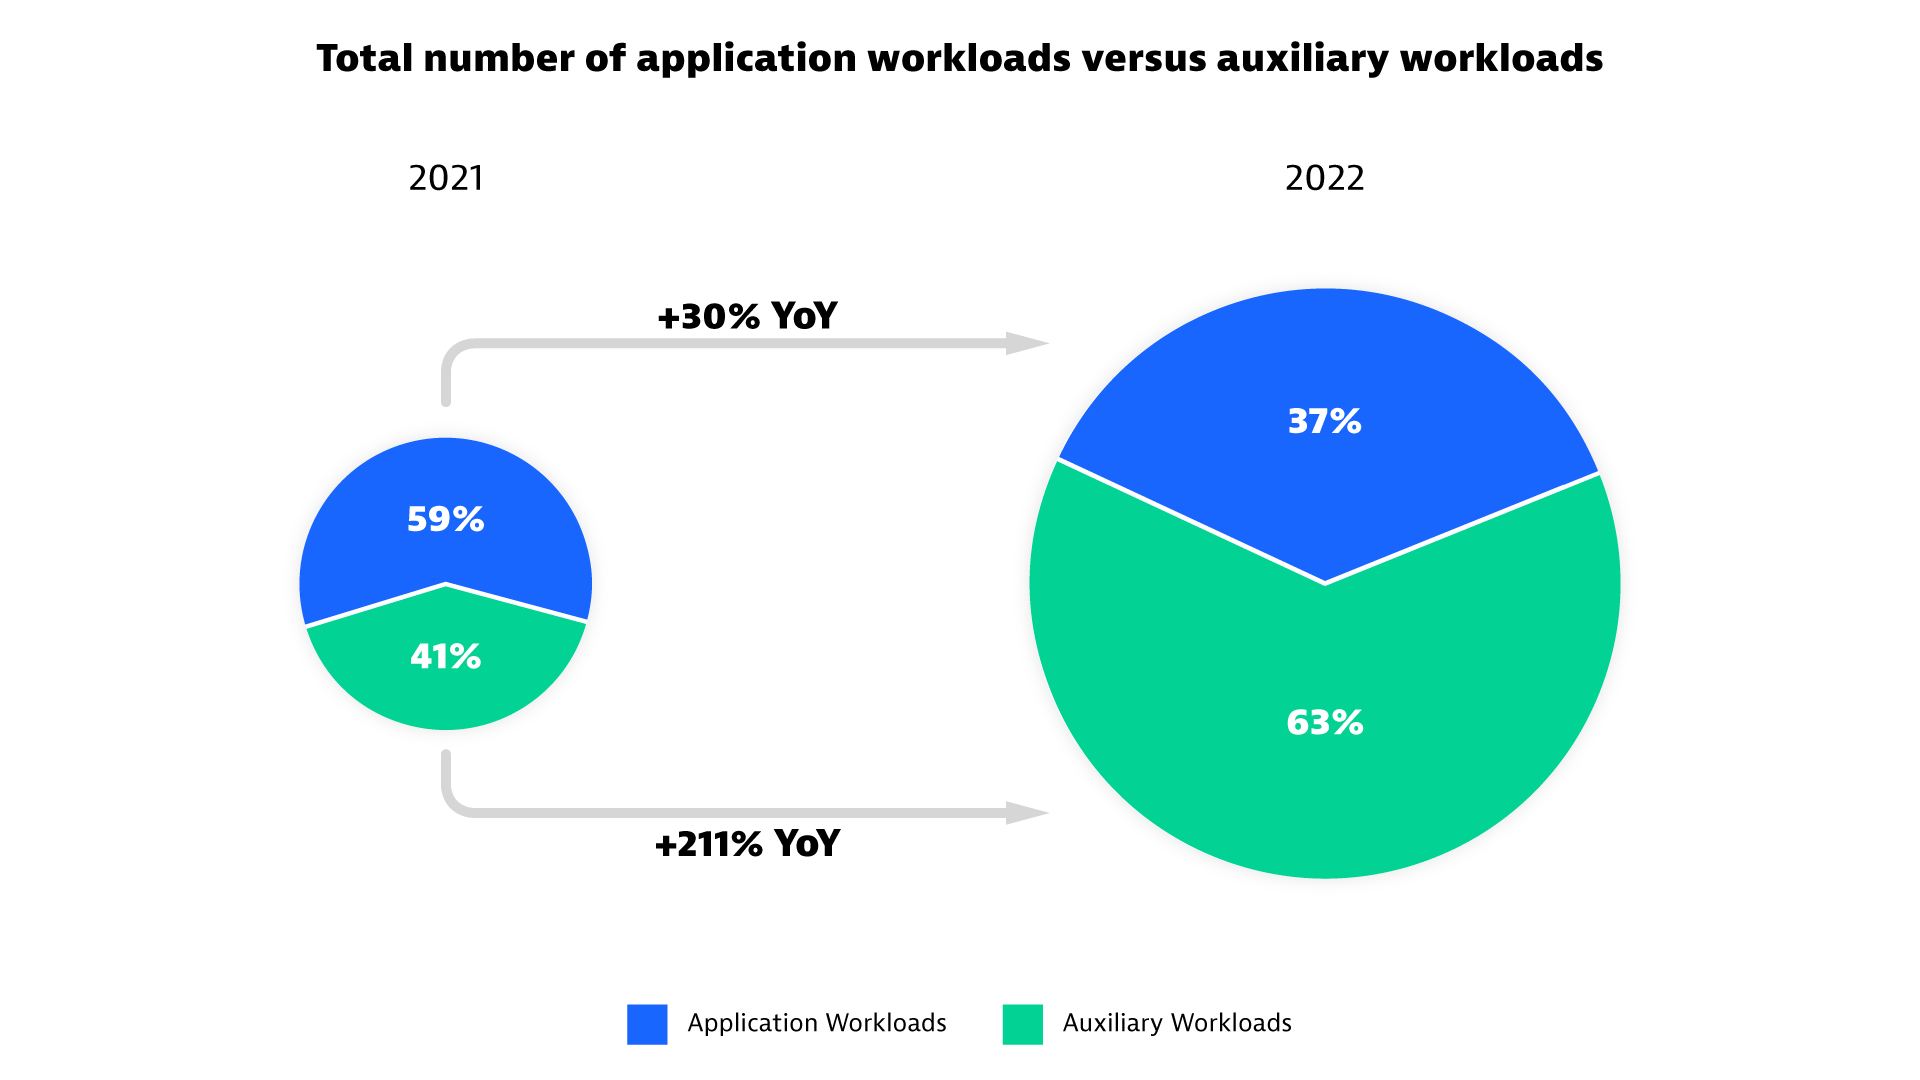
As the ideal orchestration platform for running cloud-native microservice applications, Kubernetes comes with the benefit of built-in deployment, scaling, and resiliency capabilities. In 2021, in a typical Kubernetes cluster, application workloads accounted for most of the pods (59%). By contrast, all non-application workloads, such as system and auxiliary workloads, played a relatively smaller part.
But in 2022, this picture reverses. As Kubernetes adoption has grown, auxiliary workloads now outnumber application workloads (63% vs. 37%). This switch reflects that organizations are implementing more advanced Kubernetes platform technologies such as security controls, service meshes, messaging systems, and observability tools. At the same time, organizations are using Kubernetes for a broader range of use cases, including build pipelines and scheduled utility workloads, among others. Kubernetes becomes the platform for running almost anything. As such, Kubernetes is emerging as the “operating system” of the cloud.
“At Dynatrace, we use Kubernetes for any new software project, from build pipelines to SaaS offerings. We also see the same trend with our customers. Kubernetes effectively has emerged as the operating system for the cloud.”
Anita Schreiner, Dynatrace VP Delivery

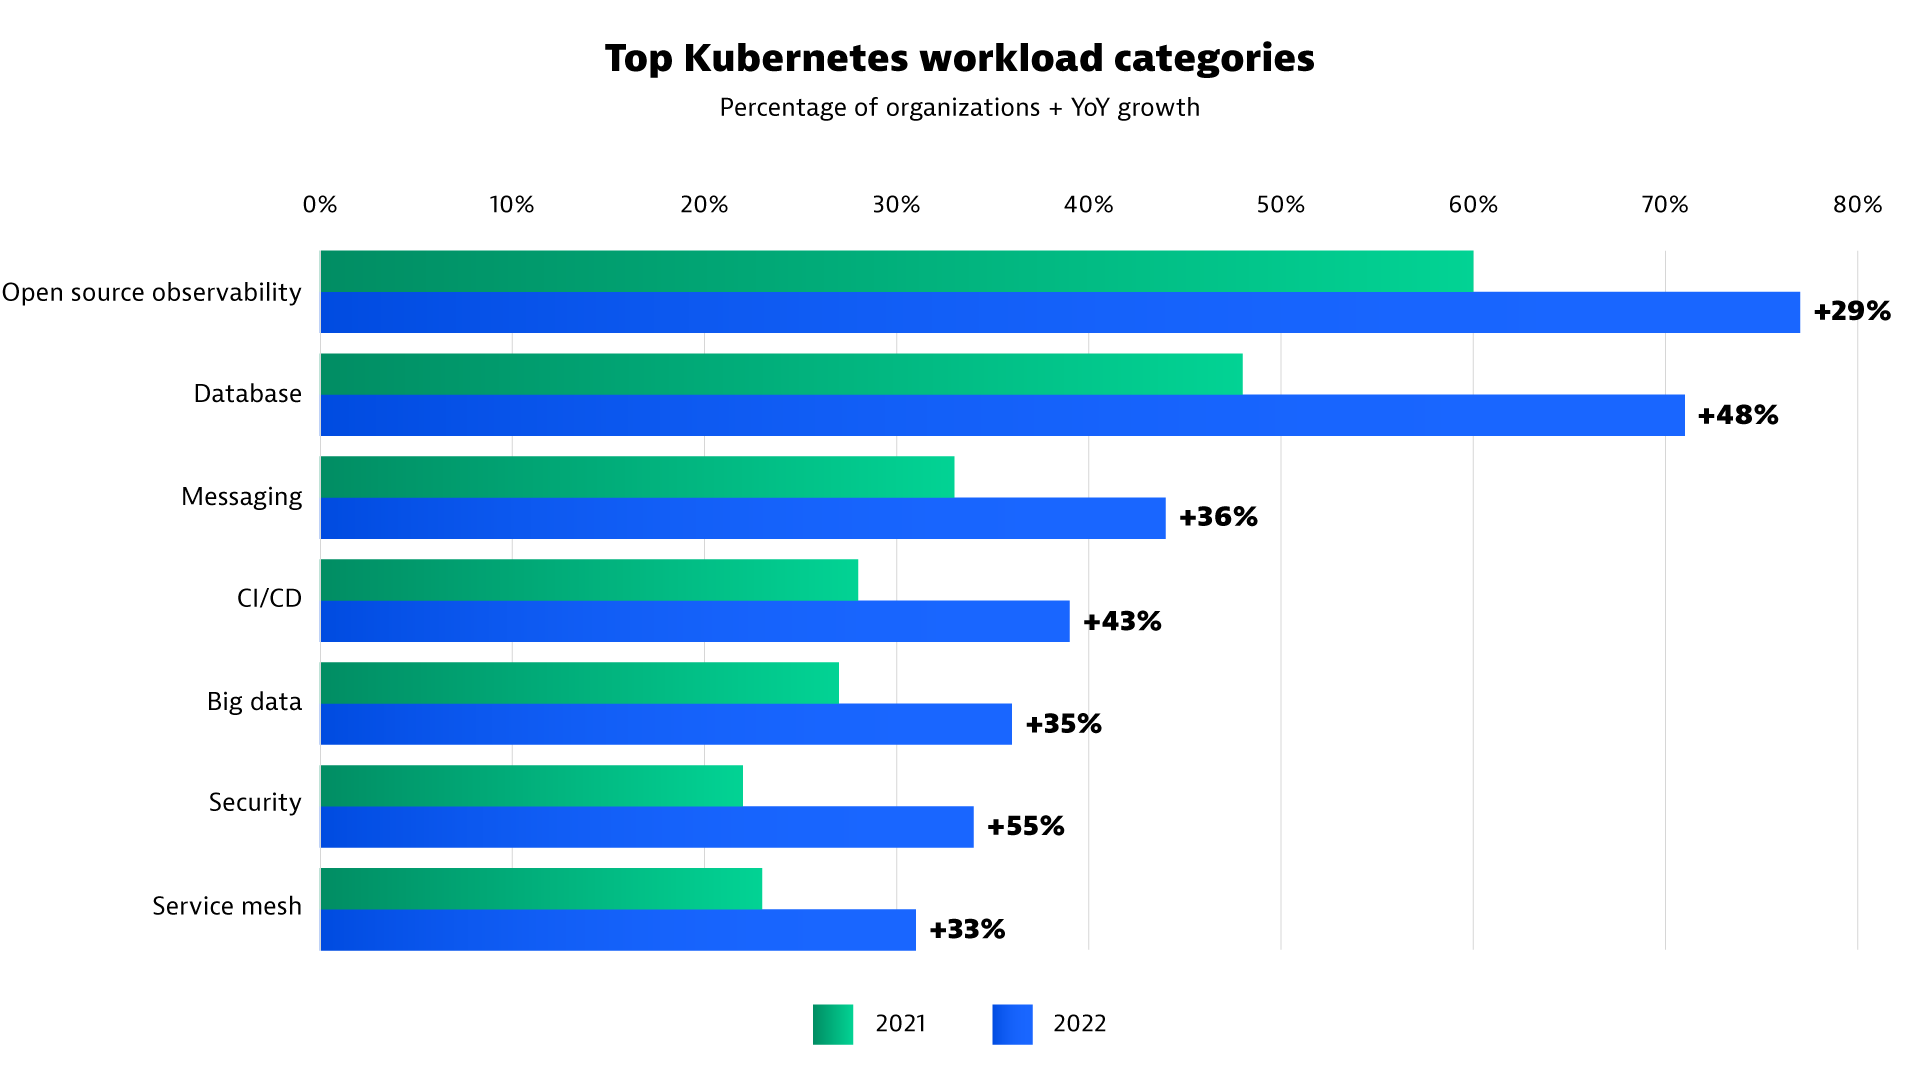
Strongest Kubernetes growth areas are security, databases, and CI/CD technologies
In 2022, organizations identified Kubernetes security as a top priority. Starting from a low baseline, the percentage of organizations using Kubernetes security tools increased from 22% in 2021 to 34% in 2022. This corresponds to an annual growth rate of +55%. That trend will likely continue as Kubernetes security awareness further rises and a new class of security solutions becomes available.
Of the organizations in the Kubernetes survey, 71% run databases and caches in Kubernetes, representing a +48% year-over-year increase. Together with messaging systems (+36% growth), organizations are increasingly using databases and caches to persist application workload states.
Continuous integration and delivery (CI/CD) technologies grew by +43% year-over-year. This trend shows that organizations are dedicating significantly more Kubernetes clusters to running software build, test, and deployment pipelines.
“The immense growth of Kubernetes presents new security challenges in runtime and increased complexity in hardening CI/CD pipelines in development. On the upside, new application security approaches address these challenges, reducing exposure to attacks and mitigating risks.”
Andreas Berger, Dynatrace Senior Principal Application Security

Open source software drives a vibrant Kubernetes ecosystem
Focusing on non-application workloads, organizations use an increasing variety of technologies. These results reflect the need to enhance Kubernetes with better observability, security, and service-to-service communications. Similarly, other technologies enable specific use cases like CI/CD tools or databases. Across all categories in the Kubernetes survey, open source projects rank among the most frequently used solutions.
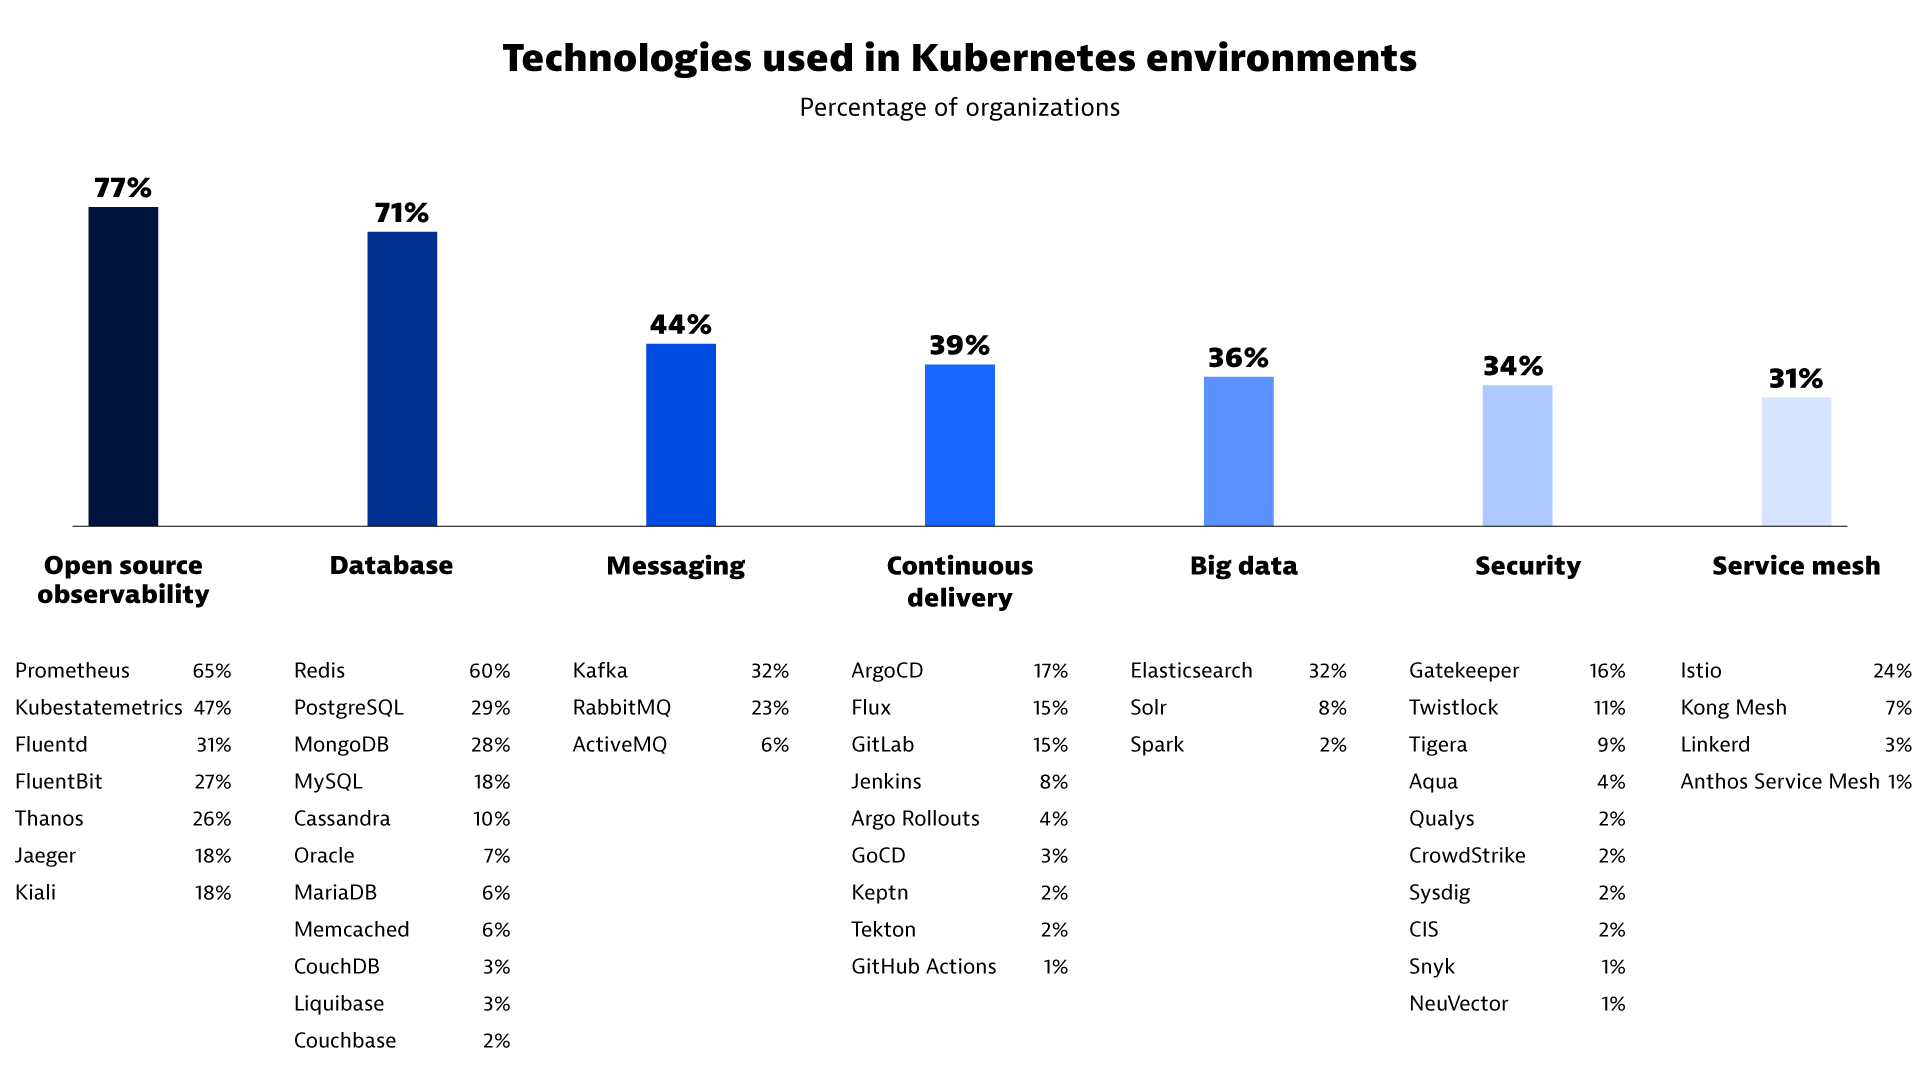
- Open source observability: Prometheus is the clear leader in open source observability and is used by 65% of organizations. In general, metrics collectors and providers are most common, followed by log and tracing projects. Note: The survey excluded all commercial observability offerings, including Dynatrace.
- Databases: Among databases, Redis is the most used at 60%. Redis is an in-memory key-value store and cache that simplifies processing, storage, and interaction with data in Kubernetes environments. Accordingly, for classic database use cases, organizations use a variety of relational databases and document stores.
- Messaging: RabbitMQ and Kafka are the two main messaging and event streaming systems used. Specifically, they provide asynchronous communications within microservices architectures and high-throughput distributed systems.
- Continuous integration and delivery: ArgoCD, Flux, GitLab, and Jenkins are the most widely adopted CI/CD tools. Organizations increasingly use the flexibility and elasticity of Kubernetes to run CI and CD jobs as well as their control planes.
- Big data: To store, search, and analyze large datasets, 32% of organizations use Elasticsearch.
- Security: For security, organizations mostly use policy checkers and enforcers, such as Gatekeeper. The need for runtime security observability is growing to automate vulnerability impact analysis.
- Service meshes: Istio is the most used service mesh. Organizations are increasingly using service meshes in large Kubernetes clusters to automate secure service-to-service communication and expose telemetry data for better observability.
“Dynatrace believes in a strong open-source ecosystem and embraces the adoption of cloud-native technologies and practices. That’s why we actively contribute to and bootstrap projects and participate in the open source community in various roles. Dynatrace’s investment in open source technologies keeps growing.”
Alois Reitbauer, Dynatrace Chief Technology Strategist

Java, Go, and Node.js are the top Kubernetes programming languages
The Dynatrace OneAgent automatically detects the specific programming languages of every individual application workload running on Kubernetes. This provided unique insights into the Kubernetes programming languages organizations use.
Java Virtual Machine (JVM)-based languages are predominant. Accordingly, 65% of all application workloads run in a JVM, including related application servers like Tomcat or Spring. Most organizations, 72%, use Java to some degree.
Go ranks number 2 with a 58% adoption rate among organizations, with 14% of application workloads written in Go. Not counted are Kubernetes system workloads, sidecars, or any standard components of non-application workloads. In addition, Node.js ranks third in terms of workload count and organizational adoption.
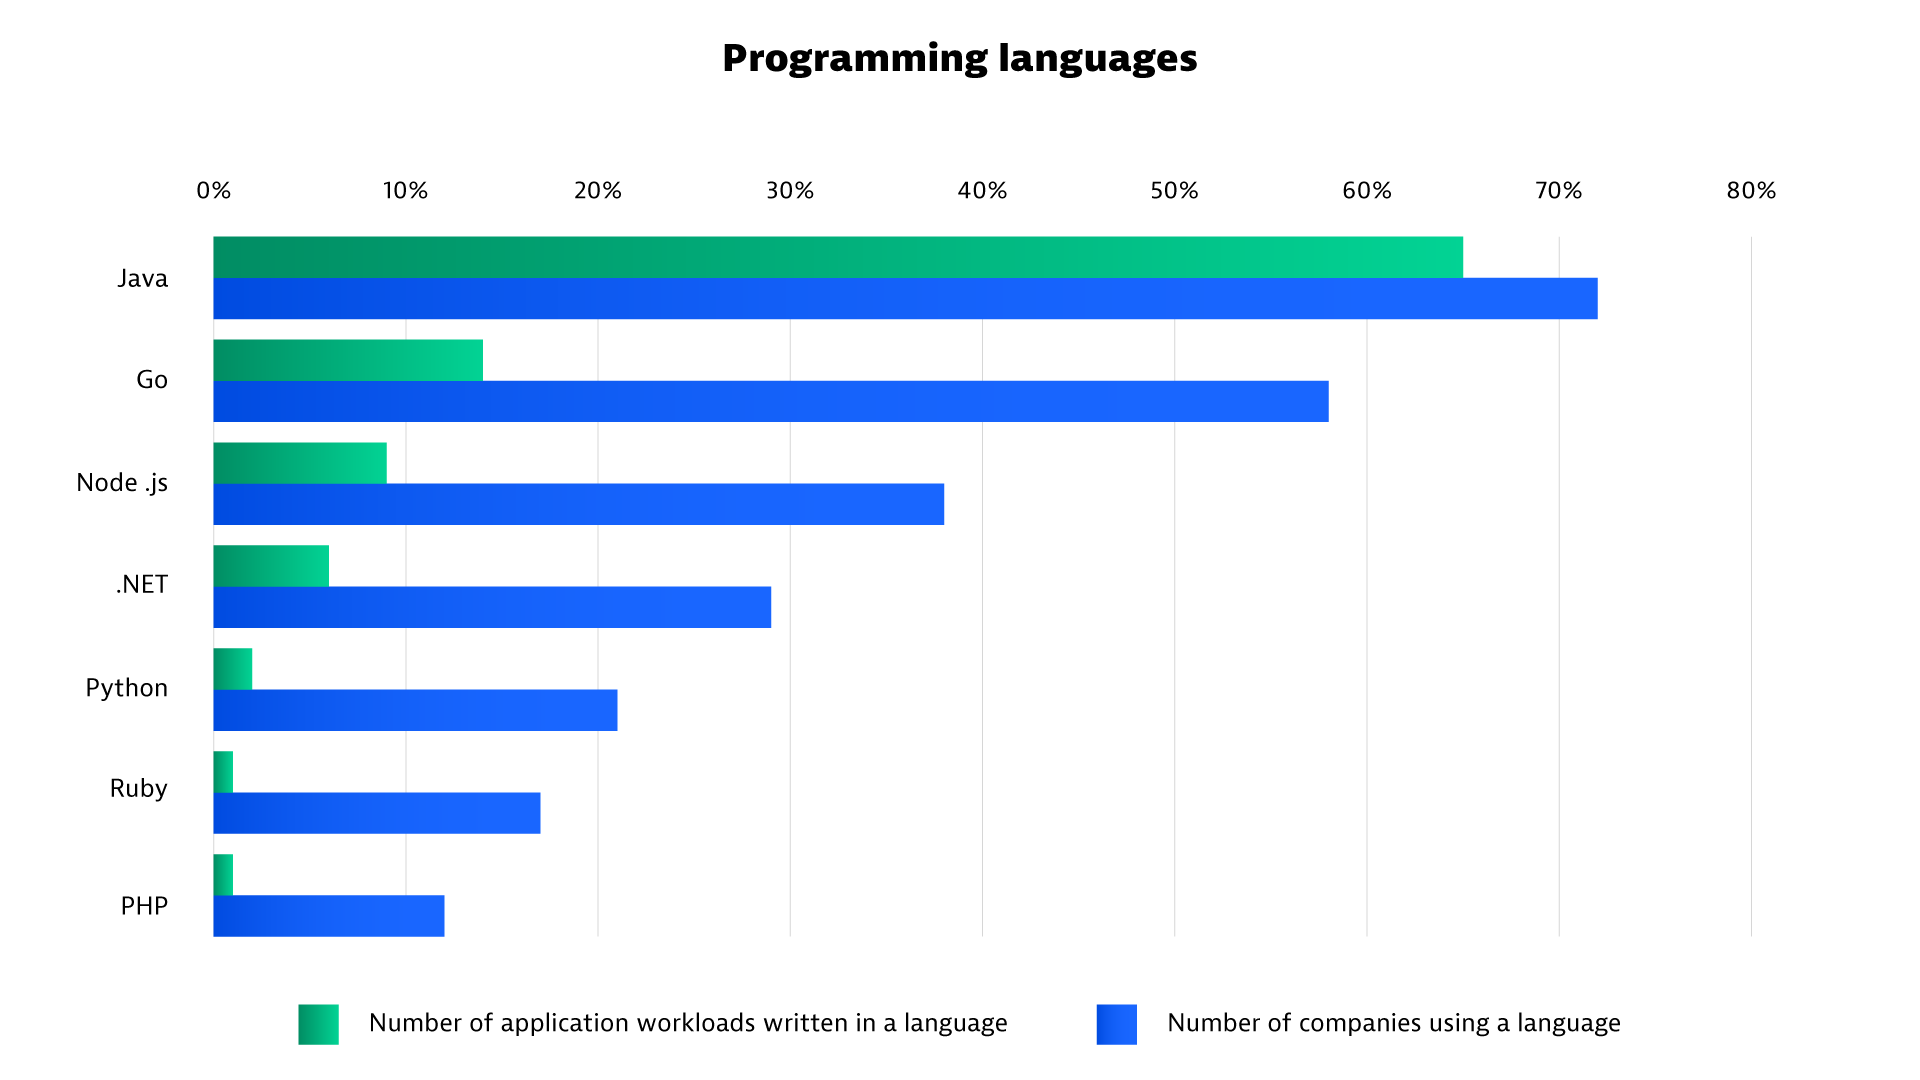
“With Kubernetes, polyglot programming finally becomes a reality. As a result, Kubernetes empowers existing teams and makes onboarding of new ones easy, regardless of programming language and framework usage.”
Florian Ortner, Dynatrace Chief Product Officer
Kubernetes survey methodology
This report reflects Kubernetes adoption statistics based on the analysis of 4.1 billion Kubernetes pods from thousands of Dynatrace customers in all global regions. The data covers the period of January 2021 through September 2022. These customers are among the world’s largest 15,000 organizations from all major industries, including financial services, retail and e-commerce, technology, transportation, manufacturing, healthcare, and public-sector organizations.
The report only includes production data from Dynatrace customers and excludes all Kubernetes clusters Dynatrace uses internally or for hosting SaaS offerings.
This report is also available as a printable pdf.


Looking for answers?
Start a new discussion or ask for help in our Q&A forum.
Go to forum