Kubernetes Monitoring: Metrics, Tools and Best Practices
Zendesk designs sales products that help companies improve their customer experiences. With a 170k+ customer base, it needed to quickly build and release new features. Zendesk migrated from a monolithic architecture to container-based environments and opted for Kubernetes clusters. In this new Kubernetes environment, Zendesk needed complete control over various K8s clusters. That’s where Zendesk opted for the Kubernetes monitoring solution.
It allowed Zendesk to identify issues and bottlenecks in application performance through logs and infrastructure metrics. The engineers could also isolate a trace that matches a specific customer, user, error code, endpoint, service, or a custom tag. It helped Zendesk to release new features quickly and do more for end-users based on quick innovation capabilities.
This was the case for one enterprise, and there are many more reaping rich rewards for Kubernetes or IT monitoring. 48% optimized their budget, 50% improved efficiency, and 47% improved service delivery. With so much hype around IT and Kubernetes monitoring, knowing it becomes vital.
This article provides a beginner’s guide to Kubernetes monitoring along with metrics, challenges, best practices, and tools.
What is Kubernetes monitoring?
Kubernetes (K8s) monitoring is a type of reporting through which you can proactively manage clusters. It eases the management of containerized infrastructure by tracking the usage of cluster resources such as memory, CPU, and storage.
The role of the cluster monitor is vital here as it can receive alerts if:
- The desired number of pods are not running
- Resource utilization is approaching critical limits or
- Failures or misconfiguration made Kubernetes node or pod unavailable.
Why is monitoring Kubernetes vital?
There are many benefits of Kubernetes monitoring and alerting. Some of the key ones are:
- Performance tuning
- Cost management
- Security
- Troubleshooting and reliability
After getting the hang of Kubernetes monitoring, the follow-up questions in your mind would be – How do I monitor the Kubernetes service? OR How do I monitor Kubernetes applications? Find answers to these questions in our next section.
Kubernetes monitoring methods
For monitoring Kubernetes cluster nodes, there are two methods in place:
- Method 1: Using Kubernetes DaemonSets
- Method 2: Using Heapster
Method 1: Using Kubernetes DaemonSets
The first approach for monitoring the Kubernetes application is to monitor all cluster nodes. For that purpose, developers have created a unique Kubernetes operator pod called DaemonSets. Kubernetes ensures every node has a copy of the DaemonSet pod. It enables one deployment to watch each machine. When the node gets destroyed, the pod also gets eliminated. Many Kubernetes monitoring solutions or tools take this approach for effective Kubernetes monitoring.
Method 2: Using Heapster
Heapster is a platform adapted by Kubernetes to send monitoring metrics to the system. It’s a bridge between cluster and storage for collecting performance metrics. Heapster acts as a standard pod and finds every cluster node via the Kubernetes monitoring API. Then, using Kubelet and Kubelet’s open-source agent cAdvisor, Kubernetes stores data about clusters in runtime.
5 Key Kubernetes monitoring metrics you should track
Before going into the nitty-gritty of Kubernetes monitoring metrics, you should know what to monitor through these metrics. So, you can monitor two primary components through Kubernetes metrics –
(i) cluster and
(ii) pods.
Kubernetes cluster monitoring:
Here, the objective is to monitor the health of the entire Kubernetes cluster. You want to get insights about whether all nodes work together correctly and in which capacity. You may also want to know about apps running on each node and the resource utilization of the entire cluster.
Kubernetes pod monitoring:
Here, the objective is to keep track of issues affecting individual pods, such as resource utilization of the pod, app metrics, and metrics related to replication or autoscaling of pods.
Based on these categories, some of the critical Kubernetes metrics are as follows:
| Monitoring Level | Metrics | Description |
| Cluster | Node Resource Utilization | Metrics include network bandwidth, memory, CPU, and disk utilization. It helps you know whether the number and size of nodes should increase or decrease. |
| Number of Nodes | Metrics include network bandwidth, memory, CPU, and disk utilization. It helps you know whether the number and size of nodes should increase or decrease. | |
| Number of Running Nodes | It helps you learn the resources billed by the cloud provider and discover how the cluster gets utilized. | |
| Pod | Kubernetes Metrics | Know how an individual pod is used and deployed by the orchestrator. You can monitor information such as the number of instances in a pod vs. expected instances, the status of the ongoing deployment, Kubernetes health monitoring, and network monitoring in Kubernetes. |
| Pod Container Metrics | They’re primarily available via cAdvisor and visualized via Heapster. It comprises metrics such as network, CPU, and memory usage compared with the maximum usage permitted. | |
| Application Specific Metrics | Application and its use cases generate metrics. For example, a database app will expose metrics on the state of an index and relational statistics. An eCommerce app might disclose the data on the number of customers online and the revenue generation. | |
| State | Persistent Volumes (PVs) | PV is a storage resource made available to pods as persistent storage on request. Monitoring PVs would help you to know whether the persistent storage is working correctly or needs some attention. |
| Disk Pressure | It occurs when a node uses too much disk space or when a node uses disk space quickly. Monitoring this metric would help you know whether the app requires additional disk space or is not optimized correctly. | |
| Crash Loop | It’s a scenario when a pod starts, crashes, and then gets stuck in a continuous restart loop without success. Monitoring this metric would let you know whether the pods are running correctly or not. If it’s not running correctly, implement emergency measures to keep the app running. | |
| Jobs | These are components designed to run pods temporarily. Monitoring jobs would let you know whether your application is accessible. | |
| Container | CPU Usage | Helps you know how much CPU resources containers use compared to the pod limits. |
| Memory Utilization | Helps you know how much memory containers use compared to the pod limits. | |
| Network Usage | Detects sent and received data packets along with bandwidth usage. | |
| Application | Application Availability | Includes Kubernetes uptime monitoring and response time of the application. It helps you to optimize the app’s user experience. |
| Application Health and Performance | Help you learn about performance, latency, responsiveness, and other user experience issues related to containerized applications. |
These were some key Kubernetes deployment monitoring metrics you should measure to get a comprehensive overview of your ecosystem’s health. However, Kubernetes monitoring and logging is not a bed full of roses. You need to overcome many obstacles before you get a sneak peek of your system’s health. The following section analyzes that in detail.
4 Kubernetes monitoring challenges you will encounter
Kubernetes and container monitoring is critical for managing and maintaining application performance over a long period. However, life becomes complicated when implementing the Kubernetes monitoring solution as Kubernetes’ strength is the weakest point here.
The ability to abstract increases the speed of deployment and adds a new set of complexities to your day-to-day tasks. Whether it’s managing application performance, gaining visibility into services, or monitoring alerting mechanisms, monitoring Kubernetes is tricky.
Here are some challenges you may encounter during Kubernetes engine monitoring:
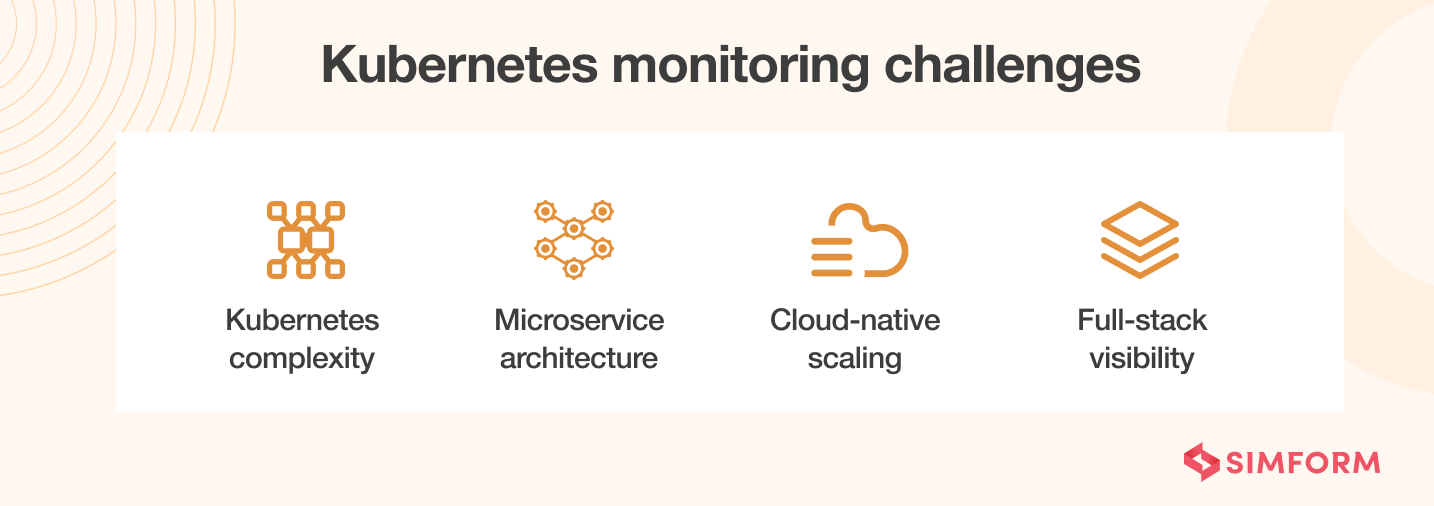
1. Kubernetes increases infrastructure complexity
In the Kubernetes cluster, you must deal with multiple servers and private/public cloud services. So, whenever any problem occurs, there are many logs and components that you need to investigate. In previous years, monitoring and logging were simple when most applications preferred monolithic architecture.
Nowadays, in the race to simplify application deployments, you take the assistance of IaaS for dynamic provisioning, automated configuration tools, and Kubernetes for orchestration. All these components add a layer of infrastructure complexity. So, if you want to monitor the Kubernetes application, you have visibility inside all of these components, which is a tedious task.
2. Microservice architecture
In addition to the Kubernetes infrastructure management complexity, most applications use microservice architecture, leading to one more layer of complexity. The reason being the number of components communicating with each other will increase.
Also, you can distribute each service across multiple instances and containers. Implementing Kubernetes monitoring architecture becomes much more difficult, as gaining visibility into microservices is never easy.
3. Cloud-native scaling requirement
Adopting cloud-native architecture is the need of today’s hour. However, it does bring an increased amount of smaller components into play. We need monitoring systems that allow us to inspect individual components. But, with new elements getting added through cloud-native and Kubernetes container orchestration, gaining complete visibility is a distant dream.
Also, Kubernetes adds multidimensional levels, like cluster, node, namespace, or service. So, collecting metrics for each component becomes a cumbersome task. Over a short period, you will have thousands of data points, translating to hundreds of thousands of time series. That’s why Kubernetes GPU monitoring tools have the challenge of scaling up against these metrics.
Nubank is a fintech startup founded in 2013. Its performance degraded due to its legacy infrastructure as the customer base grew exponentially. Initially, the engineering team migrated Nubank to cloud-native infrastructure using AWS and Docker as containerization technology. However, in this setup, the deployments depended on cloning the whole infrastructure, slowing down the application performance. That’s where the team decided to opt for Kubernetes as a container orchestrator. They also incorporated Prometheus, Thanos, and Grafana for monitoring and Fluentd for logging. It allowed Nubank to identify production and infrastructure issues, decreasing deployment time from 90 mins to 15 mins. Today, Nubank can deploy 700 times weekly, saving 30% of the total cost.
4. Full-stack visibility insider containers
There are many benefits of containers, such as we can package and isolate applications to deploy them consistently. However, hunting down containers and gaining complete control over their behavior pattern is a daunting task due to its temporary nature. With these considerations in mind, you can understand why Kubernetes traffic monitoring is a steep climb even for the most experienced developers.
These Kubernetes monitoring challenges differ from monitoring servers, VMs, or cloud instances. However, with every challenge comes a solution.
7 Kubernetes monitoring best practices
Incorporating Kubernetes into your production environment frees you from worrying about where your applications are running or if they have sufficient resources. It is because Kubernetes can create layers of abstractions through pods and services.
However, to ensure optimum performance, you must continuously monitor Kubernetes Here are some of the best practices for Kubernetes monitoring that helps you achieve optimum efficiency.
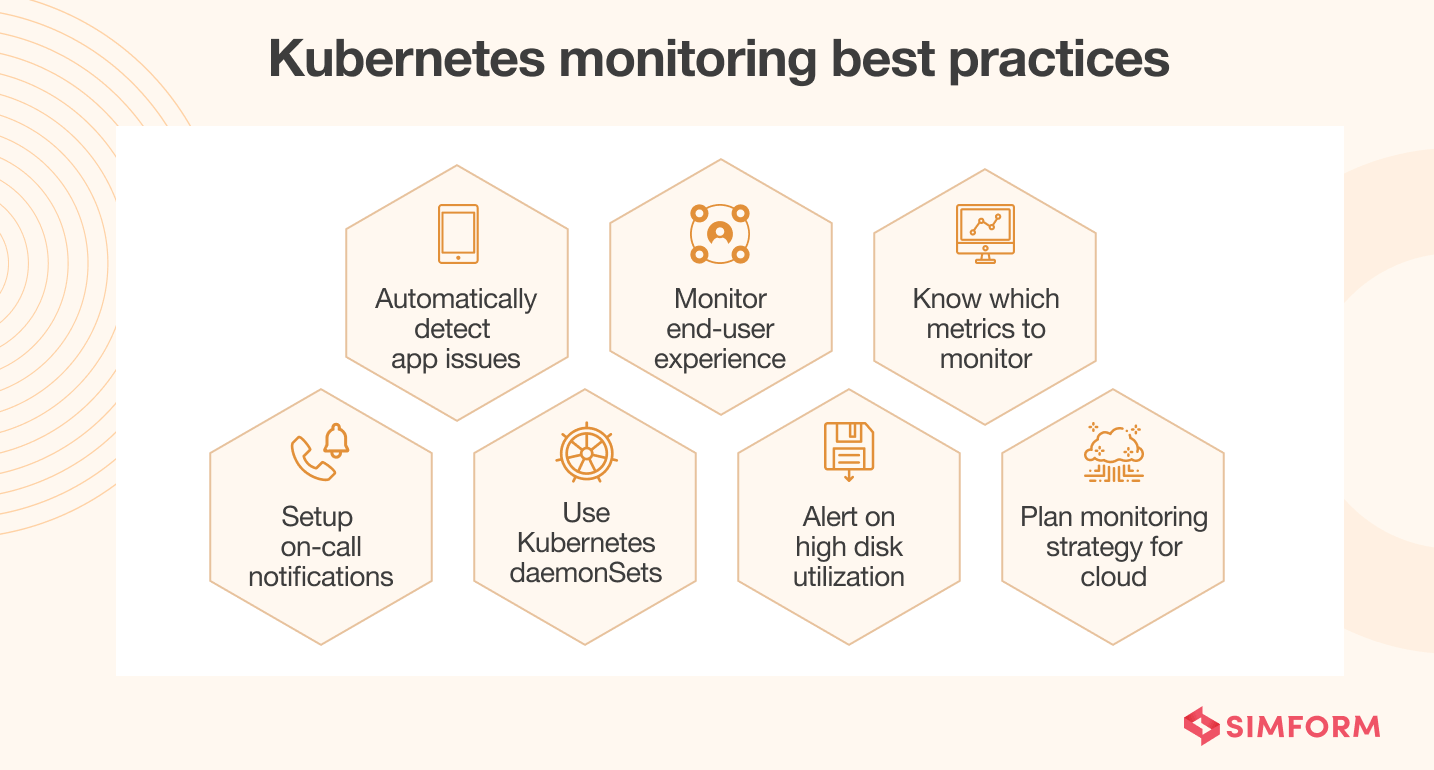
1. Automatically detect application issues
When dealing with microservices, you will require granular metrics like memory, CPU, load, etc., as part of the Kubernetes container monitoring dashboard. But, these metrics are complex to understand; therefore, you are better off with API metrics (request rate, call error, and latency).
These metrics will locate any degradation in components related to microservices. You can easily detect and resolve issues for every Kubernetes service by enabling automatic detection of REST API anomalies. It will provide consistent and full-stack visibility across clusters.
Fintonic provides users with insurance, investments, and a proprietary credit score. The firm enjoyed rapid growth in 2018 with more than 700K customers. With this much hypergrowth in a short time, scaling becomes a massive challenge. That’s when Fintonic began migrating to microservices and adopted Kubernetes. However, Fintonic needed to release new features quickly with a large customer base. For that purpose, they needed to identify performance issues in real time. They opted for a Kubernetes monitoring solution that automatically detects problems at the infrastructure and application level. It resulted in a reduction of MTTR and release cycle, meaning new features for customers at a pace.
2. Monitor end-user experience
End-user experience management is not a part of the Kubernetes ecosystem. However, any application’s primary objective is to ensure a consistent and positive end-user experience.
User experience directly relates to application performance, so you must collect data via synthesis and real-time monitoring. It will allow you to know how end-users interact with Kubernetes workloads, how the app responds, and how user-friendly it is.
3. Always set alerts for high disk utilization
High disk utilization is a common problem for any system, and the same is the case with Kubernetes. There is only one efficient way to deal with this problem, i.e., set alerts on 3/4th of disk utilization. High disk utilization alerts indicate a problem with your system, and you need to rectify it as soon as possible. You need to count all disk volume, including the root file, when forming notifications and alert rules for the high disk utilization in Kubernetes.
4. Plan your monitoring strategy for cloud environments
Most of the time, your Kubernetes applications reside in cloud environments. Therefore, when planning your monitoring strategy for Kubernetes, you need to factor in cloud monitoring. In that regard, you should monitor the following components:
- Cloud API: Cloud providers have their APIs, which you use to request resources from Kubernetes installation. Therefore, you should observe them continuously.
- Cost: Cost is a massive factor in a public cloud infrastructure. Cloud cost optimization strategies can help you to save a lot of money for cloud-based Kubernetes services.
- IAM Events: Identity and Access Management (IAM) events includes changing permission, failed or successful logins, etc. You should monitor them as part of security.
- Network Performance: The network could become your biggest obstacle in the cloud environment. So, you should continuously monitor network performance to prevent downtime and user experience issues.
5. Use Kubernetes DaemonSets
When you’re running Kubernetes – ideally, you want to run a single pod on all the nodes. A DaemonSets is a Kubernetes workload management object that ensures a particular pod runs on ‘every node in the cluster’ or some ‘subset of nodes.’ So, by using DaemonSets, you’re telling Kubernetes to run only one instance of the pod on all nodes at a particular time.
6. Know which metrics to monitor
There are five major types of Kubernetes metric categories that you can explore:
- Cluster
- Pod
- State
- Container
- Application
Each of these categories comprises various metrics. As a developer or system architect, you must decide which metrics are relevant to your Kubernetes monitoring ecosystem. It will help you to detect issues, and once you solve them, you can optimize your application performance.
7. Setup on-call notifications
Kubernetes monitoring is useless if your system doesn’t have the facility to set up push notifications for cluster administrations. Therefore, choosing a tool that pushes high-priority alerts to admins using channels like email, SMS, Slack, etc., is paramount. Moreover, you should also have a forwarding mechanism for it. For example, when an administrator is unavailable or unable to solve the issue, the notification gets passed to their immediate senior.
Like many government institutions, the City of Montreal had several legacy systems stacked up over the last 30 years. Over 1000 applications were running on different ecosystems. In 2015, the engineers decided to modernize the platform and create one unified portal to improve the customer experience while decreasing complexity. The first step was adopting Docker as part of containerization best practices, and later on, Kubernetes came into the picture for orchestration. Lastly, the City of Montreal opted for monitoring and logging tools such as Prometheus and Grafana. It allowed them to observe Kubernetes clusters and identify any bottlenecks quickly. It reduced time-to-market from months to a few weeks and deployments from months to hours while improving customer experience.
You can also use automated alerting tools that integrate seamlessly with Kubernetes. Here are some of the key benefits of using such tools:
- Real-time, cross-team collaboration
- Prioritized alerting on mobile devices
- Configurable fail-safe schedules
- Historical and real-time visibility into incidents
These best practices can help you achieve optimum performance out of Kubernetes monitoring. However, implementing each one of these separately into your ecosystem would be a cumbersome task. Kubernetes log monitoring tools help you ease the task.
If your team has never worked with Kubernetes Monitoring before. Well, no worries.
Top 10 Kubernetes monitoring tools for containerized environments
There are many monitoring tools available in the market. So, deciding the best monitoring tool for Kubernetes is challenging. We have created a list of the top 10 Kubernetes monitoring tools.
1. Prometheus
Prometheus, developed by SoundCloud and donated to CNCF (Cloud Native Computing Foundation), is one of the most popular open-source Kubernetes monitoring tools. Its multidimensional data model and flexible query language (PromQL) differentiate it from other tools. Unlike other tools, it follows a pull model with real-time alerting mechanisms. Additionally, it’s user-friendly and easy to learn, even for a newbie.
2. Kubernetes Dashboard
Kubernetes Dashboard is a web-based user interface that helps in monitoring Kubernetes pods. This tool lets you visualize important information from Kubernetes containers and pods running in a specific cluster. It enables you to view the deployment of apps into pods, identify and troubleshoot issues with apps running in pods, and understand resource utilization. Moreover, you can also conduct a health check on Kubernetes pods and deployments.
3. Grafana
For slicing and dicing Kubernetes metrics to monitor its health and performance, Grafana is one of the first tools that comes to mind. Grafana’s USP lies in its ability to integrate with a long list of data sources. In addition, it offers various features, such as alerts, annotations, filtering, data source-specific querying, visualization and dashboarding, etc. Setting up and configuring Grafana on Kubernetes is easy as it benefits from a rich developer community.
4. Sematext
Sematext supports both traditional and microservice-based applications, making it a versatile monitoring solution. With Sematext, you can capture metrics and events in real-time by collecting telemetry data from various instrumentation points, such as Kubernetes nodes, pods, and clusters. It lets you set up notifications and alerts on critical metrics. Sematext is known for customization, which means you can set alert rules for logs and metrics and customize monitoring dashboards.
5. Jaeger
Jaeger is a free distributed tracing tool that helps monitor and troubleshoot Kubernetes environments by conducting root cause analysis, service dependency analysis, distributed transaction monitoring, and performance optimization. It supports various programming languages such as Java, Node, Python, Go, and C++ and databases such as Cassandra, Elasticsearch, Kafka, etc.
6. Elastic Stack (ELK)
The Elastic Stack (ELK) is one of the most famous open-source log management solutions that cover Kubernetes. It combines four tools (Elasticsearch, Logstash, Kibana, and Beats). Elasticsearch is a full-text search engine that stores Kubernetes logs. Logstash is a log aggregator that captures and processes the logs. Kibana provides reporting and visualization functionalities. Beats are lightweight data shippers that send logs and metrics such as CPU, memory, disk, and network utilization numbers to Elasticsearch.
7. cAdvisor
cAdvisor is a container monitoring tool that collects system metrics such as CPU usage, network traffic, and memory utilization to provide insights into the health and performance of containers in your Kubernetes-based ecosystem. The tool gets deployed on the node level and auto-discovers all containers inside your ecosystem. cAdvisor is often the built-in functionality of Kubernetes existing on every node and integrated into the kubelet binary.
8. Kubewatch
Kubewatch helps you track specific Kubernetes events and send notifications to collaboration tools like Paperduty and Slack after collecting all relevant data. It also monitors changes occurring in various Kubernetes resources, including pods, DaemonSets, deployments, ReplicaSets, and configuration maps. Moreover, Kubewatch can be deployed manually or automatically using Helm charts.
9. kube-state-metrics
kube-state-metrics listens to Kubernetes API (which offers information about the count, health, and availability of pods, nodes, and other Kubernetes objects) and generates metrics that reflect the current state of Kubernetes objects. These metrics comprise node status, CPU capacity, available/unavailable Kubernetes replicas, etc. With this information, you can identify cluster infrastructure, resource constraints, or pod scheduling issues.
10. Datadog
Datadog is an APM (Application Performance Monitoring) solution that provides real-time insights into the state of Kubernetes by extracting logs, metrics, events, and services. With Datadog, you can monitor, troubleshoot, and optimize the performance of Kubernetes-based applications. The tool features customized dashboards for visualizing various metrics and events. You can also set up alerts on specific events or metrics.
Want robust monitoring of your Kubernetes applications?
In the last few years, we at SIMFORM have worked with various clients and on multiple technologies. One such case occurred when we built a white labeled cloud-native auctioning platform for a famous auction firm. As the engineering team had the task of modernizing the existing platform, it needed an approach that ensured a speedy release cycle. We also had the job of streamlining the build and release cycle of white-labeled applications.
We used containerization for infrastructure management for 100s of white-labeled deployments, ensuring fast scalability of independent modules. We also implemented a Kubernetes monitoring solution to check the health of the Kubernetes cluster and pods. It confirmed a quick release cycle and streamlined the build, resulting in faster time-to-market.
Simform is a leading infrastructure management and monitoring service provider that can help you implement efficient DevOps. Our engineering team will help you develop a solution to monitor Kubernetes apps. Collaborate with our experts for more details.