What is Observability? An Advanced Guide (Tools, Challenges, Best Practices)
The rise of microservices, serverless computing, containers, and other distributed technologies, has made it difficult for teams to get complete visibility into their infrastructures.
The existing monitoring solutions tell them only about a handful of metrics and are unable to unearth root cause of issues. With increasing complexity of software infrastructures, the traditional monitoring solutions are only going to get more inefficient.
Observability is the next evolutionary stage when it comes managing software infrastructures. It helps teams to:
- Monitor distributed systems effectively
- Conduct root cause analysis in a complex architecture
- Reduce mean-time-to resolution and improve uptime
In this article, we’ll go through observability, its tools, challenges, best practices, and more.
What is observability?
Observability is the ability to understand the internal state of a system by capturing and analyzing its outputs. It involves collecting, visualizing, and applying intelligence to metrics, traces, logs, and events to understand the behavior of a complex system. Observability enables SREs and developers to understand the ‘what and why’ of everything happening in a distributed system.
Why is observability important?
Legacy IT systems had fewer moving parts. CPU, memory, databases, and network monitoring were good enough to understand, detect and fix any issues. Today, the number and types of failures are high with distributed systems and multiple interconnected parts. 76% of CIOs believe it’s hard to have complete visibility over infrastructure in cloud environments.
In today’s complex IT environments, you have components like hardware, software, cloud-native infrastructure, containers, open source tools, microservices, serverless technologies, etc. These systems combined to generate a high volume of records of activities.
The goal of observability is to understand these environments and related activities by analyzing the data so that it can resolve issues to keep your system efficient and reliable. For this purpose, observability relies on telemetry data such as metrics, logs, and traces – that provide a deep understanding of the distributed systems.
You have understood observability and its importance in today’s IT world. But, what are the building blocks of observability?

What are the three pillars of observability?
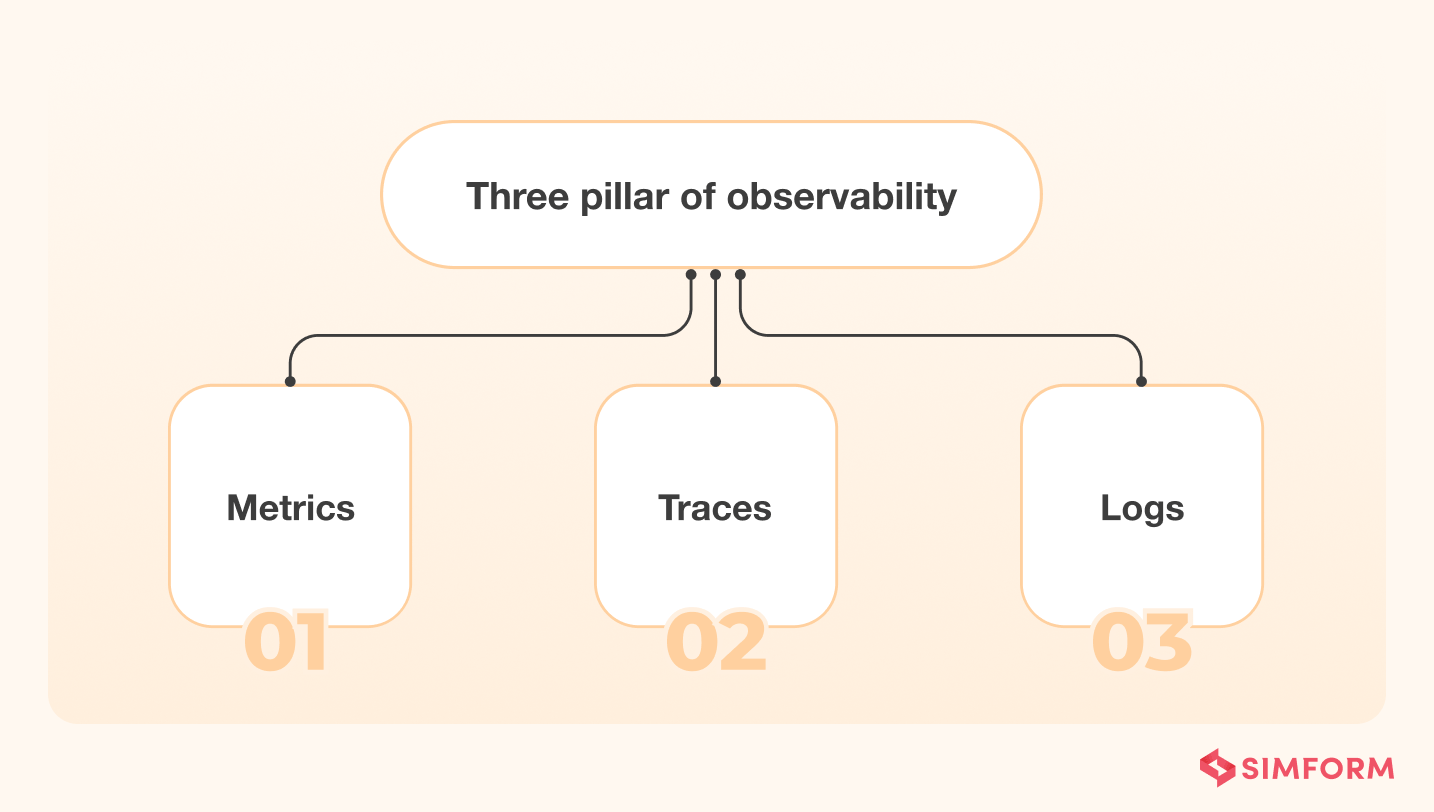
The three pillars of observability or primary source data types of observability are as follows:
Logs
Event log is an immutable human-readable form record of a historical event. It also includes a timestamp and a payload to provide context for the same. Most logs come in three formats – plain text, structured, and binary.
Out of the three, plain text is the most preferred format, but structured logs that carry additional information and metadata are becoming more popular because they’re easier to query.
Metrics
A metric is a numeric value measured over a specific period and includes attributes such as timestamps, KPI (Key Performance Indicators), and values.
In observability, you focus on reliability and performance metrics, such as how much the memory usage, CPU capacity, latency, traffic, error rate, or saturation is. Unlike logs, metrics are structured by default and easier to store and observe. You can retain them longer and analyze the system’s performance.
Traces
A trace represents an end-to-end request journey right through the distributed systems.
As the request moves through the IT systems, microservices perform various operations. Each of these operations is called “span,” and you encode it with important information related to microservices. So, if you analyze these traces, you can track how a particular request moved through the system, operations performed on it, and the microservices involved. With this detailed information, developers can identify the root cause of any bottleneck or breakdown.
While you can use each of these pillars individually, it won’t give you the desired results due to unique limitations associated with each of these pillars.
For example, logs can be challenging to sort and aggregate to draw meaningful conclusions; metrics are hard to tag and sort, so tricky to use them for troubleshooting, and traces can produce a lot of unnecessary data. Therefore, as an observability practitioner, you should opt for an integrated approach by combining these three pillars.
4 key components of observability
To make your IT systems observable, it’s paramount that you create a suite of tools and applications that can collect the telemetry data in terms of logs, metrics, or traces.
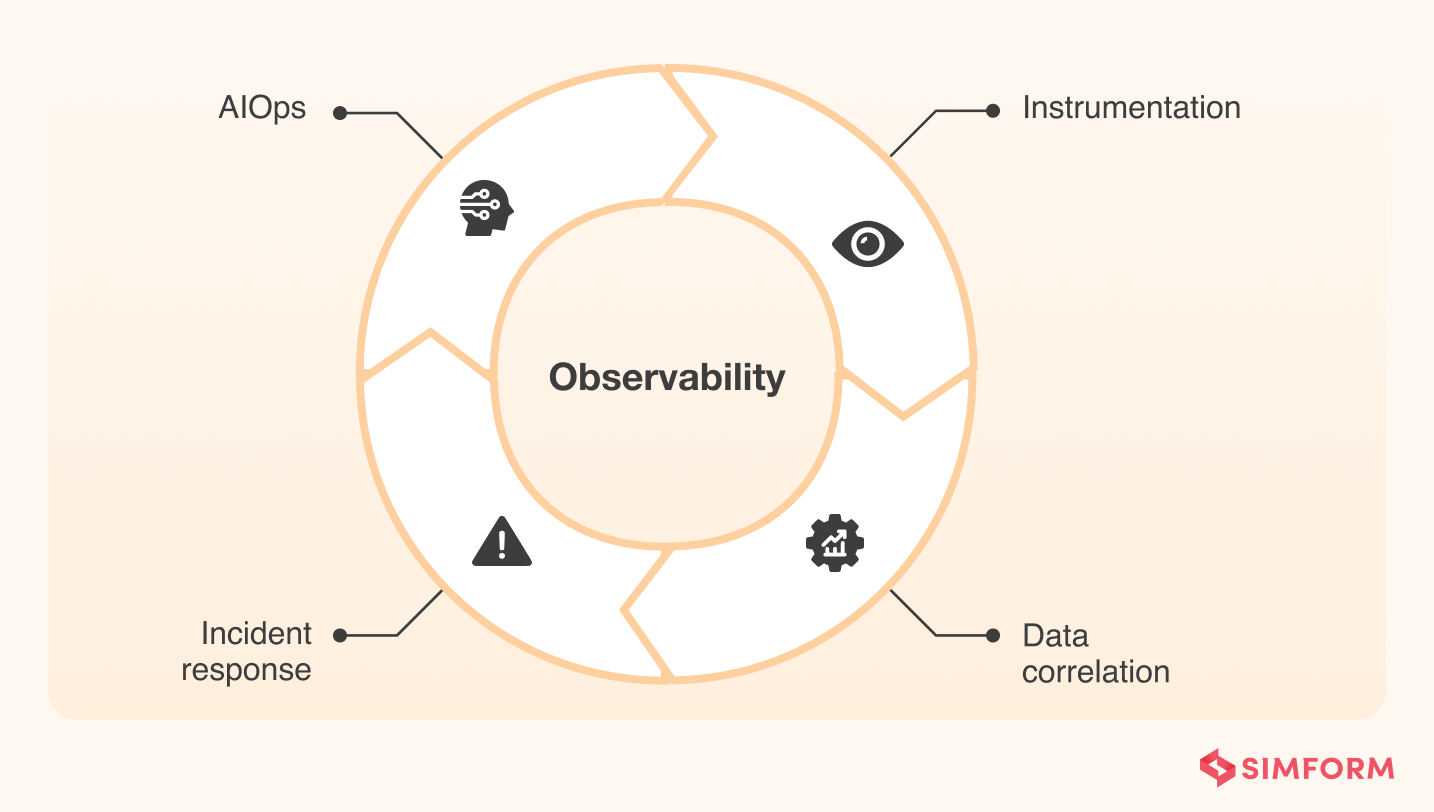
Typically, these four components help you implement observability in any ecosystem:
1. Instrumentation: These tools collect telemetry data from a container, service, application, host, and any other system component to enable visibility across the entire infrastructure. Examples of telemetry data include metrics, events, logs, and traces, often referred to as MELT.
2. Data correlation and context: You must process and analyze the telemetry data collected from various entities to establish a correlation. It also creates a context so humans can understand any patterns and anomalies developing within the ecosystem.
3. Incident response: Incident management and automation systems get outage data and then share it with relevant people or teams based on on-call schedules and technical skills.
4. AIOps: Machine learning models automatically aggregate, correlate, and prioritize incident data. They also filter out unrelated data and create an alert signal or detect issues that can impact the system’s performance and efficiency. Ultimately, they accelerate incident response.
These were the critical components that make up the observability ecosystem. But how do all these translate into benefits for your organization?
Key benefits of observability
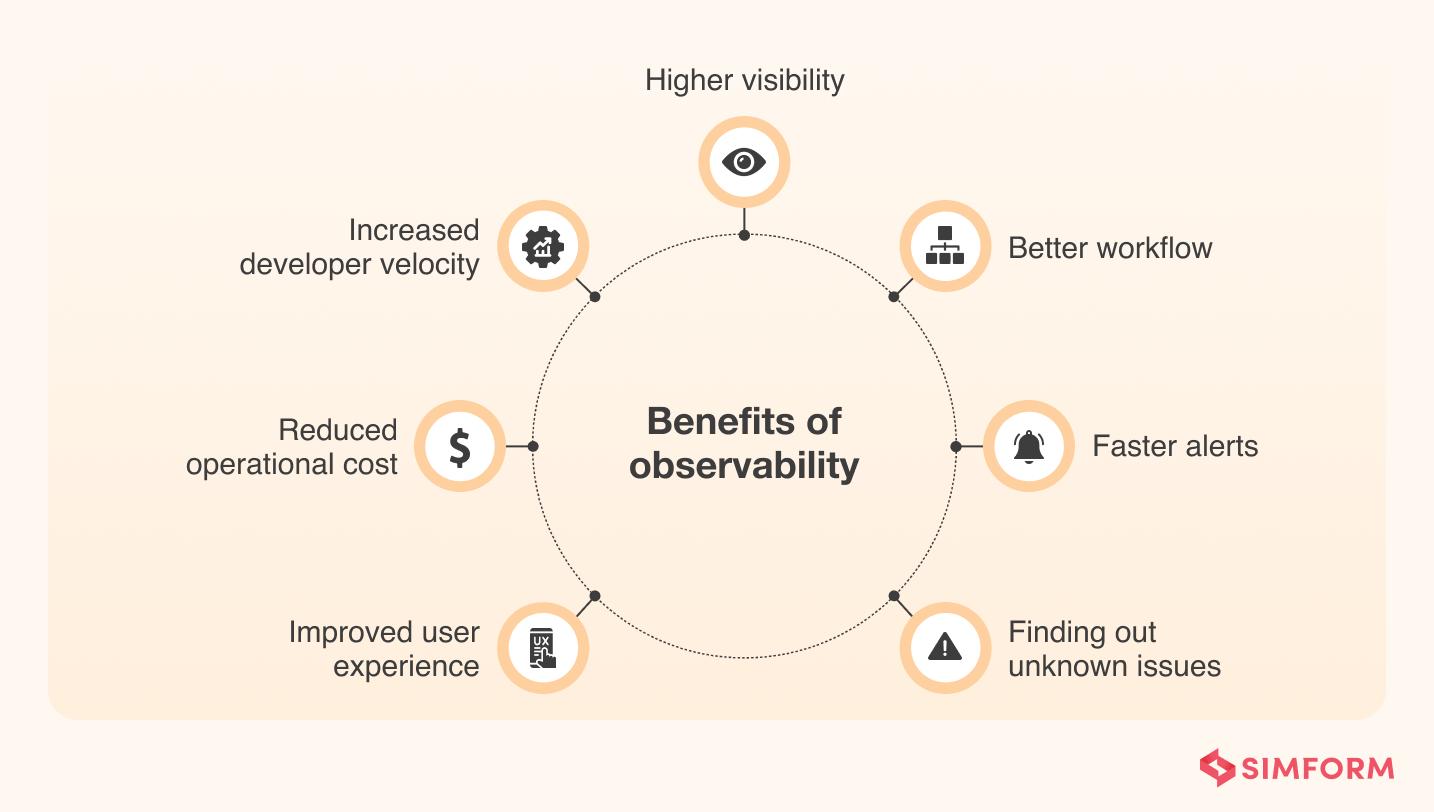
1. Improved user experience: Observability focuses on detecting and fixing issues proving to be bottlenecks for the system’s performance and efficiency. Therefore, implementing observability would enable you to improve system availability and high-end user experience.
2xConnect is a B2B telemarketing startup that combines data, dialing, and voice in one solution. It opened up a new horizon for daily call agents. However, for this solution to work efficiently, 2xConnect needed to ensure minimal downtime and manage thousands of requests efficiently while not compromising the performance. That’s where 2xConnect adopted an end-to-end observability solution. It helped 2xConnect gain a single pane of glass view into their IT operations, infrastructure and security, allowing them to address issues faster and reduce downtime by 60%. Lastly, it ensured 100% uptime during AWS migration and improved revenue conversion by 20%.
2. Reduced operational costs: Observability speeds up detecting and fixing infrastructure management issues. Observability focuses on reducing irrelevant or redundant information and prioritizing critical events. So, you can accomplish tasks with a small operation team and save a lot of money.
3. Increased developer velocity: Developers can increase development speed if they get early access to access to the logs, metrics, and data related to that. With observability, developers quickly know all the bugs and errors as soon as the code gets uploaded to Git. So, they can work at the production cycle’s start, thereby increasing development speed.
4. Higher visibility: Developers working in distributed environments often get challenged with visibility issues. They sometimes don’t know which services are in production, what application performance is, or who owns a particular deployment. But, with observability, they can get real-time visibility into production environments helping them to improve productivity.
5. Better workflow: Observability allows developers to trace a particular request’s journey from start to finish with contextualized data about one specific issue. It helps developers to streamline the investigation, debug the issue and optimize the overall workflow of the application.
Riot Games is a gaming platform that emphasizes delivering a world-class customer experience. The platform was using microservice architecture. Therefore, constantly monitoring the performance and optimizing the workflow was a massive challenge. Initially, Riot Games engineering used an in-house tooling ecosystem, but it was not giving them enough visibility and insights into the player experience. That’s where Riot Games adopted observability to optimize the workflow and scale the process. It also allowed Riot Games to discover critical issues they should address for better performance. Lastly, observability ensured significant visibility in services and during interactions.
6. Faster alerts: Developers can detect and fix the problems faster with observability implemented in your ecosystem. With deeper visibility, observability can see any issues earliest and provide the same info to related people or teams at any given time in the form of alerts or notifications.
7. Find out the unknown issues: With application performance monitoring tools, developers can find the ‘known issues’ – the exceptional conduction you already know. However, observability addresses the unknown issues’ – the problem you don’t know exists in the ecosystem. It helps to identify issues, and their root causes to improve efficiency.
You may avail of these benefits by implementing observability in your ecosystem. However, with benefits, there are always some challenges present.
Optimize IT infrastructure to drive innovation and business transformation
Major challenges of observability
Nowadays, you need to deal with multi-cloud environments that are complex and dynamic. In this scenario, implementing observability at scale to fulfill customer expectations and business goals would be pretty challenging. Here is a list of obstacles you must overcome to implement observability in your ecosystem successfully:
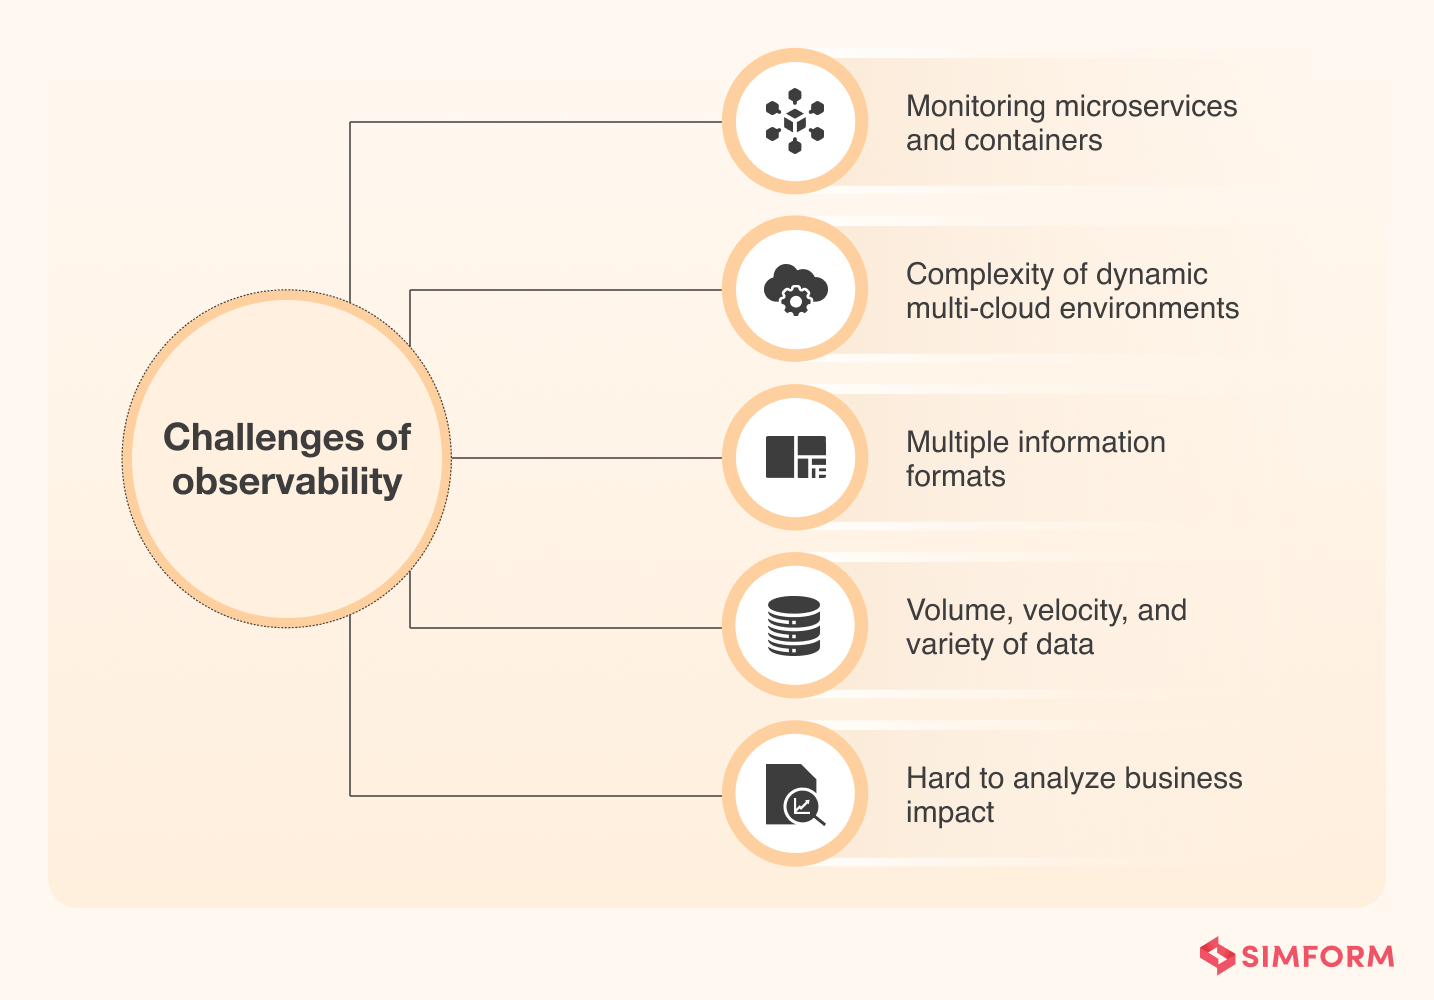
1. Monitoring microservices and containers in real-time
84% of IT teams use thousands of compute instances, with microservices and containers being the centerpiece to achieve speed and agility. The dynamic nature of these technologies makes it hard to have real-time visibility into their workloads, which is a crucial element of observability.
Without proper tooling, it becomes impossible for IT teams to understand the internal state of all the relevant components. They either have to contact workflow architects who built the system or do guesswork, which is not the ideal approach with so many interdependencies.
2. Complexity of dynamic multi-cloud environments
Multi-cloud environments are evolving rapidly with a continuous influx of new technologies. This makes it very difficult for IT professionals to understand how everything’s working together. It requires a new set of tools and approaches to understand the interdependencies. Because without visibility into infrastructure, it’s impossible to implement observability practices.
3. Multiple information formats
To successfully implement observability, you try to collect and aggregate telemetry data from various sources. However, it can be challenging to filter out the correct information and provide context when it comes to interpretation, as the same type of data comes from multiple sources in multiple formats. All this demands a strategy for structuring information of different forms into a standardized format.
4. Volume, velocity, and variety of data
IT teams must process increasingly complex data volume using various tools and dashboards to define a standard behavior limit in constantly changing environments. However, how can you monitor any issues if you don’t have any knowledge or visibility into a dynamic environment?
Observability requires you to monitor every data point. The teams then try to stitch up information from static dashboards using timestamps to identify events that may have caused failures. So, higher volume and velocity of data may hamper observability implementation.
5. Hard to analyze business impact
While engineers know the value of modern-day observability tools, it doesn’t always translate into direct business benefits. Ideally, an observable system should bring business benefits such as less downtime, fewer serious support requests, better workflow, higher visibility, improved user experience, reduced operational cost, etc. But, it doesn’t always happen in all organizations because most companies focus on accelerating development velocity and ensuring faster release instead of cleaning up technical debt.
You must overcome these obstacles to reap the business benefits of observability. But, with every problem, there is always a solution, and the same applies to the case of observability, where you’ve best practices to answer challenges.
Best practices to make observability actionable for IT teams
Gaining accurate visibility into your architecture and infrastructure is the primary goal of observability systems. However, when implementing observability in your ecosystem, there are bound to be some common obstacles you need to encounter. To overcome these issues and make observability actionable for IT teams, here is a list of best practices you should follow.
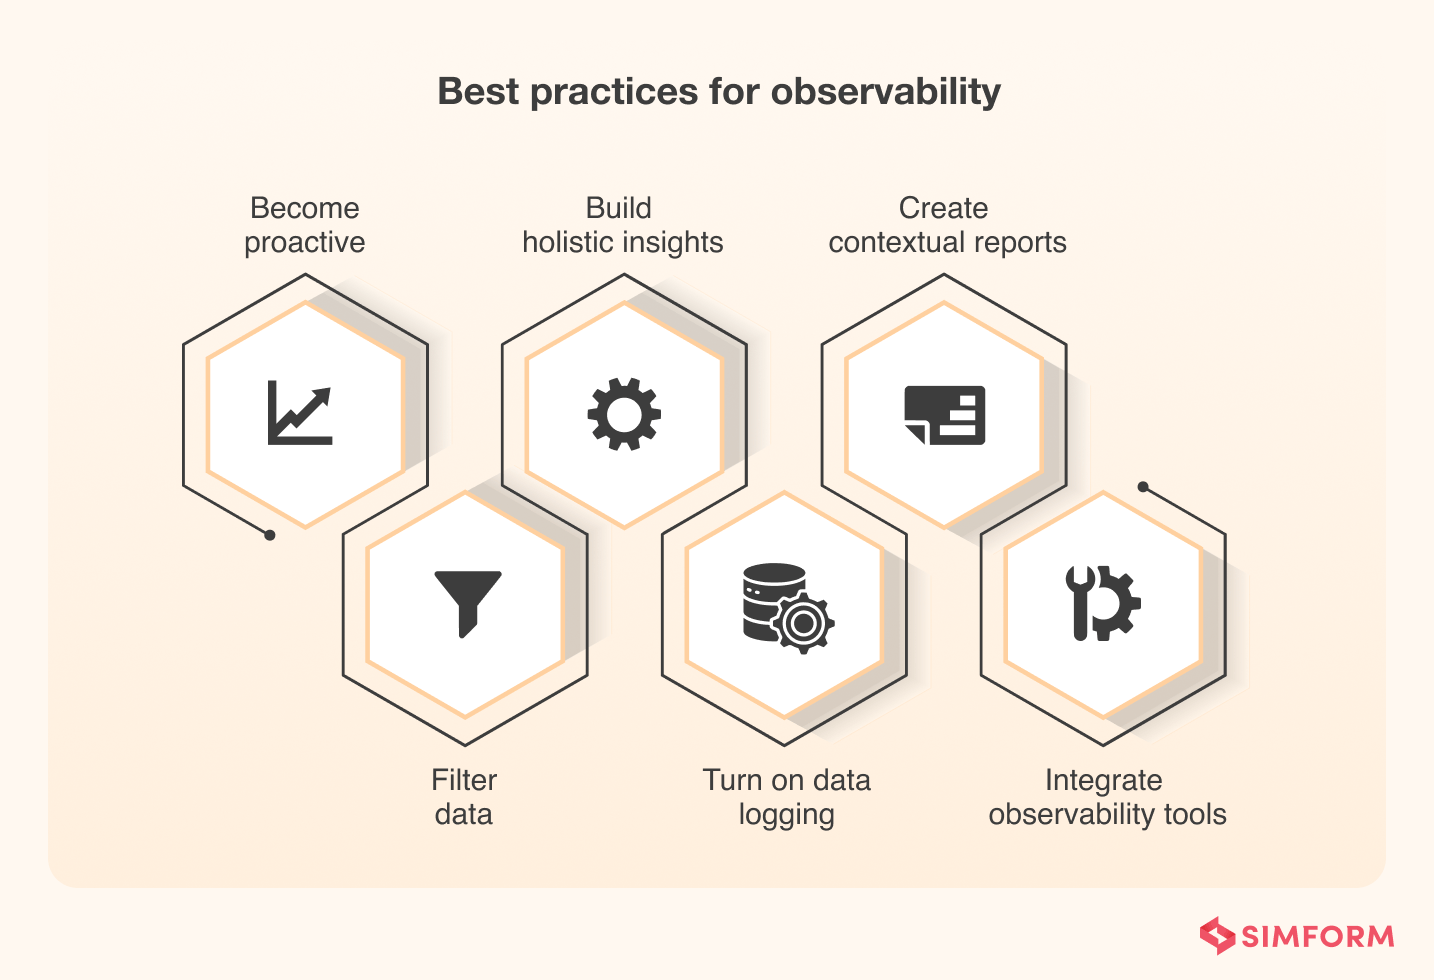
1. Become proactive
Observability is a proactive approach for identifying and correcting the issue before it becomes a big problem. For example, IT teams should decide the helpful metrics and, based on that, opt for the observability tools. Here are some more tips that help you to adopt proactive measures:
- Tracing information back to the source to verify systems are working well
- Verify if the telemetry data collected is clean and usable
- Test visualizations and automated responses
- Monitor database and storage repository sizes
- Increase or reduce data inputs based on previous results
2. Filter data to the point of creation
Most of the data created by the IT platform are insignificant. So, you should design an observability system that filters out unimportant data at multiple levels to reduce bandwidth hijacking and provide real-time and actionable insights. However, be careful when filtering data. Sometimes what seems trivial to the operations teams may have a context and a value when aggregated with data from other sources.
3. Build holistic insights
Try to collect metrics from each application component such as infrastructure, application, serverless, middleware, or database. Moreover, you should ensure that logging is present for every piece, including third-party solutions. Lastly, configure logs for metadata, such as date and time, username, IP address, service name, caller name, etc.
So, when the observability software processes data, it will have active granular metrics and passive monitoring through automated processes. Both these will combine to give you a more holistic view of your ecosystem and a more accurate insight.
4. Turn on data logging
You should utilize the Simple Network Management Protocol (SNMP) or other mediums of creating standardized data logging wherever possible. Sometimes data logging is enabled in tools used to aggregate and collect, but you should turn it on if it’s not enabled already.
Moreover, connectors can translate the data into a standard format, making it easier for you to understand the context of the data patterns. Many data aggregation tools, such as Microsoft Excel, Integrate.io, GoSpotCheck, Google Locker, Zoho Analytics, etc., can help you in this scenario.
5. Create contextual reports
You shouldn’t view observability as the tool that will help IT system administrators or DevOps teams. Instead, it has a much deeper meaning. It aims to bridge the gap between IT and business people by providing a contextual report on what you should do to improve system performance.
So, you should create a report with contextual meaning for developers and business people. The report should have the root cause of problems with trend analysis for IT professionals and their business impacts that management people could easily understand.
6. Integrate observability tools with automated remediation systems
Many observability tools will discover issues or problems related to kernel or operating system level. And most IT system administrators already have automated routines to fix those issues. In this scenario, integrating the observability softwares with the existing ecosystem will help you maintain an optimized environment. Also, for areas where automation is not feasible, this integration will help you filter out and fix issues and allow you to focus on business problems affecting user experience.
7. Identify the right vendors
A wide variety of observability tools are available in the market, and choosing the right one that fits and aligns with your business needs is paramount. Organizations need to figure out the tools that give them the best possible visibility into architecture and infrastructure, which are most interoperable, and reduce operational time and costs.
You can build your observability toolchain, opt for open-source solutions or buy any commercial solutions that seal the deal. It all boils down to individual needs, goals, and objectives.
8. Integrate AI/ML
Automation is a big part of observability, where you must continuously monitor and observe the ecosystem for any new issue. Artificial intelligence and machine learning algorithms can be beneficial for incorporating automation into observability. It helps you to store and process vast amounts of data and unravel exciting patterns or insights that can help you improve application efficiency. Moreover, it also allows you to eliminate human errors and enable scaling capabilities with utmost ease.
These were the best practices one should follow to make systems more observable. However, to implement these best practices for your organization, you need to take the assistance of observability tools.
What to look for in an observability tool?
Whether you opt for open-source, commercial, or tailor-made observability tools, look for common traits. Here is the list of standards that help you decide on a good tool:
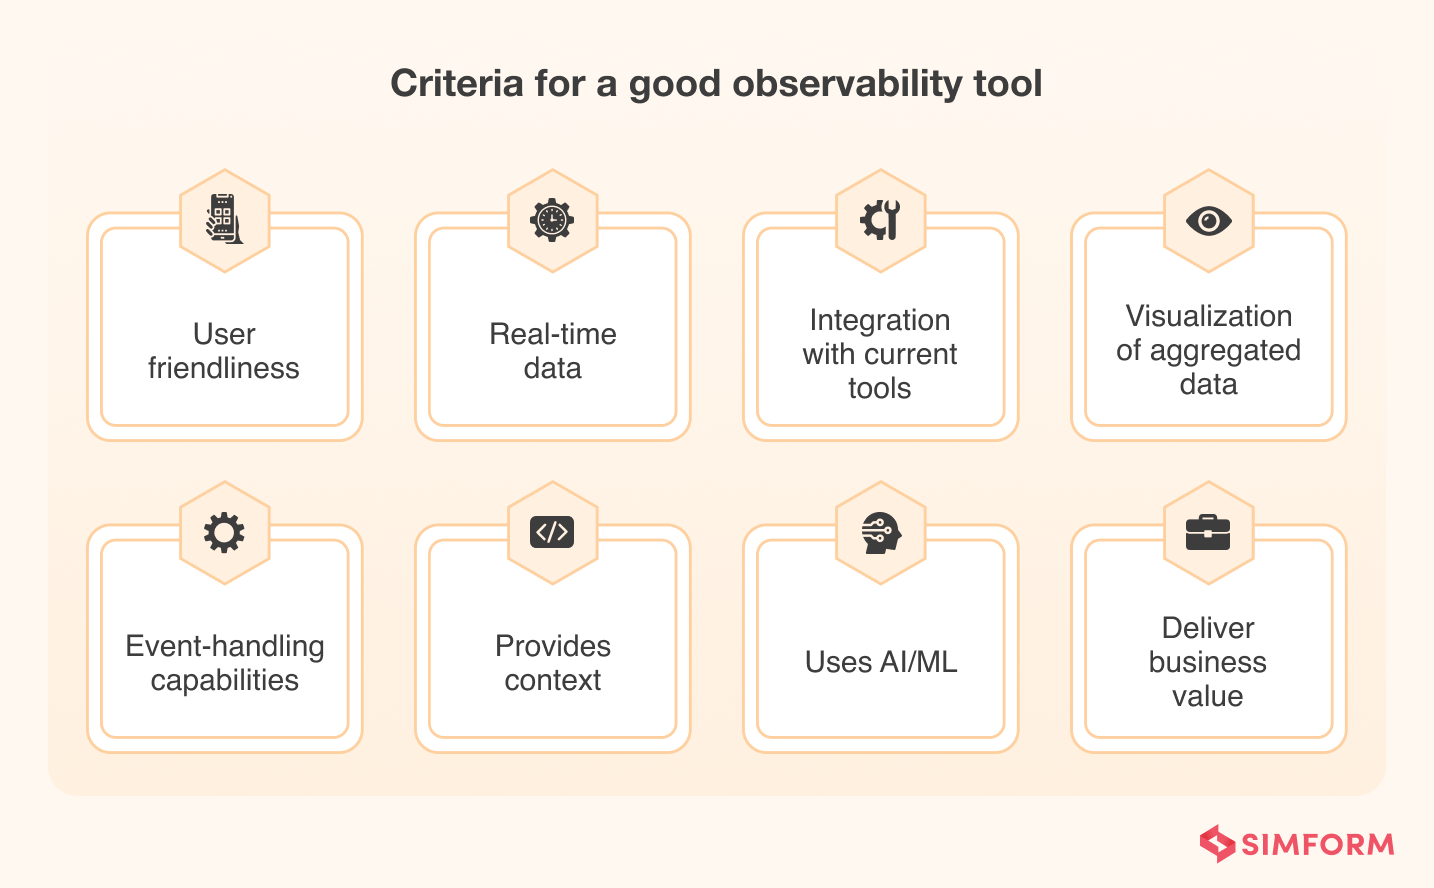
1. User-friendly: The tool should be easy to use, learn and understand.
2. Real-time data support: The software should be able to provide real-time insights via dashboards, reports, and queries.
3. Integrates with current tools: The tool should integrate with your existing ecosystem or the entire technology stack. It should support the frameworks or languages you’re using.
4. Aggregated data visualization: The tools should provide a visual representation of aggregated data in dashboards, graphs, charts, etc.
5. Support for event-handling techniques: The observability tool should collect relevant information from various sources, tech stacks, technologies, and operating environments. Furthermore, it should filter out important/unimportant information and add context.
6. Provides context: When any issue or problem arises, the observability tool should provide context to understand the root cause, its scope, interdependencies with other components, and how it has affected the system’s performance.
7. Uses AL/ML: The tool should use artificial intelligence and machine learning algorithms to automate repetitive tasks and discover patterns that help analyze the root causes of issues.
8. Delivers business value: Besides technical benefits, the observability tool should deliver business values like higher deployment speed, better system stability, and improved customer experience.
You should look for these critical criteria when selecting an observability tool. However, there are thousands of tools available on the market. So, evaluating those tools based on these criteria would be cumbersome. So, instead, we’ve developed a list of top observability tools that fit these criteria.
Top observability tools
We have developed a list of top observability tools based on the earlier requirements. You can select any of them for your ecosystem or find others according to the requirements.
| Tool | Pros | Cons |
| Honeycomb |
|
|
| New Relic |
|
|
| Dynatrace |
|
|
| Lightstep |
|
|
| Splunk |
|
|
| Datadog |
|
|
| Grafana |
|
|
The role of observability in software engineering
Observability in software engineering is a solution used by software people to monitor, understand, and maintain the overall health of software systems.
Let’s dive deeper into granular details and analyze the role of observability for various software engineering components such as microservices, containers, DevOps, and SRE.
What is observability in microservices and containers?
Observability in microservices and containers exposes system states in production so developers can detect and solve performance issues. However, microservices and containers introduce numerous independent components deployed on various hosts in a distributed infrastructure.
70% of CIOs believe tracking containerized microservice in real-time is nearly impossible. Observability tools are helpful here as they provide visibility and real-user monitoring for distributed systems and optimize the app’s performance and availability.
What is observability in DevOps?
DevOps is a methodology based on accelerated development cycles, frequent release, faster delivery, and high-quality products. Therefore, the application or product must be resilient and highly fault-tolerant to ensure quicker and more frequent releases.
Observability facilitates DevOps’ continuous delivery principle. It reduces the time to resolve issues that pertain to the system by identifying and fixing them soon.
What is observability in SRE?
SRE (Site Reliability Engineering) takes its basis on creating scalable and highly reliable software systems. To ensure reliability and scalability, you need to minimize the issues and problems related to production and infrastructure. You also need to introduce automated application monitoring procedures that reduce the time to detect errors, thereby assisting faster releases. That’s where observability fits in well, as it emphasizes system health, performance, uptime, and other issues related to the customer experience to improve reliability and scalability.
Want to make your IT ecosystem observable?
Over the years, we at SIMFORM have worked with various clients and built robust digital products for them. One such case was when we delivered a white label cloud-native solution for auctioning. As the engineering team was adding new components to the existing ecosystem, there was a need for constant cloud monitoring to detect and fix bugs quickly.
Moreover, containers, microservices, and infrastructure management made it difficult to get visibility into production. Our team adopted observability, a core part of DevOps, to identify bugs faster and resolve them in a distributed environment. It also helped the client to reduce delivery time and ensure a quicker release to market.
Making a distributed system observable is not a piece of cake. You need a skillful, knowledgeable, and experienced digital product engineering partner. SIMFORM is one of the top-rated DevOps consulting firms that help you make your software systems observable by leveraging DevOps principles to accelerate the release cycle. Collaborate with our engineering team and avail a solution that creates digital transformation for your business.