
Kubernetes is the open source container orchestration system that many companies use to run containerized workloads across hybrid cloud and on-premises environments. Dynatrace Log Management and Analytics can now maintain the complete context of your Kubernetes (K8s) architecture and platform logs.
Kubernetes workload management is easier with a centralized observability platform
When deploying applications with Kubernetes, the configuration is flexible and declarative, allowing for scalability. However, due to the distributed nature of Kubernetes, it can be difficult to understand overall deployment health and the status of Kubernetes clusters.
To properly monitor Kubernetes clusters and containers, it’s necessary to have access to relevant logs. Although K8s doesn’t provide a specific logging mechanism, the underlying container runtime collects the container logs in K8s. It makes them available for a log analytics platform to gain automated, contextual, and actionable insights into the services and underlying platforms. The complexity of hybrid environments with multiple virtual machines and cloud solutions like AWS EKS, Azure AKS, or GCP GKE with hundreds of containers and their constantly changing lifecycles creates challenges for app owners, developers, SREs, and infrastructure owners. The Kubernetes community aims to prioritize the understanding of workload health in the context of topology and provide the ability to troubleshoot deployed workloads quickly after deployment.
Managing Kubernetes application logs with Dynatrace is a seamless process
By following a few simple steps to deploy the OneAgent daemon set using Dynatrace Operator, It’s easy to collect logs and gain complete observability within the context of your topology.
It’s recommended that Kubernetes applications write logs to standard Linux streams, namely standard output (stdout) and standard error (stderr). These logs are gathered by Kubernetes and saved as files on the node. Dynatrace OneAgent® can automatically identify logs on the Kubernetes node and link them to their respective pods using the pod UID from the file path.
Furthermore, Dynatrace OneAgent enhances these logs by including Kubernetes metadata such as namespace, node, workload, pod, container, and more. More detailed information about the included metadata can be found in Dynatrace Documentation.
This additional metadata helps link logs with the entity models of Kubernetes clusters, namespaces, workloads, and pods. Logs can then be located in the Kubernetes entity model on the Dynatrace platform, enhancing the observability of your infrastructure and workloads.
Dynatrace OneAgent has an internal mechanism that ingests only necessary log data. Within your Dynatrace tenant, various options are available for filtering logs at the source, masking sensitive data, and selecting relevant logs by matching Kubernetes-specific values such as K8s container name, K8s deployment name, and K8s namespace name. You can filter logs based on their content, source, or process technology.
With these built-in mechanisms, you can control the ingested log sources and the associated monitoring costs.
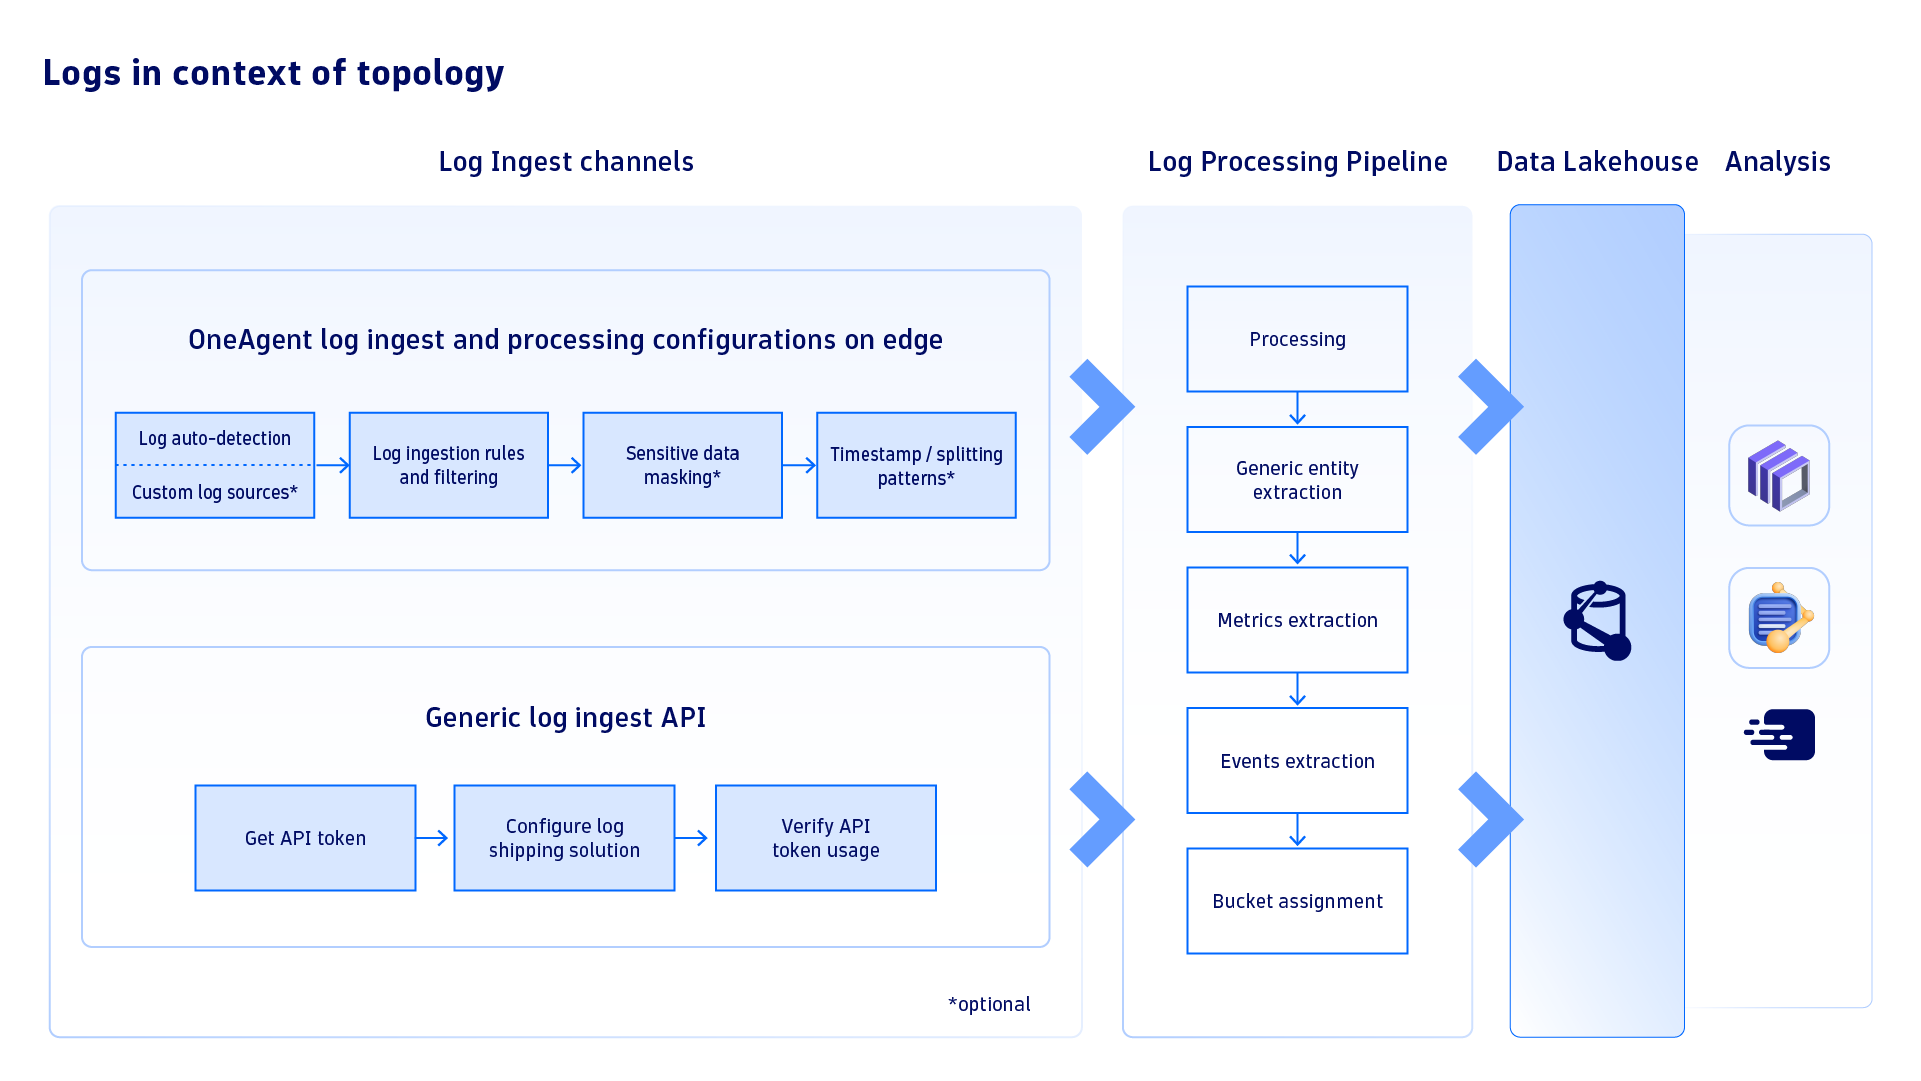
If a log shipping solution is already in place, such as Fluent Bit, Fluentd, or Logstash, it’s possible to utilize the Logs Generic Ingest API endpoint to easily send and analyze logs in Dynatrace. This feature is readily available on both the Dynatrace tenant and Environment ActiveGate. It’s also a great option for situations where an application writes logs inside pods or if serverless k8s deployments, such as AWS Fargate, are utilized.
Gain log visibility within Kubernetes workloads: a practical example
Dynatrace provides out-of-the-box alerting for K8s clusters and workloads by leveraging Dynatrace Davis® AI. In the example below, Dynatrace detected unexpected out-of-memory kills for pods of a workload called cartservice in the namespace online-boutique.
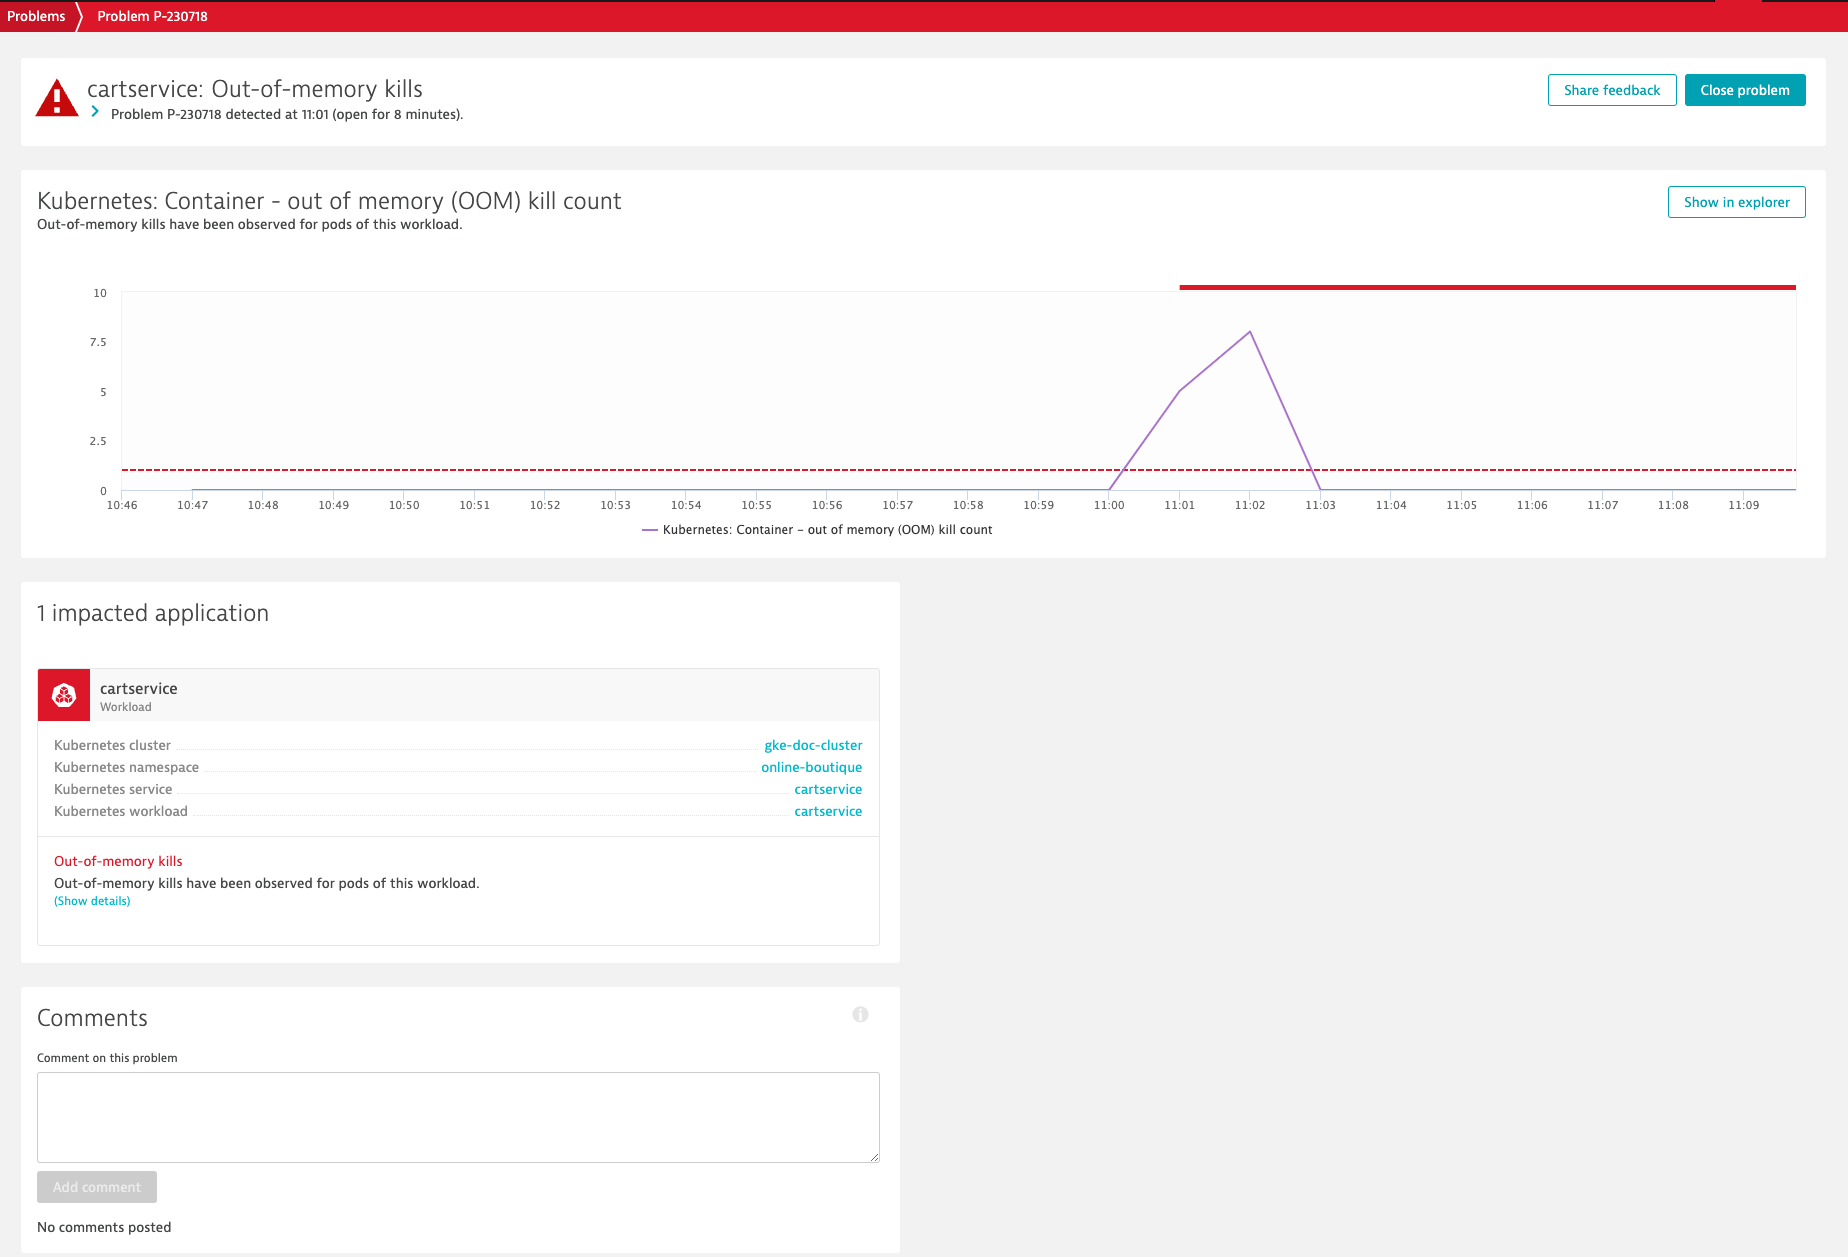
As Dynatrace provides all observability signals in context, troubleshooting can easily be conducted in the context of the respective Kubernetes workload, which drastically reduces the time required to pinpoint the root cause of issues.
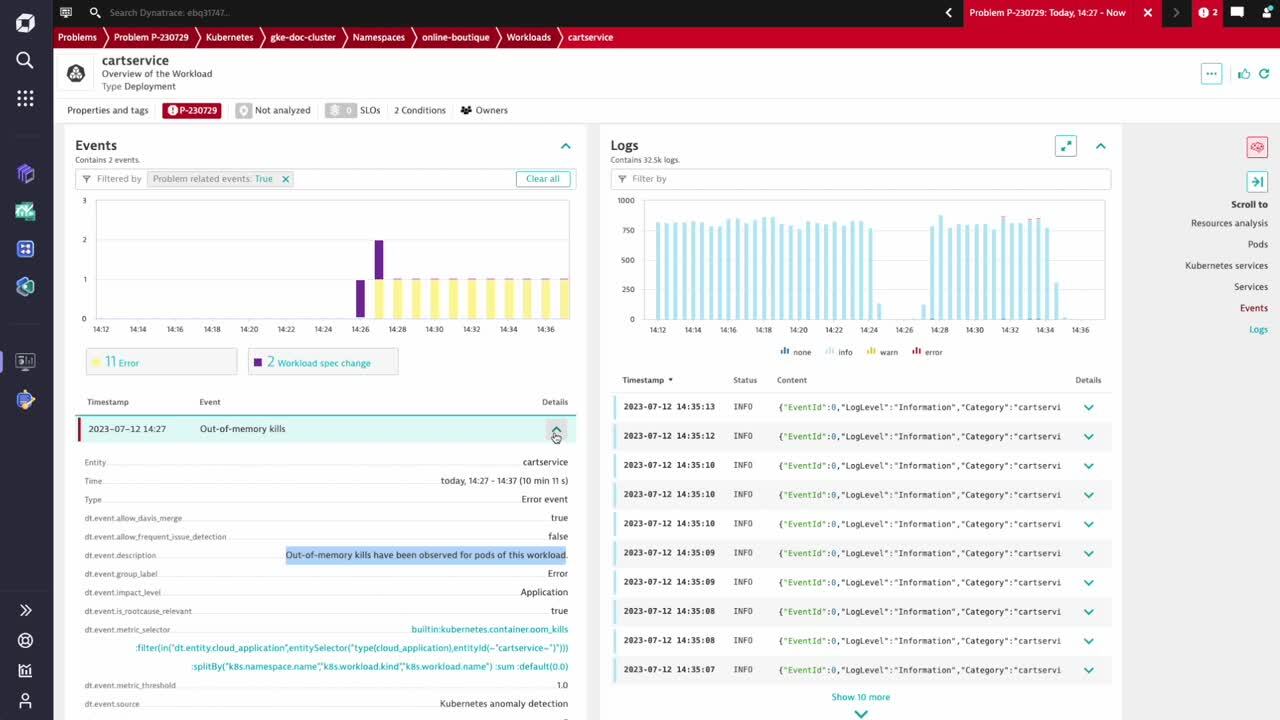
In this example, the root cause can easily be determined by further analyzing the Kubernetes events and logs for the cartservice workload. Davis AI automatically detected out-of-memory kills, and the specification of this workload was changed within the most recent deployment release.
Error logs provide further valuable insights
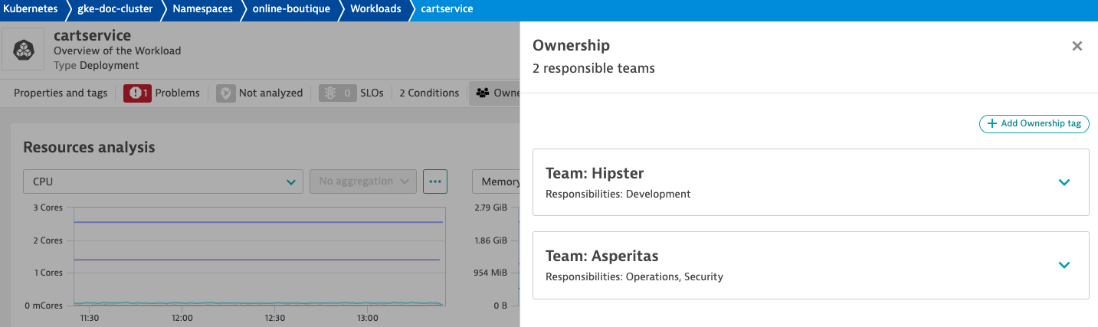
As the Redis port was modified, the cartservice is no longer able to connect to the Redis instance, which led to out-of-memory kills for this workload. To fix this problem and minimize MTTR, we can immediately reach out to the team in charge of this workload by leveraging ownership information from this workload. This process can easily be automated for different types of problems.
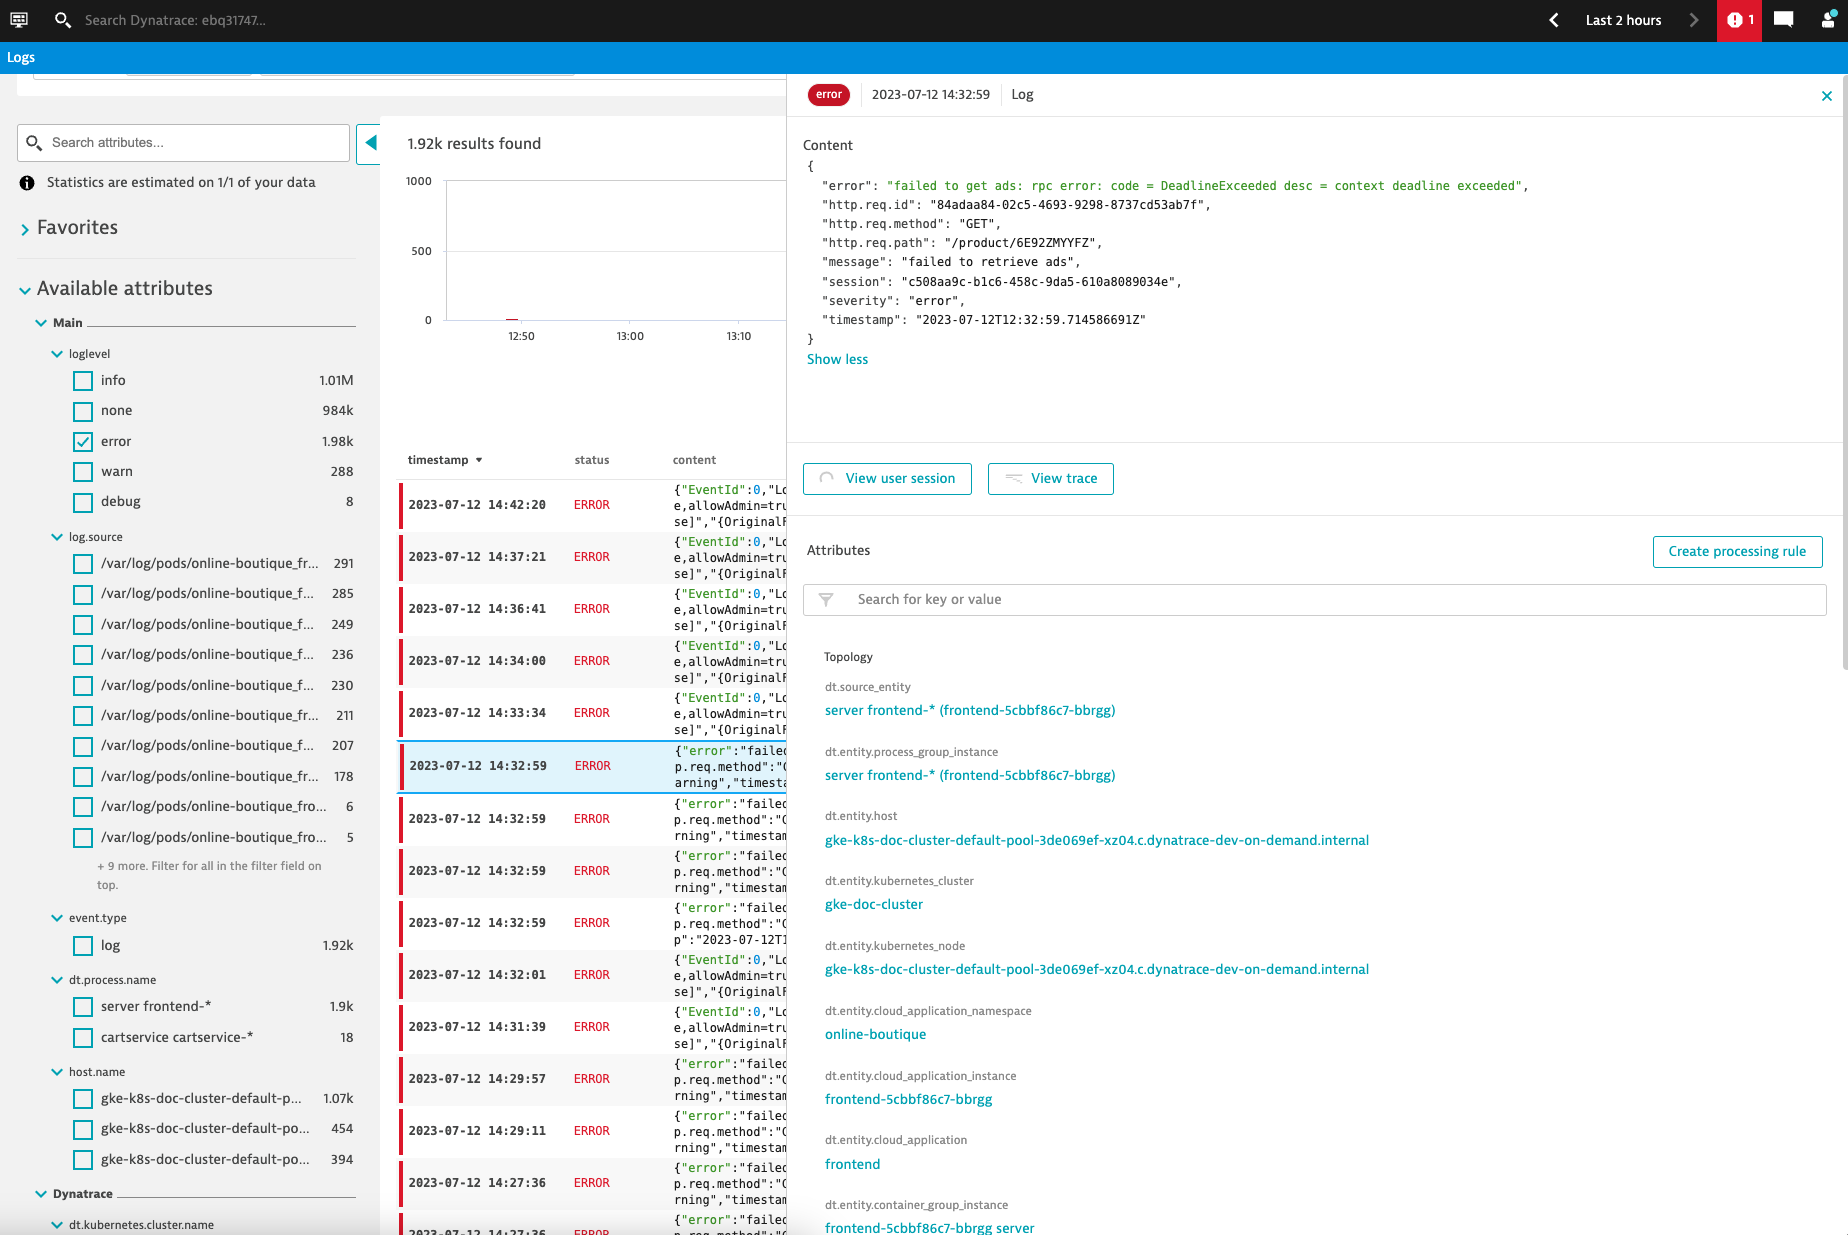
In addition, Dynatrace offers powerful log analytics in the Dynatrace Log Viewer. You can drill down by K8s cluster, namespace, workload, pod, or filter for a certain severity level or log pattern, just to name a few examples. Every log line is enriched with Kubernetes metadata and, if you use Dynatrace Application Observability and/or Real User Monitoring, each log line is automatically linked to traces and/or user sessions to provide end-to-end observability in context.
Begin your logging journey effortlessly at scale
Analyzing log data is crucial to avoiding potential release issues, allowing you to take proactive measures to prevent any negative impact on users. To get started, just dive into the documentation!
Please share your feedback and comments in the Dynatrace Community. Kubernetes support requirements are reflected in our roadmap with items like Kubernetes labels support, which will help you manage your environment in Dynatrace the same way you manage your Kubernetes cluster, and our planned investments related to short-living pods and K8s serverless cloud deployments.


Looking for answers?
Start a new discussion or ask for help in our Q&A forum.
Go to forum