
Your cloud logs can provide the root cause of high-impact issues or reveal the details of security incidents. Now, you can integrate an Amazon Data Firehose high-frequency data stream directly with the high-performant Dynatrace Grail™ analytics engine and use the Dynatrace AI-powered observability platform to mitigate issues with minimal impact to your business.
Real-time streaming needs real-time analytics
As enterprises move their workloads to cloud service providers like Amazon Web Services, the complexity of observing their workloads increases. Log data—the most verbose form of observability data, complementing other standardized signals like metrics and traces—is especially critical. As cloud complexity grows, it brings more volume, velocity, and variety of log data.
Managing this change is difficult. Without the ability to see the logs that are relevant to your service, infrastructure, or cloud function—at exactly the right time and in exactly the right format—your cloud or DevOps engineers lose the ability to find the root causes of the issues they troubleshoot. Even the AIOps approach doesn’t cut it if you don’t have proper logs in your observability platform.
Amazon CloudWatch is the most common method of collecting logs across your AWS footprint. As a native tool used by many enterprises, CloudWatch supports a wide range of AWS resources, applications, and services.
Amazon Data Firehose helps stream logs to the right destination
But your SREs and DevOps engineers know CloudWatch is not the terminal destination for data but rather an intermediate station. Their job is to find out the root cause of any SLO violations, ensure visibility into the application landscape to fix problems efficiently and minimize production costs by reducing errors. SREs and DevOps engineers need cloud logs in an integrated observability platform to monitor the whole software development lifecycle.
When trying to address this challenge, your cloud architects will likely choose Amazon Data Firehose. This fully managed native service is indispensable for streaming high-frequency logs collected by CloudWatch.
In some deployment scenarios, you might skip CloudWatch altogether. Take the example of Amazon Virtual Private Cloud (VPC) flow logs, which provide insights into the IP traffic of your network interfaces. VPC flow logs can be used as the source for troubleshooting connectivity issues, implementing security incident investigations, detecting intrusions, or managing access control issues. VPC flow logs can be massive in volume as your cloud deployment footprint grows, and directly streaming these logs with Amazon Data Firehose can be the most cost-effective method.
After configuring Amazon Data Firehose, your teams discover they have completed only the first part of the observability jigsaw puzzle. They also need a high-performance, real-time analytics platform to make that data actionable.
Direct link from AWS to Dynatrace
Dynatrace delivers the missing piece for AWS cloud observability with native Firehose integration. This complements our existing AWS logging integrations like S3 log forwarder, Lambda layer log forwarding, or direct log ingest API. These already provide a common integration with AWS log sources. The new Firehose integration removes intermediary components that previously required additional maintenance and provides a direct link from AWS to Grail data lakehouse.
This means high-frequency streamed logs from Firehose can be captured in your Dynatrace environment, automatically processed, stored in Grail for the retention period of your choice, and included in the full observability automation suite of the Dynatrace® platform, apps, and Davis® AI problem detection.
With this out-of-the-box support for scalable data ingest, log data is immediately available to your teams for troubleshooting and observability, investigating security issues, or auditing. As logs are first-class citizens alongside traces, metrics, business events, and other data types, you have an observability platform ready to scale with you in your cloud-native journey.
Easy setup takes just a few steps
Setting up a direct ingest of Firehose log data is quick and easy.
First, you need to generate an API key to ingest logs. In the Dynatrace web UI, go to Access tokens and select Generate new token. Select ingest logs as the scope of the token. Then, generate the token.
Next, go to the AWS console to configure the forwarding of data streams defined in your log groups. Data Firehose stream requires a trusted relationship with CloudWatch through an IAM role. Follow the instructions available in Dynatrace documentation to allow proper access and configure Firehose settings.
Now, you can set up your Firehose stream. The preferred way is to use a CloudFormation template that streamlines and automates the process. See CloudFormation template documentation for details.
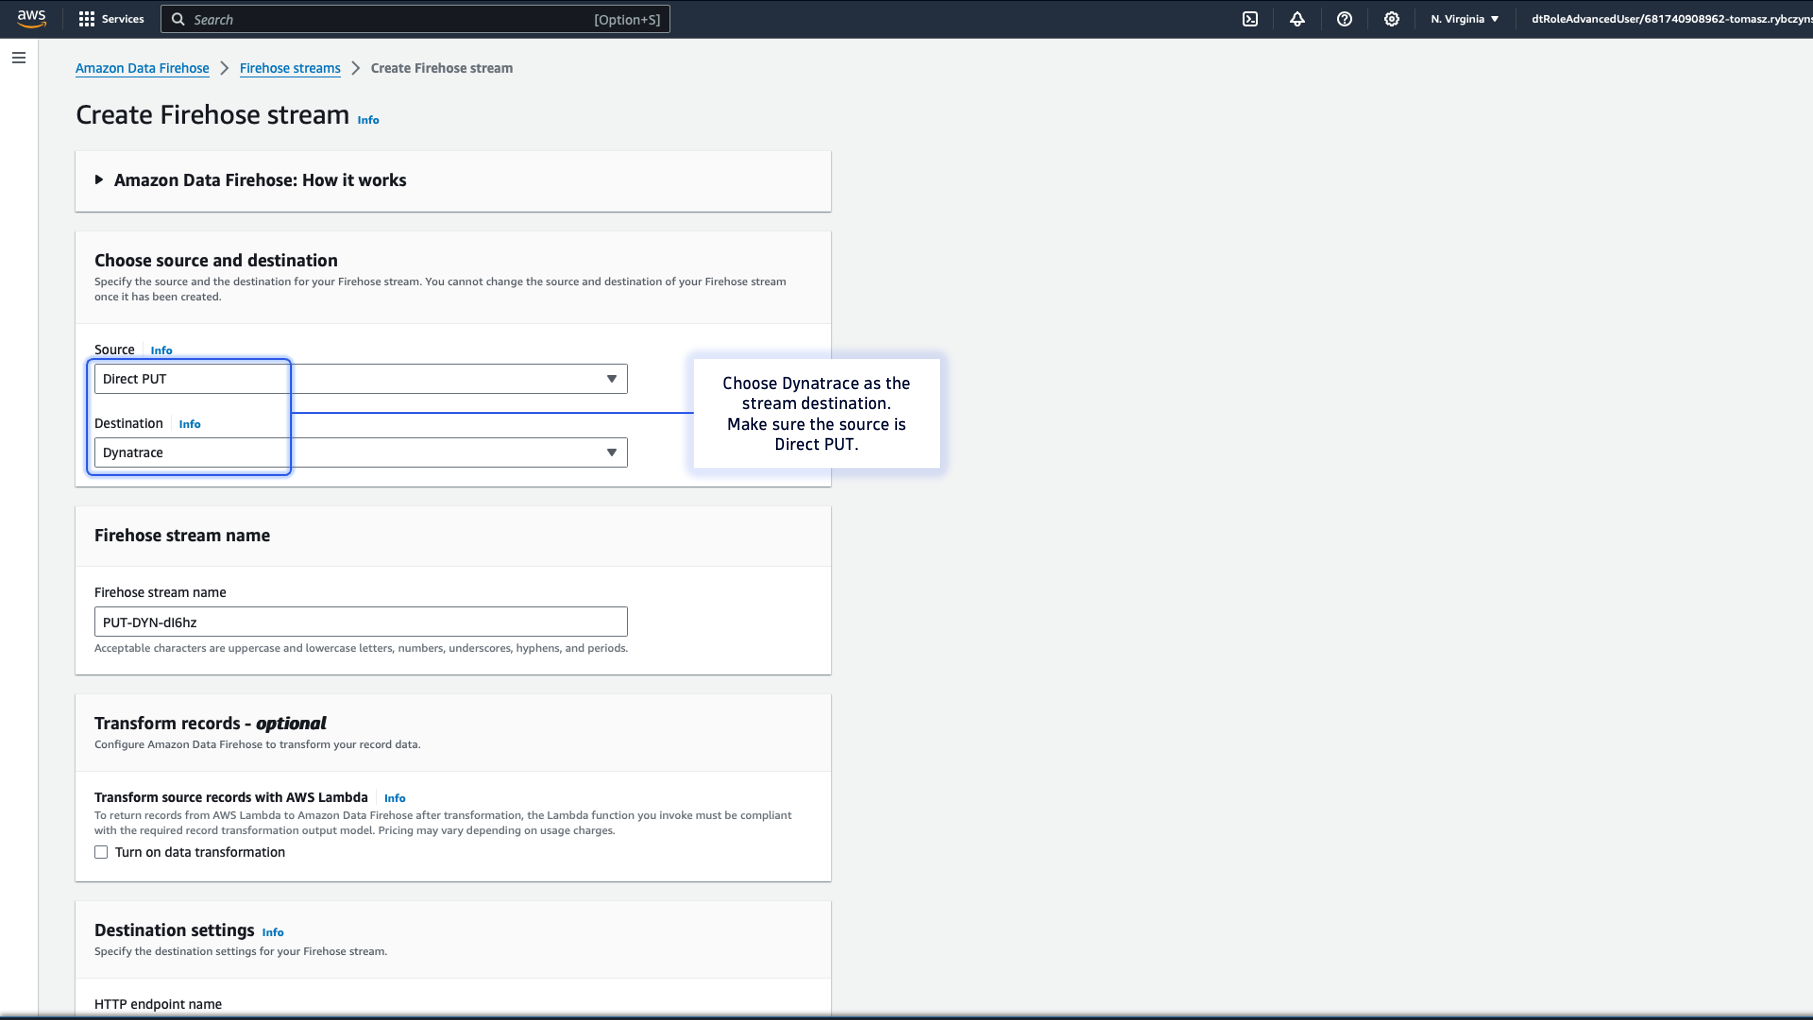
Alternatively, you can configure the stream in the AWS web console. Choose Dynatrace as the Destination in the AWS console and complete the other fields with the correct parameters. See AWS Console documentation for the full list of parameters.
Now, you can view your cloud logs in Dynatrace!
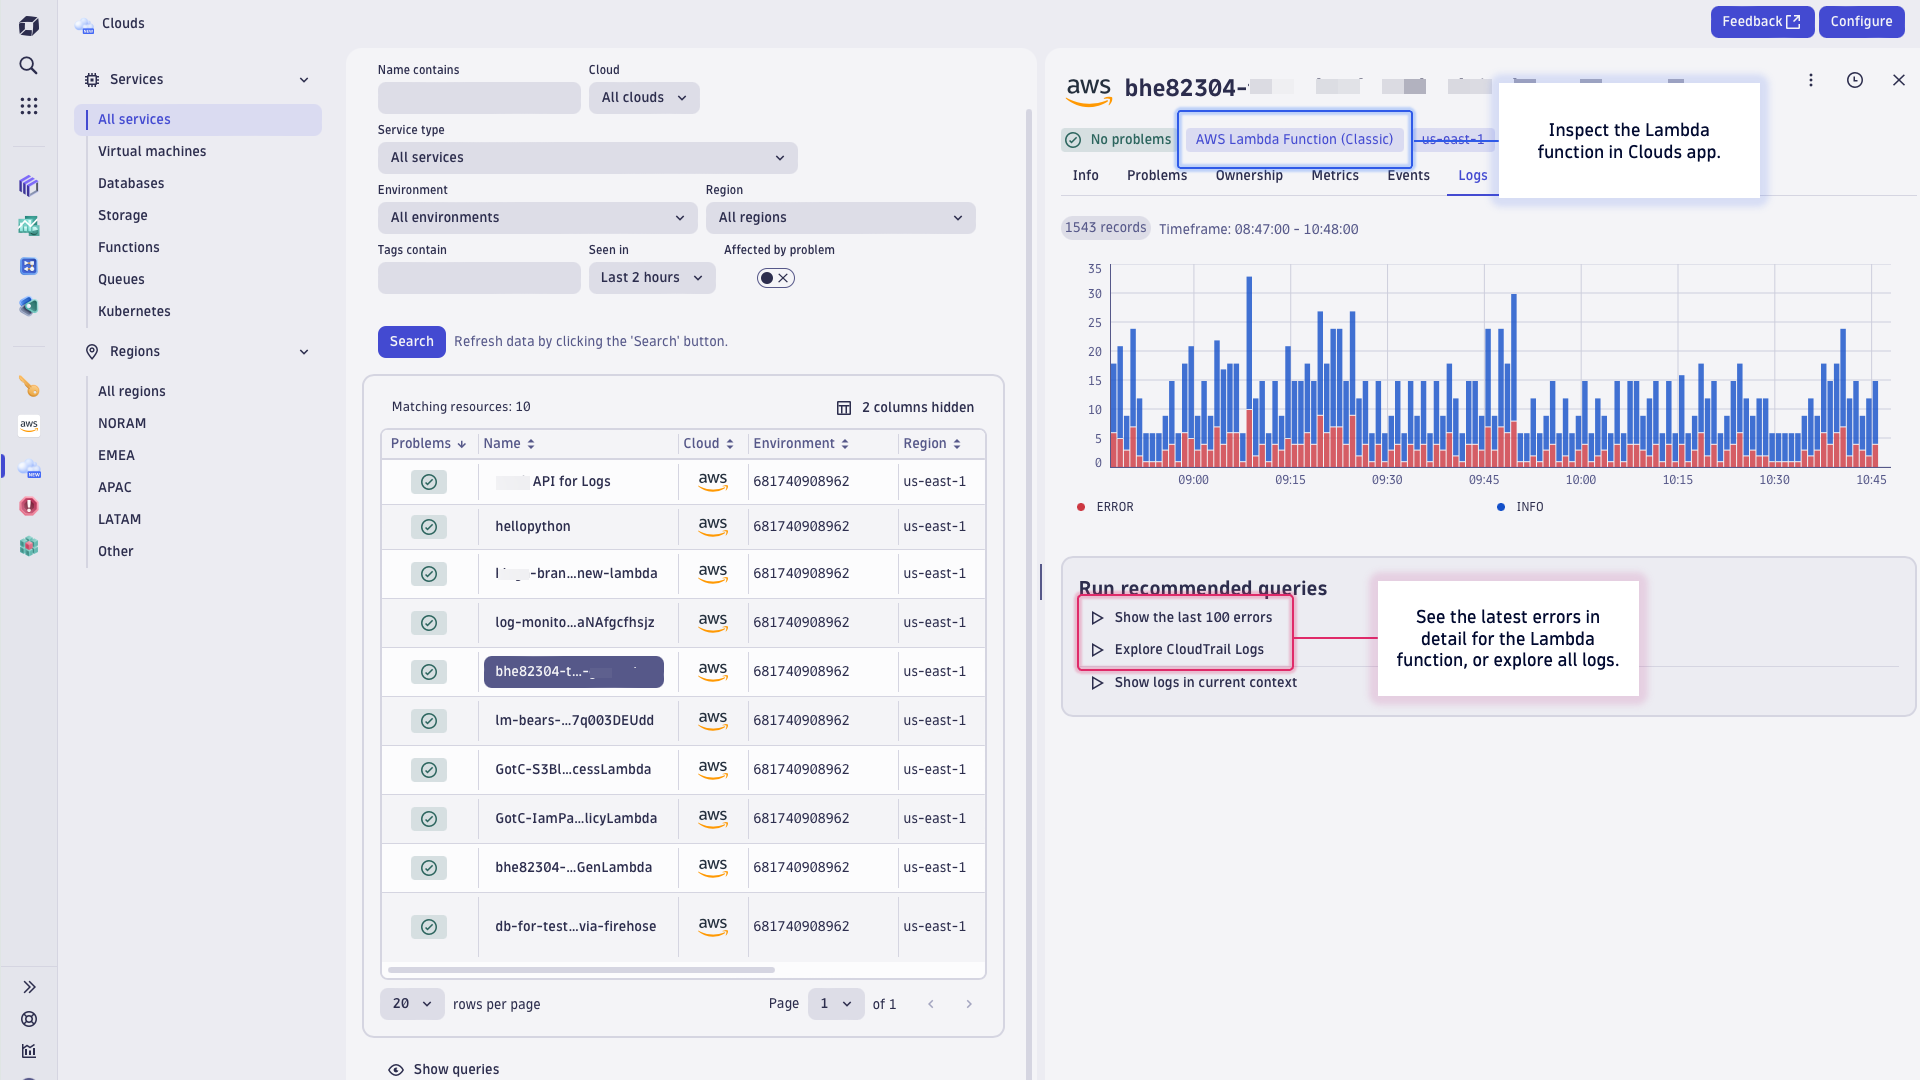
For example, open the Clouds app with integrated logs in the context of your Lambda functions observability for one-click access to error logs.
When Dynatrace Davis AI detects a problem in your environment, you can also see relevant logs streamed via AWS Firehose that are related to the problem. When analyzing a problem, look at the related service, which displays related log data. This lets you jump right to the error that provides details of the problem.
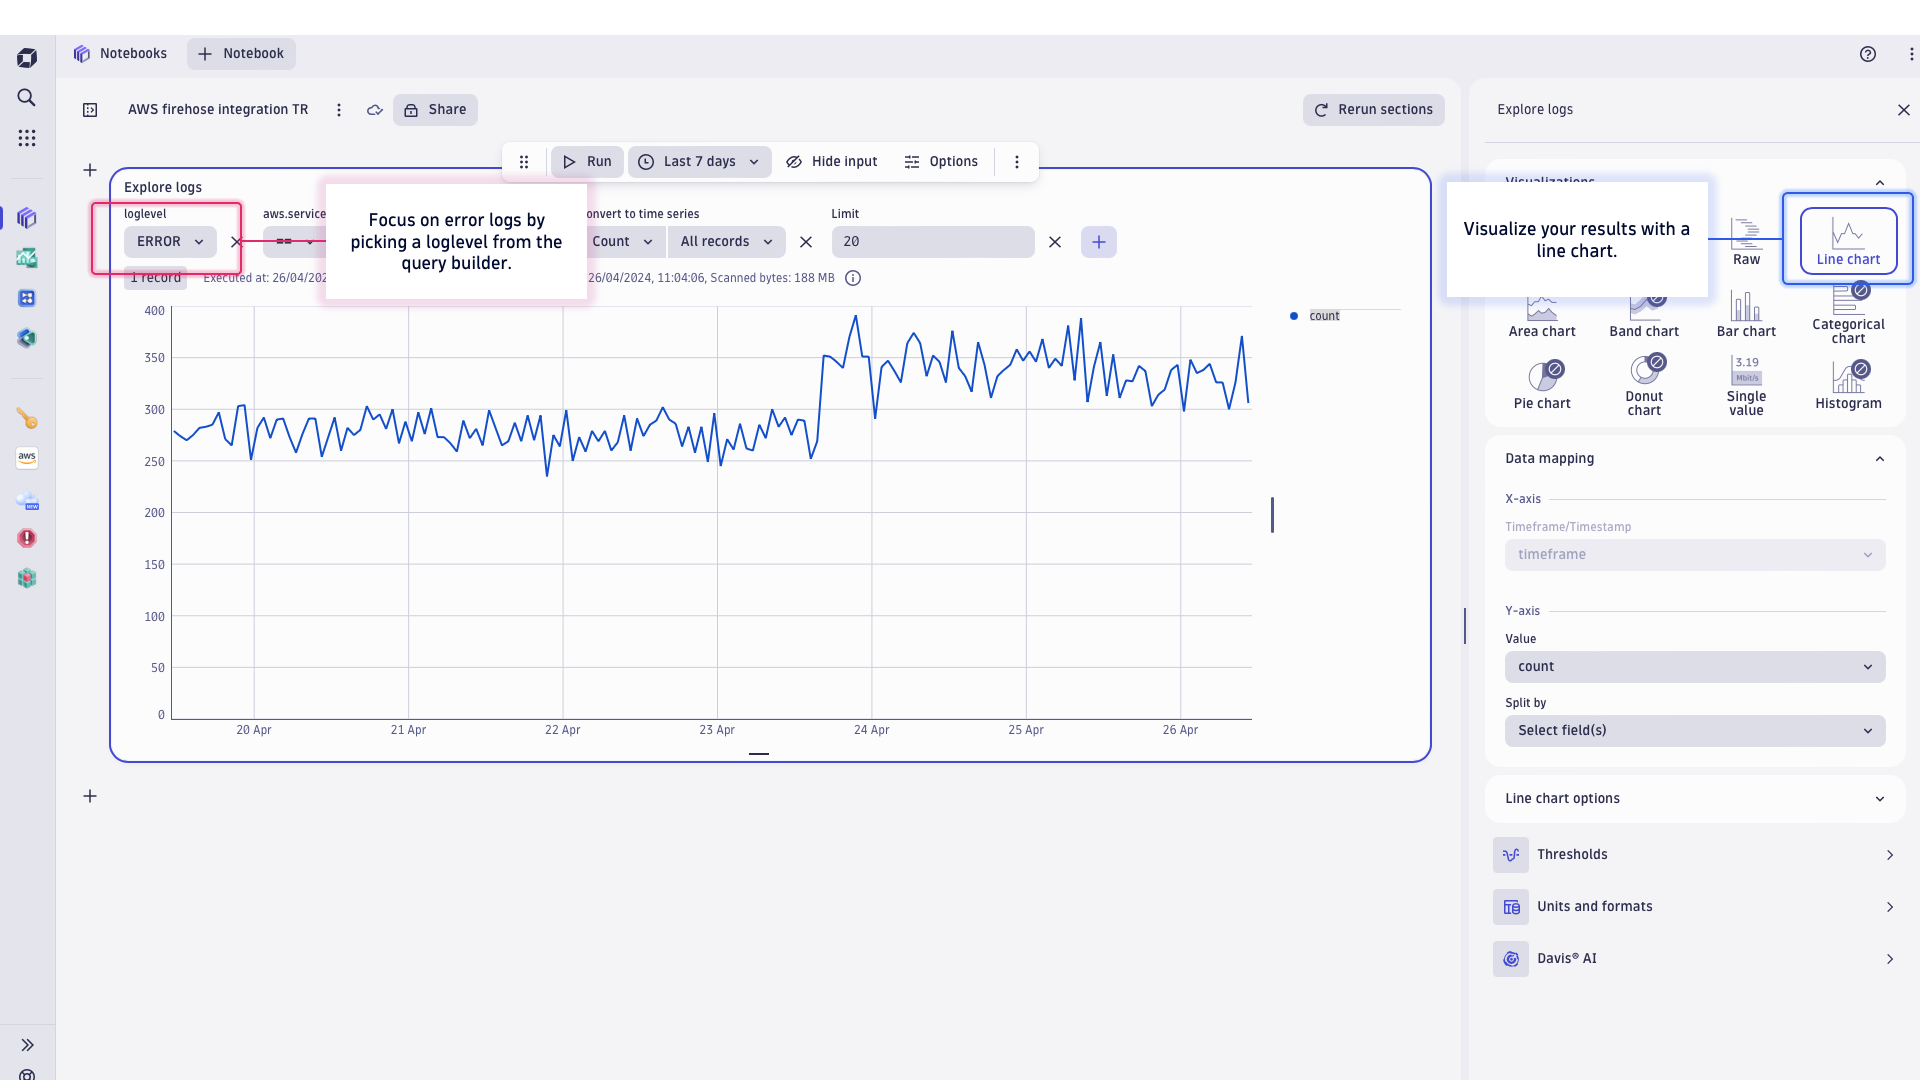
When doing proactive health checks or analysis, you can inspect log data in Notebooks. For example, pick a template to explore data or write your own DQL query and chart incoming error rates from logs streamed via AWS Firehose.
Try it out today
- Direct integration with Amazon Data Firehose is generally available in Dynatrace version 1.290 for Dynatrace SaaS (Log Management and Analytics) and Dynatrace Managed (Log Monitoring Classic).
- Read the Dynatrace SaaS documentation for streaming logs via Amazon Data Firehose (or see our Dynatrace Managed Documentation).
- Need to support an alternative cloud log setup? Explore these other integrations:
Share your experience
We’d love to hear from you. Share your use cases for Amazon Data Firehose integration with the Dynatrace Community.


Looking for answers?
Start a new discussion or ask for help in our Q&A forum.
Go to forum