
Across all industries—from health care and finance to retail and professional services—Service Level Objectives (SLOs) help teams work toward a common goal.
This blog post is for both novice and seasoned audiences alike. If you’re interested in the relevance and utility of SLOs and how they might be helpful for you, you’ve come to the right place.
The first part of this blog post briefly explores the integration of SLO events with AI. The second part delves into the approach to be adopted with SLOs based on a client’s context and environment, considering whether SLAs (Service Level Agreements) have already been historically defined. Finally, this post addresses the practical aspects, focusing on cultivating the right leading indicator instincts for problem detection through SLOs and extracting their full value to meet business and functional requirements.
Strategic approach to root cause detection
Two frequently used SLOs are the Apdex score and failure rate. For a more proactive approach and to gain further visibility, other SLOs focusing on performance can be implemented.
Every problem identified through Dynatrace Davis® AI indicates an issue with potential user impact. However, understanding the precise impact on the end user can be challenging. For instance, consider how fine-tuning failure detection can provide insights for comprehensive understanding.
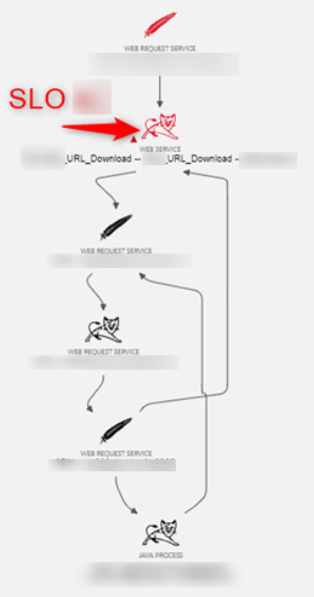
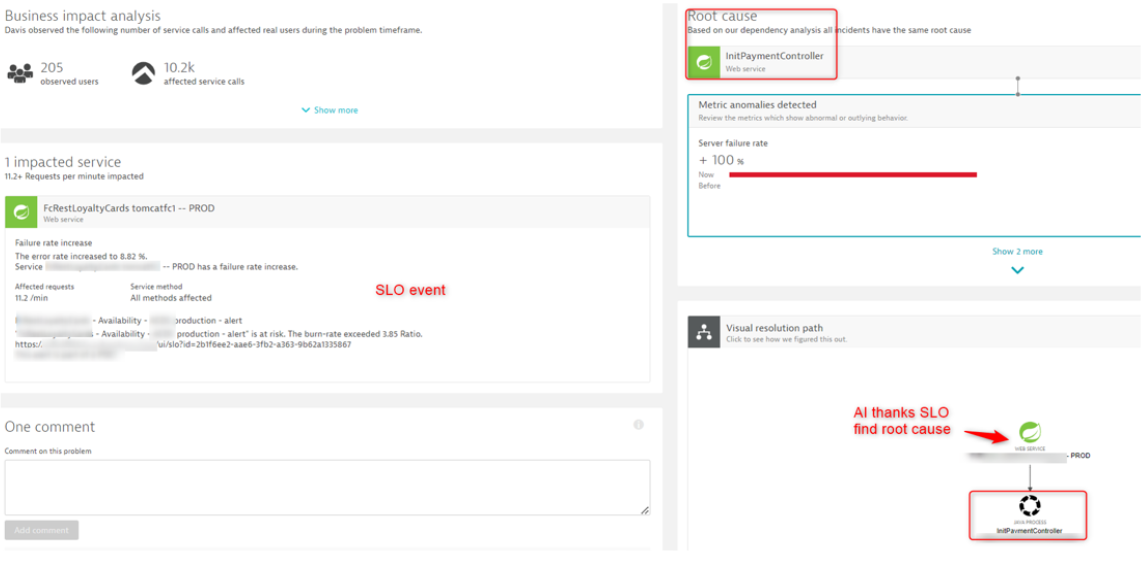
Davis AI uses Dynatrace Smartscape® topology to map out the application chain. As a result, the AI operates on the related events and detection parameters (threshold, period, analysis interval, frequent detection, and so on) an issue represents. Using an SLO, you can target the desired entity and map the incoming and outgoing interactions against it.
For example, envision an apple tree that drops an apple. Can the AI discern exactly where and when the apple dropped? And what caused the apple to fall? Was it the wind, a natural progression, a leaping cat, or something else entirely? Likewise, what is the result of the apple falling? Did it split open on the ground or dent a car?
These conditions are pivotal for pinpointing the root cause and facilitating an expansion of the AI’s detection capabilities by incorporating statistical and forecasting models. Consequently, we recognize the value in augmenting AI capabilities through a Dynatrace generative AI model that incorporates user feedback, enhancing its functional dimension.
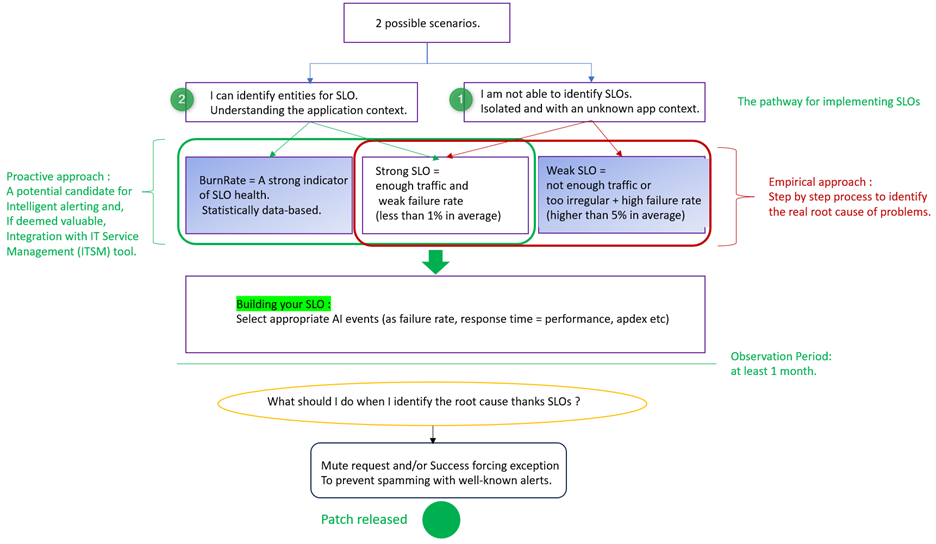
Further in this article, we will explore which empirical approach to adopt in order to best align with the service-level objectives (SLOs). Specifically, we can initially divide the approach into two parts. We either know the entities to apply the SLO, or we don’t.
Which approach should you take?
SLO methodology is based on empirical approaches with some catalyzers. The approach we will adopt for implementing SLOs follows the diagram illustrated below. Either you have no immediate functional or business visibility (path 1), and you will implement your initial SLOs, or you have business assistance (path 2) and can strategically position your SLOs in key areas.
There are two possible scenarios: You either have defined SLAs, or you do not.
This approach can be accurately validated through empirical means. From my experience, a month of monitoring is the optimal duration to gain statistically significant insights into “how my entity behaves with the configured SLO.” Consequently, by understanding the intricacies involved, this enables us to swiftly confirm or refute the functional/business case of the business teams involved, including project managers, top management, developers, and tech leads.
Path 1: SRE is siloed and lacks familiarity with the instrumented application.
The suggested approach involves utilizing Frontend SLOs to swiftly draw attention to business-related issues. This method generates interest and prompt action by promptly highlighting pertinent business concerns.
Next, a pragmatic approach involves examining the backend, focusing on Service type entities prominently exposed to the frontend (for example, Apache Tomcat in a Linux environment). Additionally, meaningful functional names should be considered, and the number of calls (throughput) should be analyzed for applying Service Level Objectives (SLOs).
Path 2 (easier): I’m familiar with my application and the development team.
The recommendation emphasizes promptly adopting Backend Service Level Objectives (SLOs). In today’s landscape, we lack a clear understanding of properly creating frontend SLOs (for example, RUM application type entities) based on key user actions. Often, businesses find themselves in disagreement or simply lost. The most user-friendly and effective approach to pinpointing weaknesses involves establishing a “Service SLO” (dt.entity.service, the “backend”). Given that the implementation of backend SLOs is generally better understood by the business/development and allows for a straightforward and rapid placement of SLOs on services, controllers, or APIs that are generally comprehensible to the in-house developers of the client. That said, the guiding thread, predominantly under the client’s control, remains the backend perspective. In other words, where the application code resides.
However, it’s essential to exercise caution: Limit the quantity of SLOs while ensuring they are well-defined and aligned with business and functional objectives. For example, in a specific application type like e-commerce, select significant Service names (such as Basket, CardPayment, or UserController).
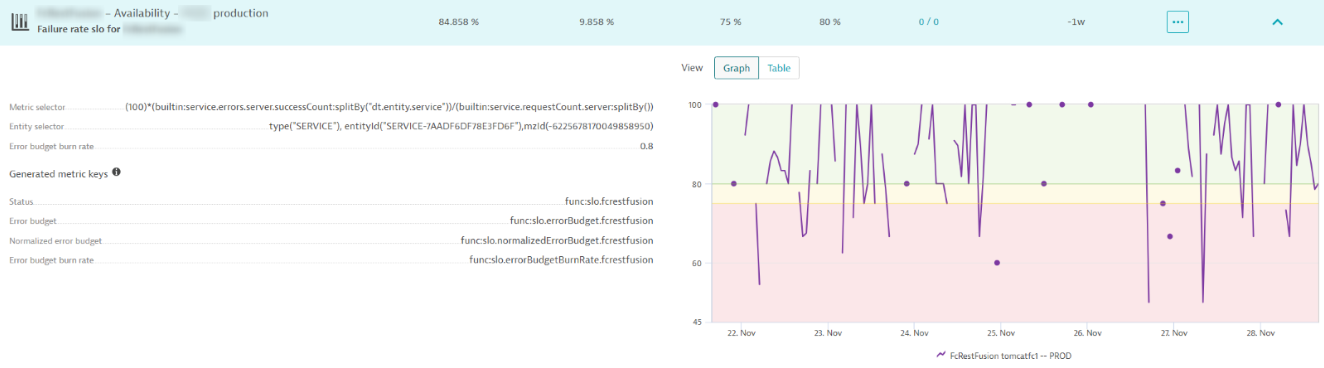
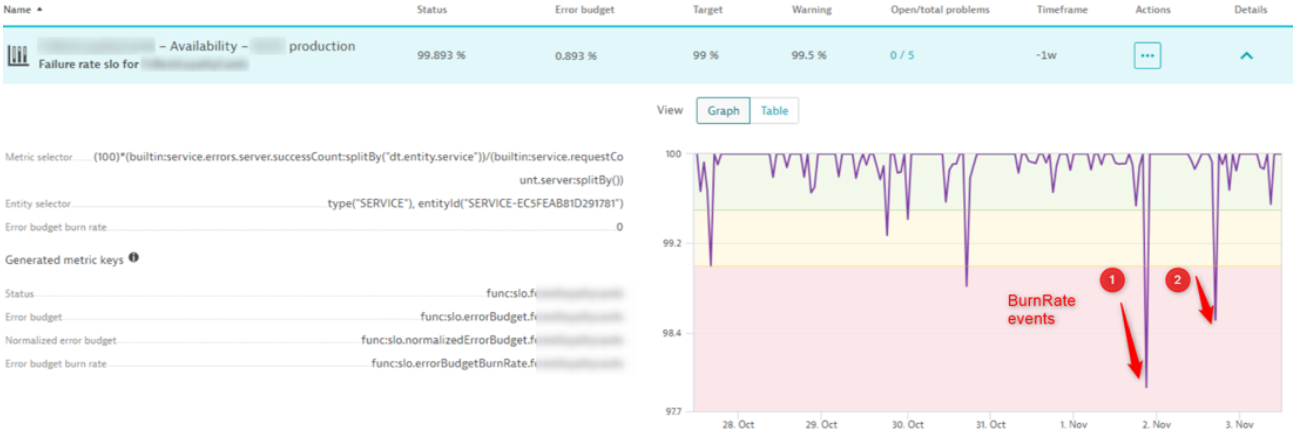
When the SLO status converges to an optimal value of 100%, and there’s substantial traffic (calls/min), BurnRate becomes more relevant for anomaly detection.
What characterizes a weak SLO?
Let’s assume we created a service-availability SLO, monitoring the request failure count against the overall request counts. Now, let’s try to explain what the reasons for no AI detection could be related to this SLO event
AI does not correctly detect that two relevant criteria are involved in disadvantaging AI detection:
When the status of the SLO falls below the specified target by a certain threshold (for example, below 90%), it signifies a failure rate event, indicating an average error rate of 10%.
This implies that when the status is unfavorable, implementing sophisticated alerting methods like error budget burn rate alerting presents challenges and is therefore not applicable. Bad status indicates constant violations of the threshold, akin to the state of a broken door that requires fixing before defining the Service Level Objective (SLO).
For instance, if we maintain an average SLO status of 80%, indicating an average error rate of 20%, utilizing the error budget burn rate in this scenario might be challenging. A simple ratio of 2 implies a 40% error rate, a situation that rarely occurs unless there’s a service interruption leading to observed consequences.
Therefore, these considerations outline two types of coupling for the SLO: Rapid adoption of backend SLOs and cautious application of error budget burn rate alerting, aligning with the traffic and error rate observations for effective anomaly detection.
When there isn’t enough traffic (requests/min) for an SLO
Detection becomes sporadic, resulting in insufficient data points for establishing the sampling interval necessary for generating “Event duration.”
This necessitates a subsequent description of how we should apply default transformation in this specific case, only if this SLO is deemed worthy of tracking.
Strong SLOs
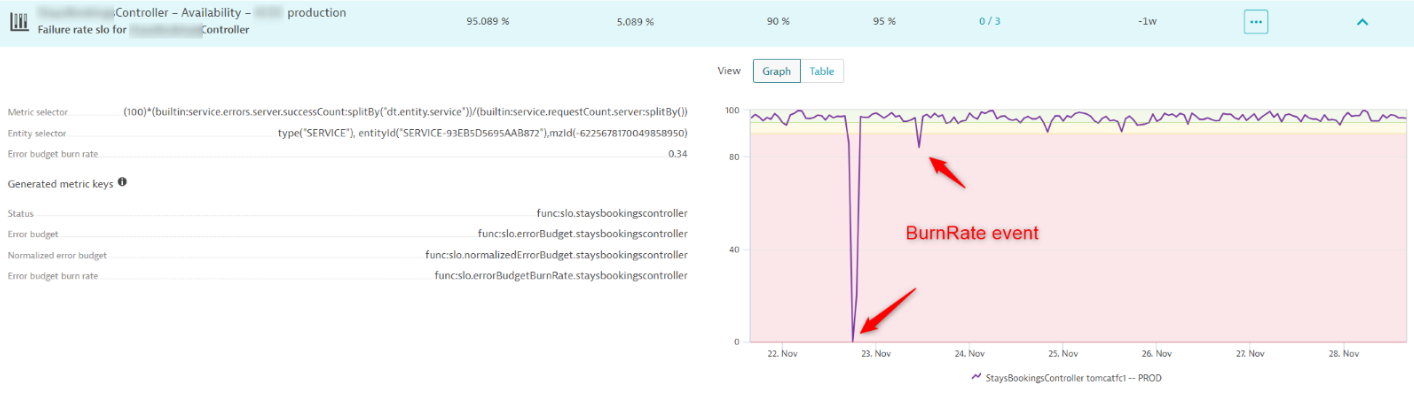
With a view to becoming highly sensitive to detection and adopting a proactive approach, we need to fulfill this condition. If we have constant traffic (meaning sufficient data points to feed the entity) and an averaged baseline, thus exhibiting a regular trend, then it would be easier to detect significant deviations from the behavior of the entity. Therefore, configuring SLOs for this type of entity is considered “strong”, and the error budget burn rate makes sense in detecting these deviations. This proactive stance allows us to maximize our focus on the actual impact experienced by the end user in real time. See the following example with BurnRate formula for Failure rate event.
Error budget burn rate = Error Rate / (1 – Target)
Best practices in SLO configuration
To detect if an entity is a good candidate for strong SLO, test your SLO. SLOs must be evaluated at 100%, even when there is currently no traffic.
If the targeted entity is validated as relevant for the SLO and occasionally experiences a lack of traffic, then using the “default” transformation in the SLO expression is advisable to prevent misleading SLO status!
Use the default transformation.
This example shows the SLI of a performance SLO, targeting response times/loading times of a key-user-action/DOMload.
((
(builtin:apps.web.action.domInteractive.load.browser
:splitBy("dt.entity.application_method")
:avg
:filter(and(or(in("dt.entity.application_method", entitySelector("type(~"APPLICATION_METHOD~"),entityId(~"APPLICATION_METHOD-XXX~")")))))
:partition("perf",value("good",lt(100)))
:splitBy()
:count
:default(0))
/
(builtin:apps.web.action.domInteractive.load.browser
:splitBy("dt.entity.application_method")
:auto
:filter(and(or(in("dt.entity.application_method", entitySelector("type(~"APPLICATION_METHOD~"),entityId(~"APPLICATION_METHOD-XXX ~")")))))
:splitBy("dt.entity.application_method")
:count
:default(1)
))
:default(1)
*
(100))
The outer default(1) is employed in this context to specify how any data should be handled. This assumes that if there’s an absence of data, the Service Level Objective (SLO) must be assessed at 100%. This approach prevents the truncation of the SLO health state in cases where no data is received, ensuring that the SLO status remains intact even without data.
- Data Explorer “test your Metric Expression” for info result coming from the above metric.
Following the previous metric (above) used for the SLO, the threshold employed is an average of 100 ms for the Key Performance Indicator (KPI) of DOM Interactive.
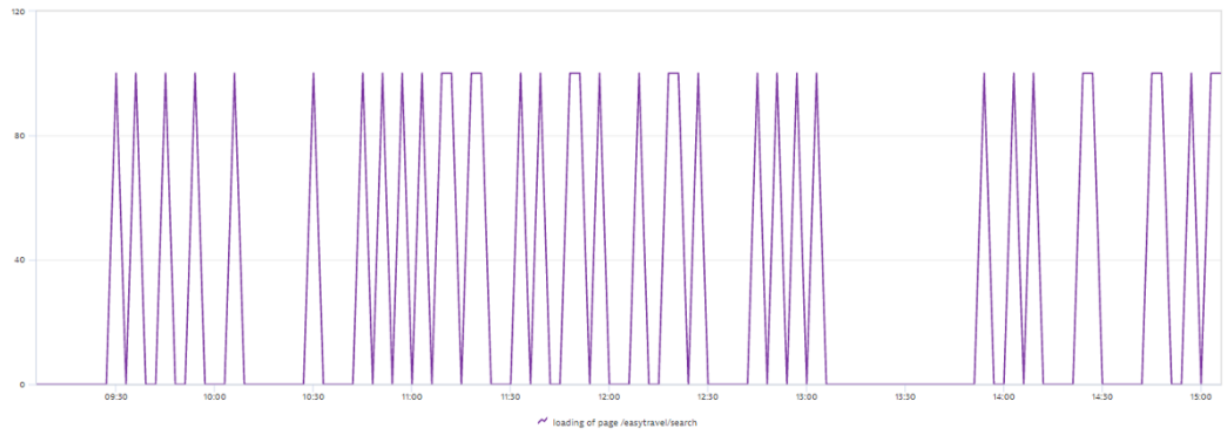
If this threshold is exceeded during THE test within Data Explorer, I will have the tendency or a preemptive glimpse of the impending alert. This allows me to anticipate the threshold and future adjustments to the alert taken by the SLO. In other words, the peaks here indicate that the condition of the SLO is met, resulting in a status of 100%, meaning we adhere to the set threshold. Outside of these peaks, the threshold is violated! On the other hand, if the threshold is violated, it decreases the error budget.Spikes indicate that the conditions for meeting the Service Level Objective (SLO) are fulfilled. However, the gap and space between these impactful SLO statuses, on the other hand, contribute to an increase in the error budget. - Service type (General Parameters Exceptions / mute request)
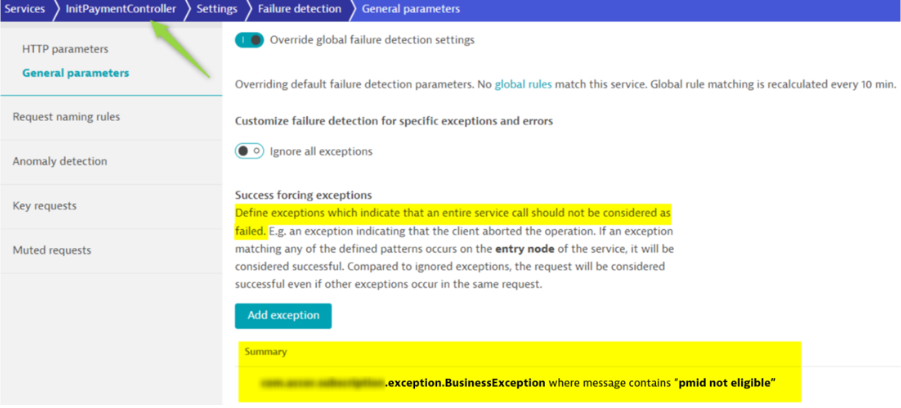
To maintain SLO integrity, we employ various strategies, such as muting requests, ignoring certain elements, or enforcing exceptions only when a problem is identified. This approach ensures that SLO degradation is prevented unnecessarily, with the aim of preserving performance until a patch release can be implemented.
As mentioned earlier, it is necessary to have a minimum observation period to determine the SLO behavior of a targeted entity. It is reiterated that the positioning of this SLO includes the selection of strategic factors (entity positioning within the application architecture = ServiceFlow, sufficient traffic in requests per minute, etc).
During this observation phase, business stakeholders will quickly validate this case and thus define a waiting period for the implementation of the application fix. It is understood that during this waiting period, we will mute the actual exception/error impacting the health of the SLO.
Caution is advised, as by doing this, it should not come as a surprise to observe a better health state (score) of the SLO. This is normal because we have bypassed a parasitic part constituted by the exceptions and errors that actually cause user impact.
Find below the way to detect potential user-impacted cases thanks to SLO.
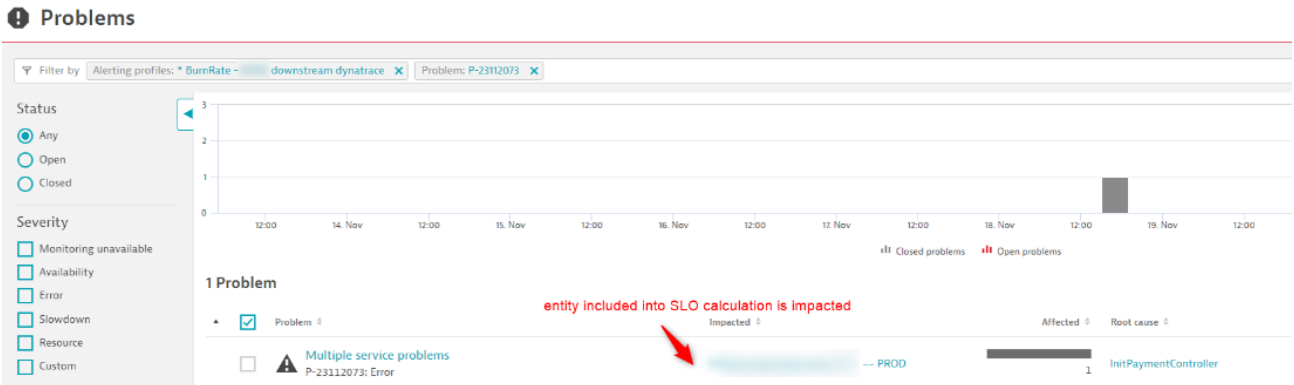
Details of the root cause
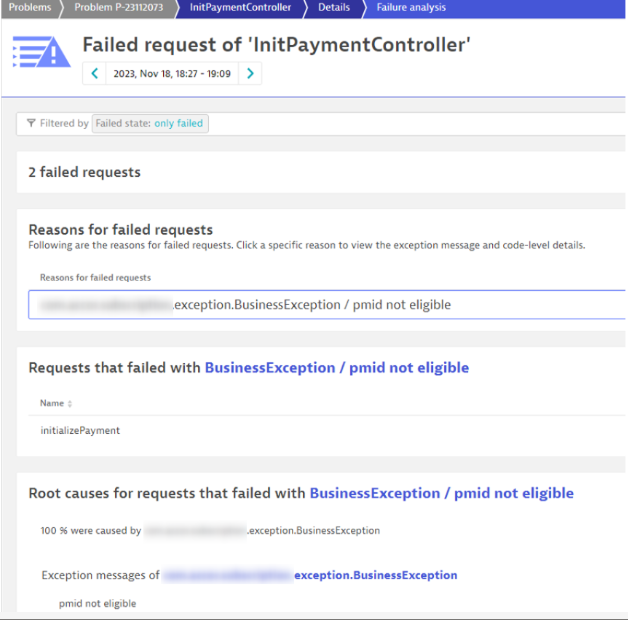
The developer deems it appropriate to either exclude or designate this error as acceptable during the patch release to prevent being overwhelmed with false positive alerts. Most importantly, this should not impede the health status of the SLO, as this is a recognized issue.
- The metric selector must be split by service
(100)*(builtin:service.errors.server.successCount:splitBy("dt.entity.service"))/(builtin:service.requestCount.server:splitBy())Splitting with the appropriate entity dimension enables the AI to more accurately pinpoint the created Service Level Objective (SLO). Consequently, when triggering an alert, this approach facilitates drilling down into the affected entity, thereby enabling a deeper understanding of the root cause behind the issue.
- Smart alerting approach: BurnRate/ Status and AlertingProfile
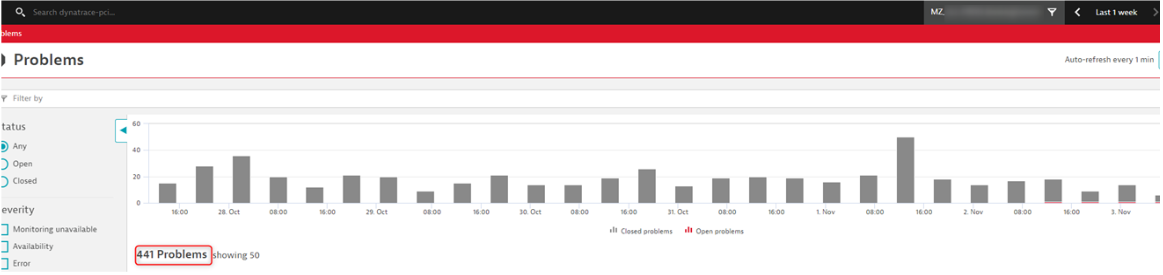
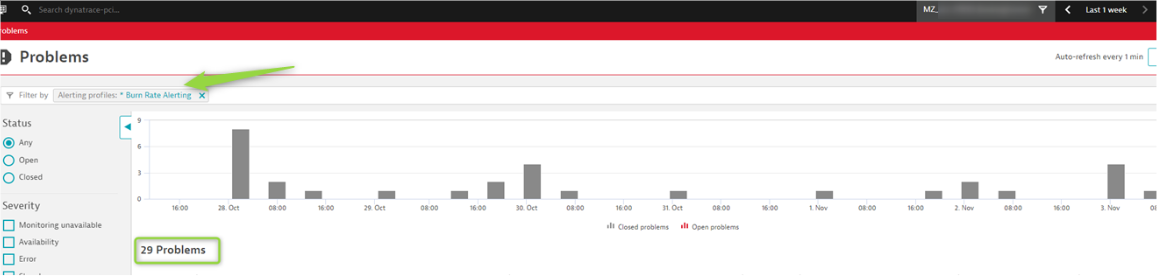
E-Commerce Use Case
In this instance, upon reviewing the week’s alerts, it’s evident that parasitic noise has significantly decreased due to implementing good practices. There were 441 issues without intelligent configuration, whereas with intelligent configuration, only 29 were identified as potentially impacting the end user.
The kinetics of the impact on the Service Level Objective (SLO) are represented by the red arrow, illustrating the concept of error budget burn rate, which indicates how rapidly the error rate escalates.
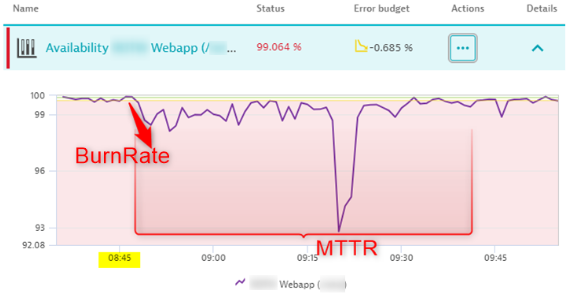
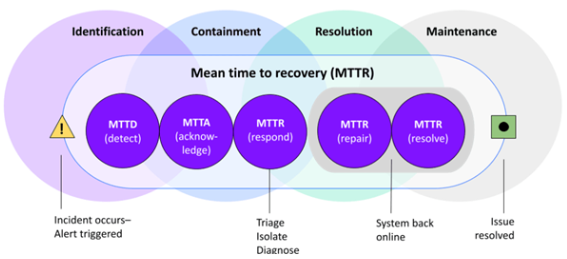
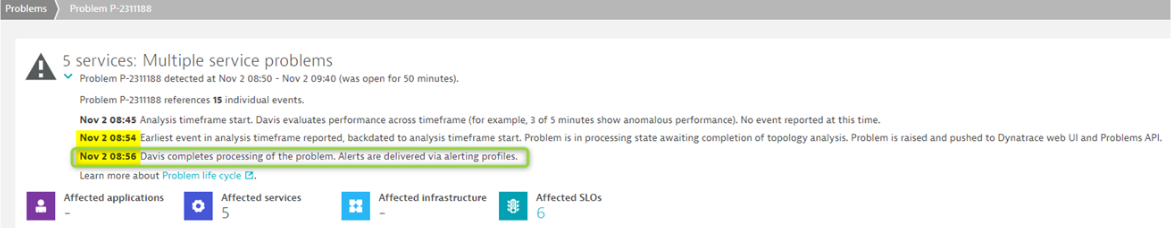
Based on the IT incident indicators, our MTTD is 3 min for this event below, degrading the SLO.
For more info on how to configure and use BurnRate, see SLO monitoring alerting on SLOs error budget burn rates.
Conclusion
An effective Service Level Objective (SLO) holds more value than numerous alerts, reducing unnecessary noise in monitoring systems. The crucial final step is to highlight strong signals that genuinely impact the end user. Validating and integrating this approach into an intelligent ITSM tool like ServiceNow, for example, will optimize service management by aligning IT services with business needs, ensuring efficient delivery and improved user experiences.
Interested in learning more? Contact us for a free demo.


Looking for answers?
Start a new discussion or ask for help in our Q&A forum.
Go to forum