
Cloud-native observability for Google’s fully managed GKE Autopilot clusters demands new methods of gathering metrics, traces, and logs for workloads, pods, and containers to enable better accessibility for operations teams.
Managed Kubernetes clusters on GKE Autopilot have gained unprecedented momentum among enterprises. GKE Autopilot empowers organizations to invest in creating elegant digital experiences for their customers in lieu of expensive infrastructure management. This increased agility requires ways of collecting and analyzing observability signals such as metrics, logs, and traces. Dynatrace’s collaboration with Google addresses these needs by providing simple, scalable, and innovative data acquisition for comprehensive analysis and troubleshooting.
Thanks to the collaboration between Dynatrace and Google, customers can now unlock cloud-native Dynatrace deployments on GKE Autopilot and take full advantage of Dynatrace’s AI-powered, context-aware observability platform.
The challenge of data acquisition in GKE Autopilot clusters
Setting up cloud-native observability in managed GKE Autopilot clusters has its challenges, primarily because Kubernetes nodes and infrastructure are abstracted. While fully managed Kubernetes solutions, such as GKE Autopilot, offer considerable benefits, they also shift control from Kubernetes operations teams to cloud vendors, affecting core observability infrastructure.
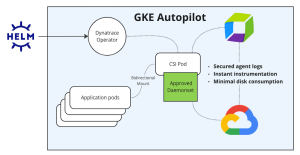
To leverage the best of GKE Autopilot and cloud-native observability, Dynatrace and Google focused especially on Dynatrace’s innovative use of Container Storage Interface (CSI) pods. These CSI pods provide a unique way of solving a handful of infrastructure problems.
- Agent logs security. The CSI pod is mounted to application pods using an overlay file system. Dynatrace OneAgent logs are isolated by container to reduce the attack surface of each container.
- Instant instrumentation. The CSI pod offers a prepared file system, mounted automatically, and includes unzipped agent binaries to every application pod. This means application pods, instrumented with Dynatrace, start instantly.
- Minimal disk consumption. The CSI pod provides the same set of agent binaries to application pods without consuming space on their ephemeral or persistent disks
This solution by Dynatrace and Google means businesses on GKE can rapidly and securely deploy cloud-native observability without risking application pod startup times. Every enterprise using GKE Autopilot can combine the advantages of Google’s managed Kubernetes infrastructure with Dynatrace’s world-class observability platform.
Deploy the Dynatrace Operator on GKE Autopilot
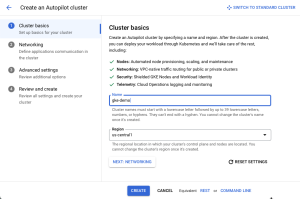
Getting started with Dynatrace on GKE Autopilot takes only a few minutes. First, we create a small Kubernetes cluster in the Google Cloud Console.
We use the Dynatrace Operator Helm chart to deploy Dynatrace Kubernetes Application observability as described in the documentation.
After deploying Dynatrace to GKE Autopilot, application pods are fully observable with out-of-the-box Kubernetes dashboards, the full power of Davis for anomaly detection and causal correlation, world-class distributed tracing, memory and CPU profiling, and powerful deep code-level insights using method hotspots.
The following sections highlight just a few of these features, including the Kubernetes Dashboard, a Workloads page with Davis resource utilization and failure correlations, and a Method Hotpot view for exploring these failures more deeply.
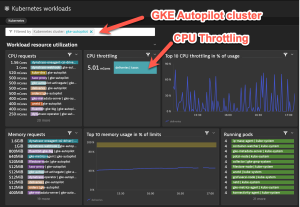
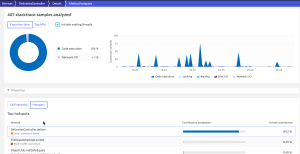
Kubernetes Workload Dashboard on GKE Autopilot
This dashboard displays all workloads deployed to a GKE Autopilot cluster. It also shows CPU throttling on the Deliveries workload, which indicates a potential problem to explore in the workloads view.
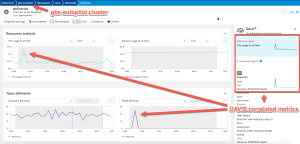
GKE Autopilot Kubernetes Workload view
This built-in Dynatrace screen shows resource utilization, throughput, related pods, Kubernetes Services, microservices, logs, and events. Here we asked Davis, the Dynatrace AI engine, to correlate CPU usage against other signals. In this case, Davis found that a Java Spring Micrometer metric Failed Deliveries is highly correlated with CPU spikes.
Service Insights via Method Hotspots
The Method Hotspot view is typically accessed from a distributed trace or unified service analysis screen. This example shows the specific method causing performance problems and delivery failures.
Cloud-native observability for Kubernetes with Dynatrace and GKE Autopilot
The Dynatrace-Google partnership to provide unparalleled observability on GKE Autopilot exemplifies how technology can evolve to meet the observability demands of fully managed Kubernetes infrastructure. By providing managed Kubernetes clusters with innovative observability data collection at scale, customers can focus more on their digital transformation journeys.

Looking for answers?
Start a new discussion or ask for help in our Q&A forum.
Go to forum