
Observability in large IT environments, such as the IBM i operating system, is critical for tracking system performance. To simplify this task, Dynatrace further enhanced an extension that enables effortless analysis of IBM i performance—without needing installations on your mainframe infrastructure. To collect performance data and provide insights into aspects like system health, job performance, and disk utilization, the extension links remotely to your IBM i system through Dynatrace ActiveGate.
What is IBM i?
IBM i, formerly known as iSeries, is an operating system developed by IBM for its line of IBM i Power Systems servers. It is based on the IBM AS/400 system and is known for its reliability, scalability, and security features. IBM i is designed to integrate seamlessly with legacy and modern applications, allowing businesses to run critical workloads and applications. It also includes various built-in software components for database management, security, and application development.
Gaining knowledge about IBM i performance can be a challenging and pricey task. Some tools demand the installation of agents on those systems and provide complex, disconnected views. Additionally, certain tools require auxiliary services to gather performance data before it can be examined and queried.
Effortlessly analyze IBM i Performance with the new Dynatrace extension
Dynatrace has created a new version of its popular extension that is faster, offers better interactive pages, and includes more metrics, metadata, and analytics without having to install anything on your mainframe infrastructure.
Find out how your LPARs are doing overall, which jobs are consuming the most resources, and which users are holding up your output queues. Or perhaps you want to be notified when specific critical system or completion messages appear in your message queues.
Maybe you’d like to know when your jobs are in a waiting status, when an application is spawning too few or too many job instances, or when all the disks in your pool are being utilized evenly.
Get answers to all of these questions with the new Dynatrace IBM i extension.
How does the extension work?
The extension runs remotely from your Dynatrace ActiveGates and connects to your IBM i system. It then collects performance data using existing database services running on your system. The entire topology is built on Dynatrace based on the components it finds configured on your IBM i system, all acting cohesively to accelerate root cause and impact analysis.
Nothing is installed on your IBM i systems. It’s all monitored remotely!
More metrics, more data
We have improved performance KPI collection and added new metrics and entities, like:
- System
- Memory pools
- Jobs
- Job queues
- ASP and disks
- Output queues and spooling files
- Message queues
- Network
- Subsystems
Each entity has more metadata to help you identify and understand its configuration.
All systems at a glance
A ready-to-use dashboard, straight out of the box, is the starting point, showing important information in a unified view.
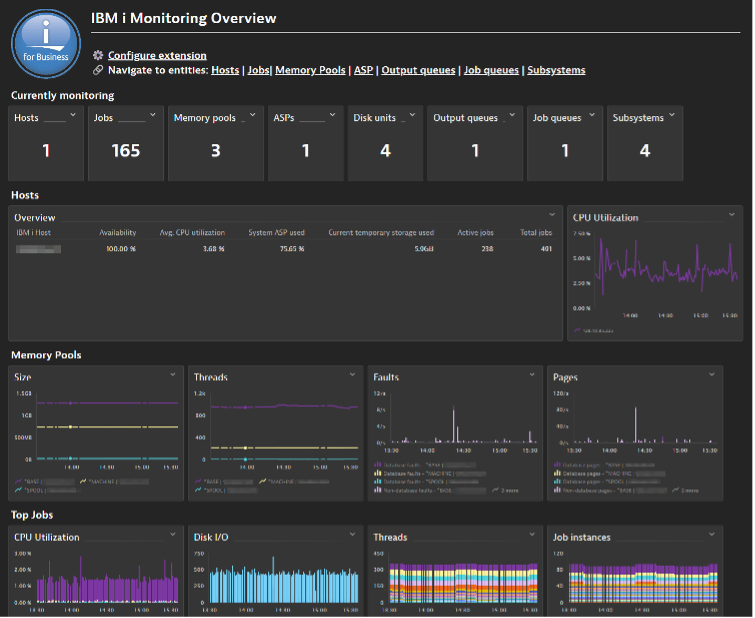
The default dashboard provides an overview of all monitored systems and how many different entities are created by IBM i components.
Starting at this dashboard, you can drill down into any component to see how it performs on more detailed dashboards.
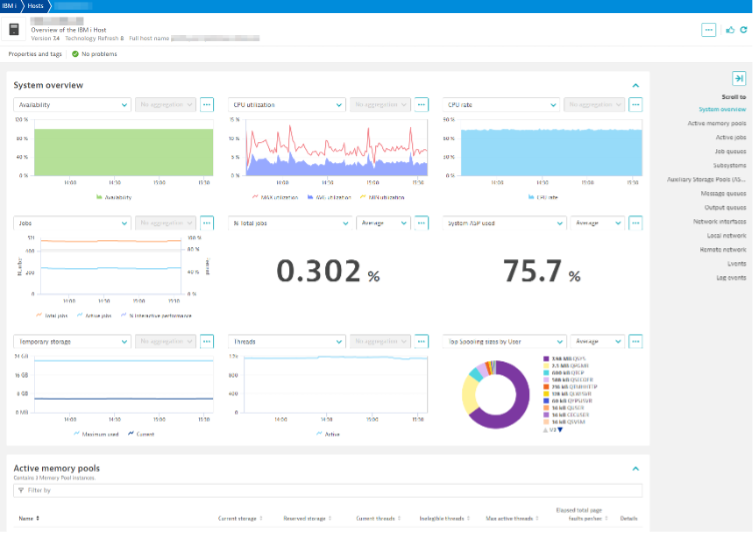
Get a health overview of each system
Monitor your system’s performance and detect unexpected events such as IPLs, CPU spikes, and exceeded total job limits. Identify users who are consuming the most spooling files.
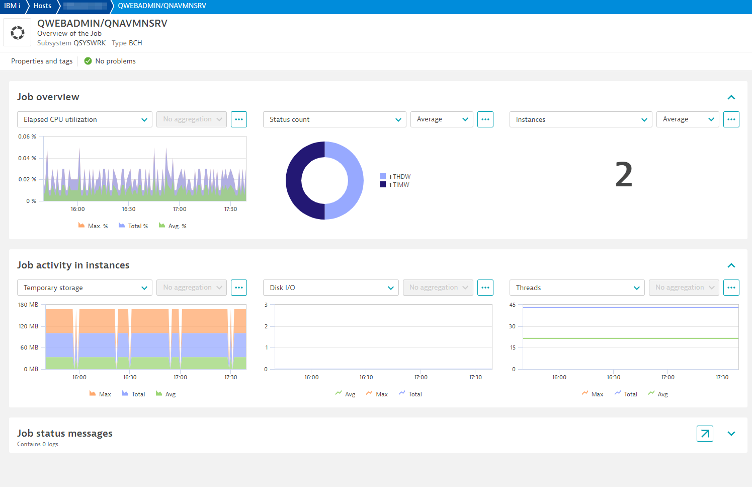
Monitor your jobs and their instances
On IBM i, jobs are tasks that are triggered to run by the system and applications. It’s crucial to monitor the performance of these jobs, including their CPU usage, number of instances, and status. Additionally, it’s important to identify when a job is locked or hanging by observing various indicators.
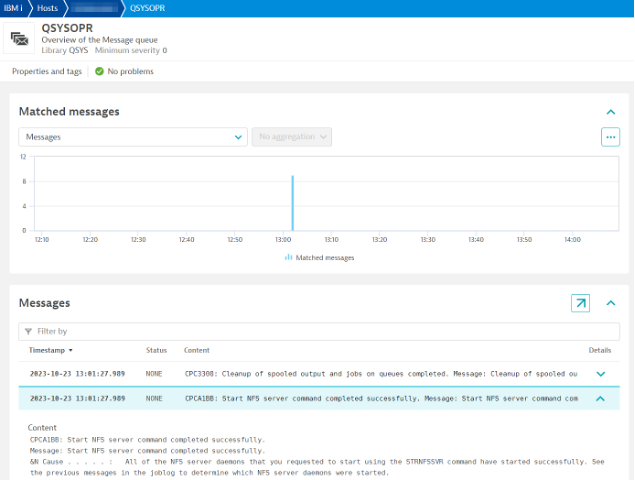
Critical messages to your teams
Monitoring the main message queues can provide critical information about system failures, application failures, completion tasks, and any other message type you want to know about.
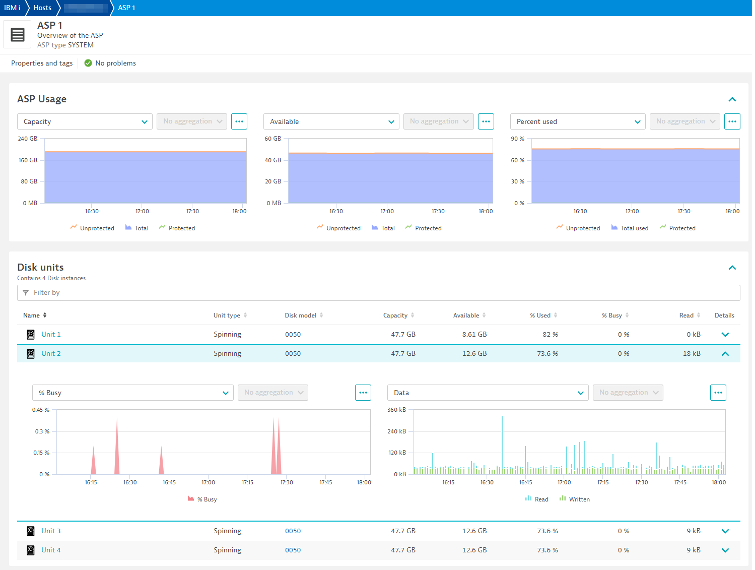
Monitor disks and disk pool utilization
One of the most important functions of your mainframe infrastructure is reading and writing data at high speeds while making it readily available. It’s critical to know the performance of your disks and ensure their optimum utilization to maintain balance in I/O operations. If you observe any disk running out of space more quickly than others—or underperforming—this type of analysis can help prevent disastrous outages or potential data loss.
As this extension evolves, your valued feedback is important to ensure its continuous improvement. Please visit our Product Ideas community forum, let your voice be heard, and give others a chance to upvote your ideas.
To learn how to deploy this extension, please visit Dynatrace Hub.


Looking for answers?
Start a new discussion or ask for help in our Q&A forum.
Go to forum