
The Dynatrace Citrix monitoring extension can now ingest observability signals from Citrix PowerShell SDK cmdlets in addition to existing metrics related to users, sessions, and Virtual Delivery Agent (VDA). The Citrix PowerShell SDK provides access to metrics from Citrix Studio and additional metrics that aren't readily available in Citrix Studio but are commonly used by Citrix performance engineers.
Citrix is critical infrastructure
For businesses operating in industries with strict regulations, such as healthcare, banking, or government, Citrix virtual apps and virtual desktops are essential for simplified infrastructure management, secure application delivery, and compliance requirements. Many companies rely on Citrix as a critical component of their infrastructure that demands thorough observability and integrated analytics across the entire application landscape. Automated AI-powered analytics are necessary to match the scale of monitoring these enterprises require.
When it comes to tackling this challenge, Dynatrace is the ideal solution. We gained valuable insights and expertise through years of collaboration with numerous Citrix users. Our journey began in 2019 with the introduction of the Dynatrace Citrix monitoring extension. Since then, we’ve maintained ongoing partnerships with customers, ensuring their Citrix observability requirements are met while keeping up with the latest AIOps (AI for IT Operations) developments.
Listen, learn, improve, and repeat
The latest update to the Citrix monitoring extension is now available. This update improves the ability to observe Citrix users and delivery agents within a Citrix environment using the Citrix SDK, which is designed specifically for Citrix admins. Our largest customers have already adopted the new observability signals included in this release to ensure the reliability of Citrix landscapes with thousands of VDAs.
Effortlessly monitor your Citrix environment with Dynatrace
The Citrix monitoring process now employs two methods to collect metrics and provide complete Citrix performance observability. The VDA extension, which focuses on users and sessions, was upgraded to enable the gathering of metrics for landscape health. This is achieved using the Citrix PowerShell SDK, either from a host where Citrix Studio is located or from the Delivery Controller host.
VDA characteristics: Citrix user experience
The VDA metrics collected from the extension offer valuable insights into how your end users interact with Citrix. This includes end-user performance when logging in and establishing a session, as well as response times.
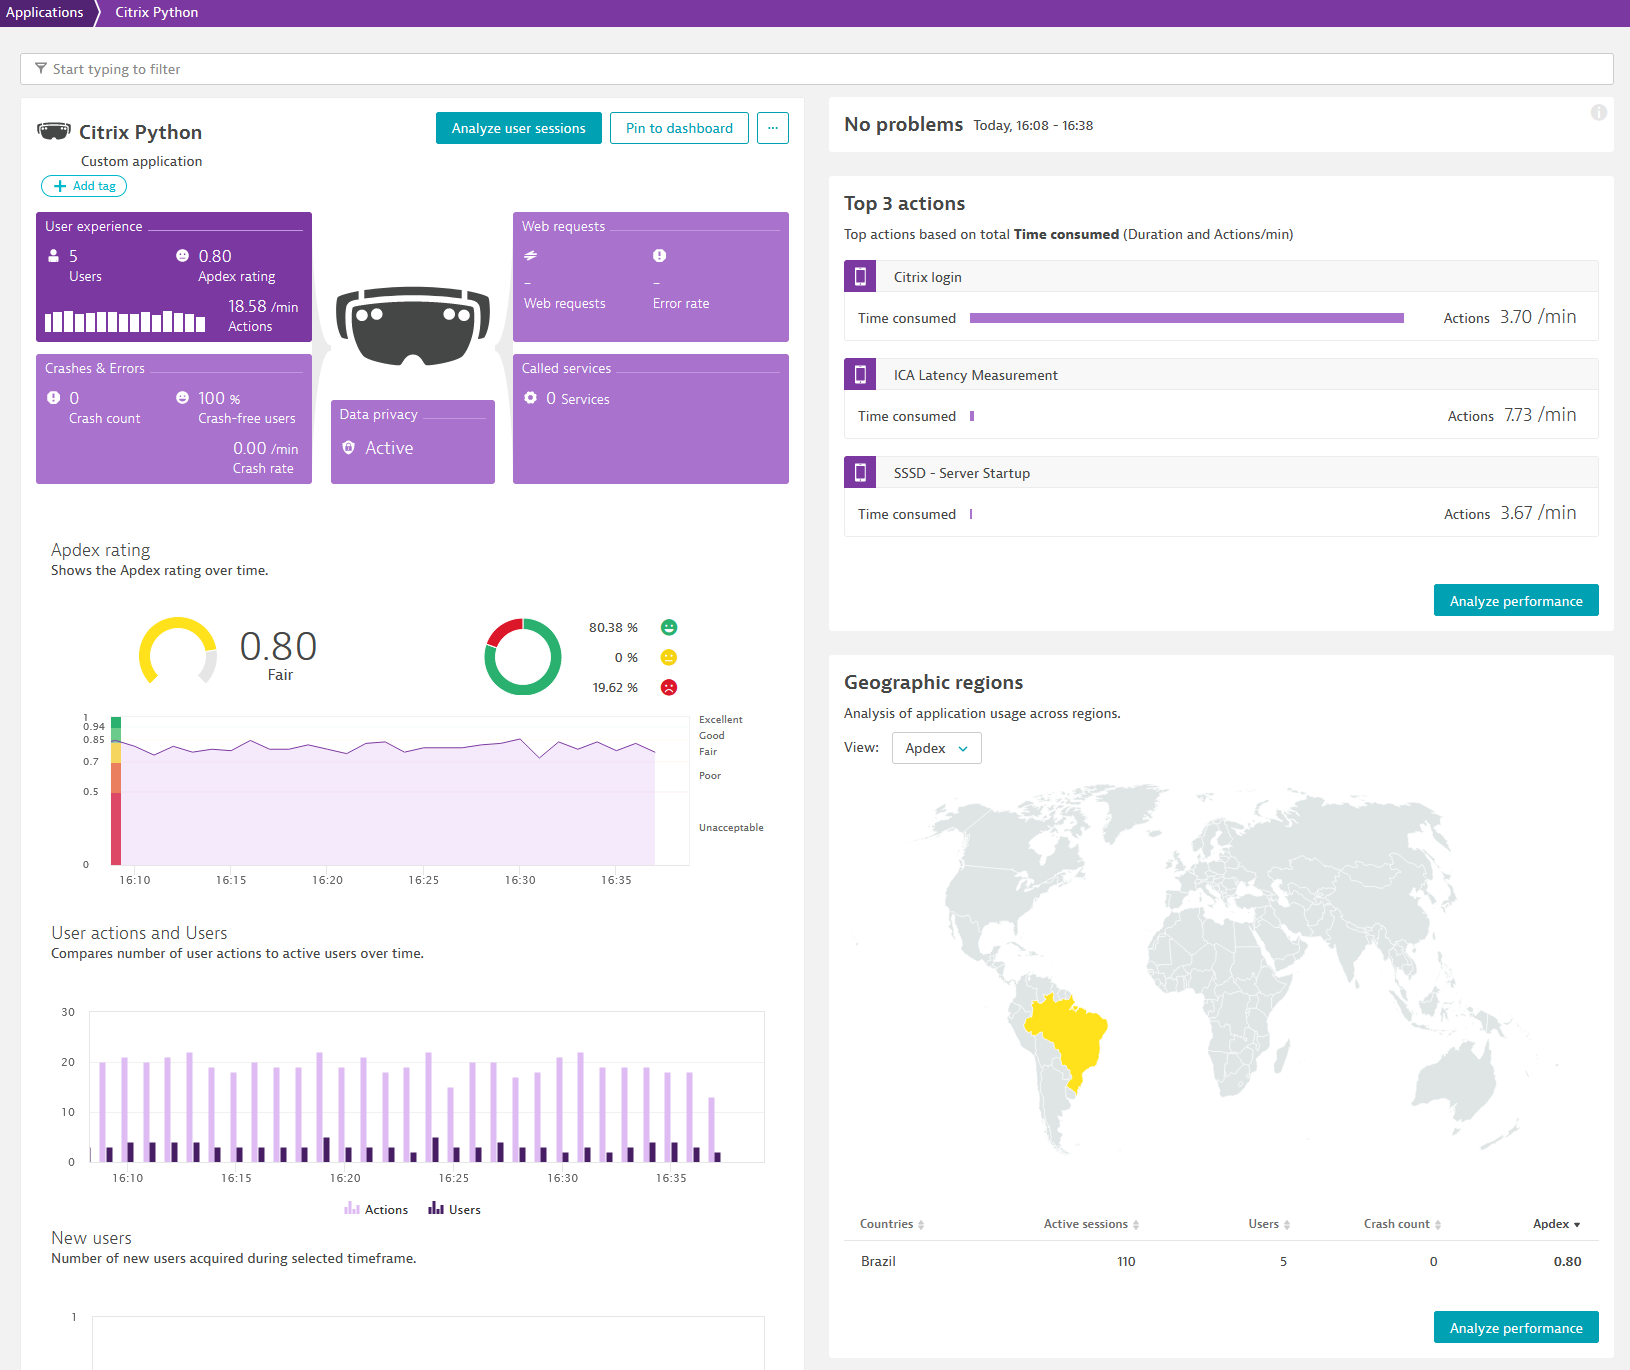
This approach utilizes Dynatrace Digital Experience monitoring to observe each Citrix user’s activity in detail throughout each step of the session setup process. This is accomplished by implementing Citrix recommended practices and metrics, which are well-documented.
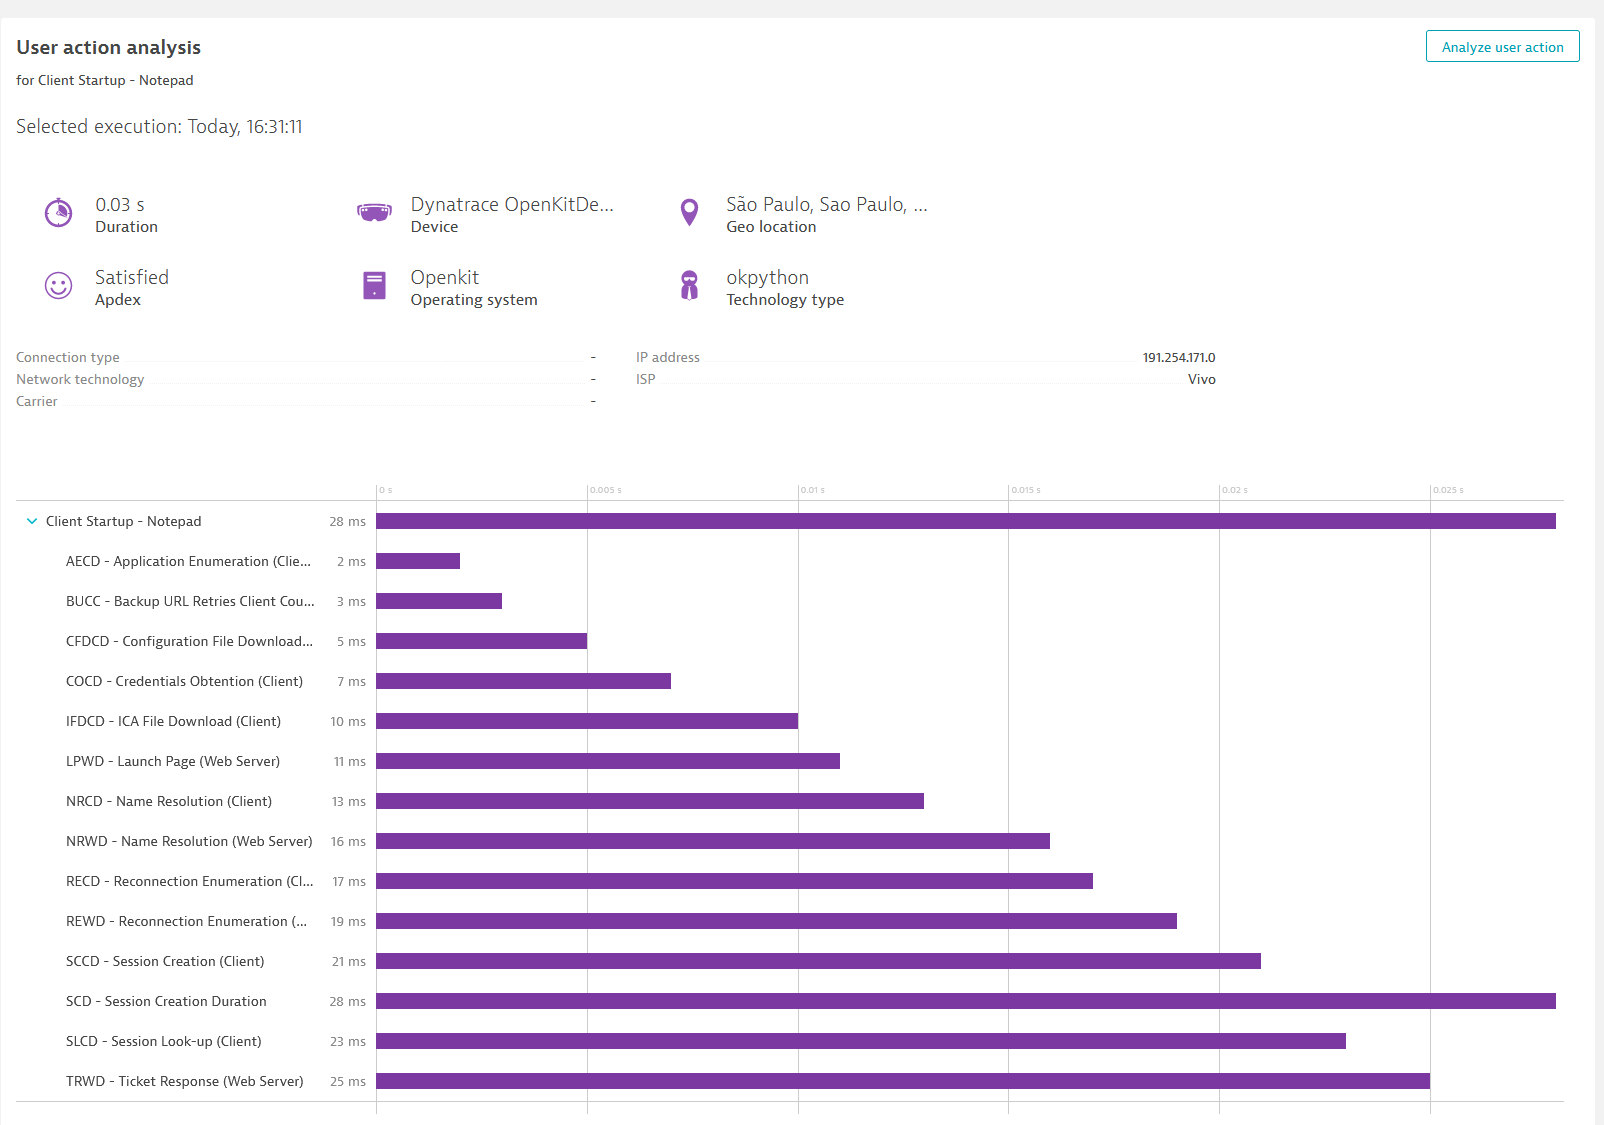
By adopting an outside-in perspective, Citrix admins gain insight into end-user experience and how it correlates with the Citrix system activities that admins are responsible for. This approach also assists Citrix users in comprehending the impact of Citrix on app delivery without requiring an in-depth understanding of Citrix’s inner workings or specialized monitoring tools.
Citrix landscape: System state and trends
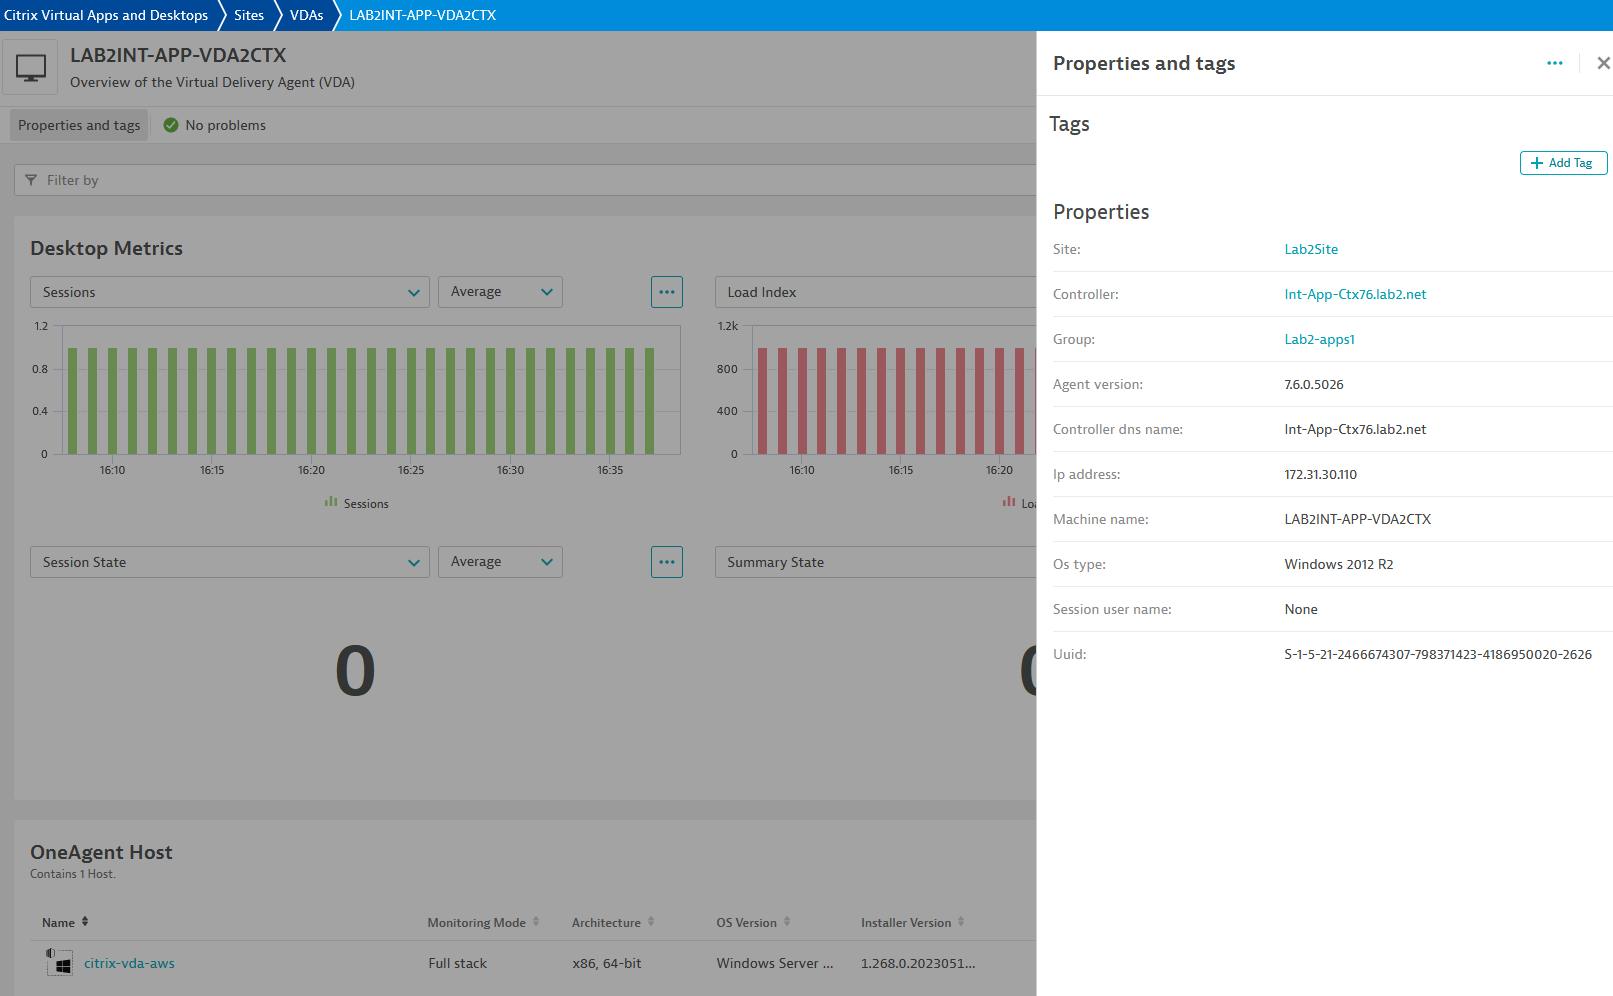
By collecting landscape metrics, you get a clear picture of how your Citrix landscape is configured and prepared for your Citrix end users. You can monitor delivery groups, VDAs, catalogs, delivery controllers, broker services, and license status through easy-to-use dashboards, which can be used as a starting point. Alternatively, you can create your own dashboards and alerting profiles to ensure that your reporting aligns with your infrastructure and monitoring practices.
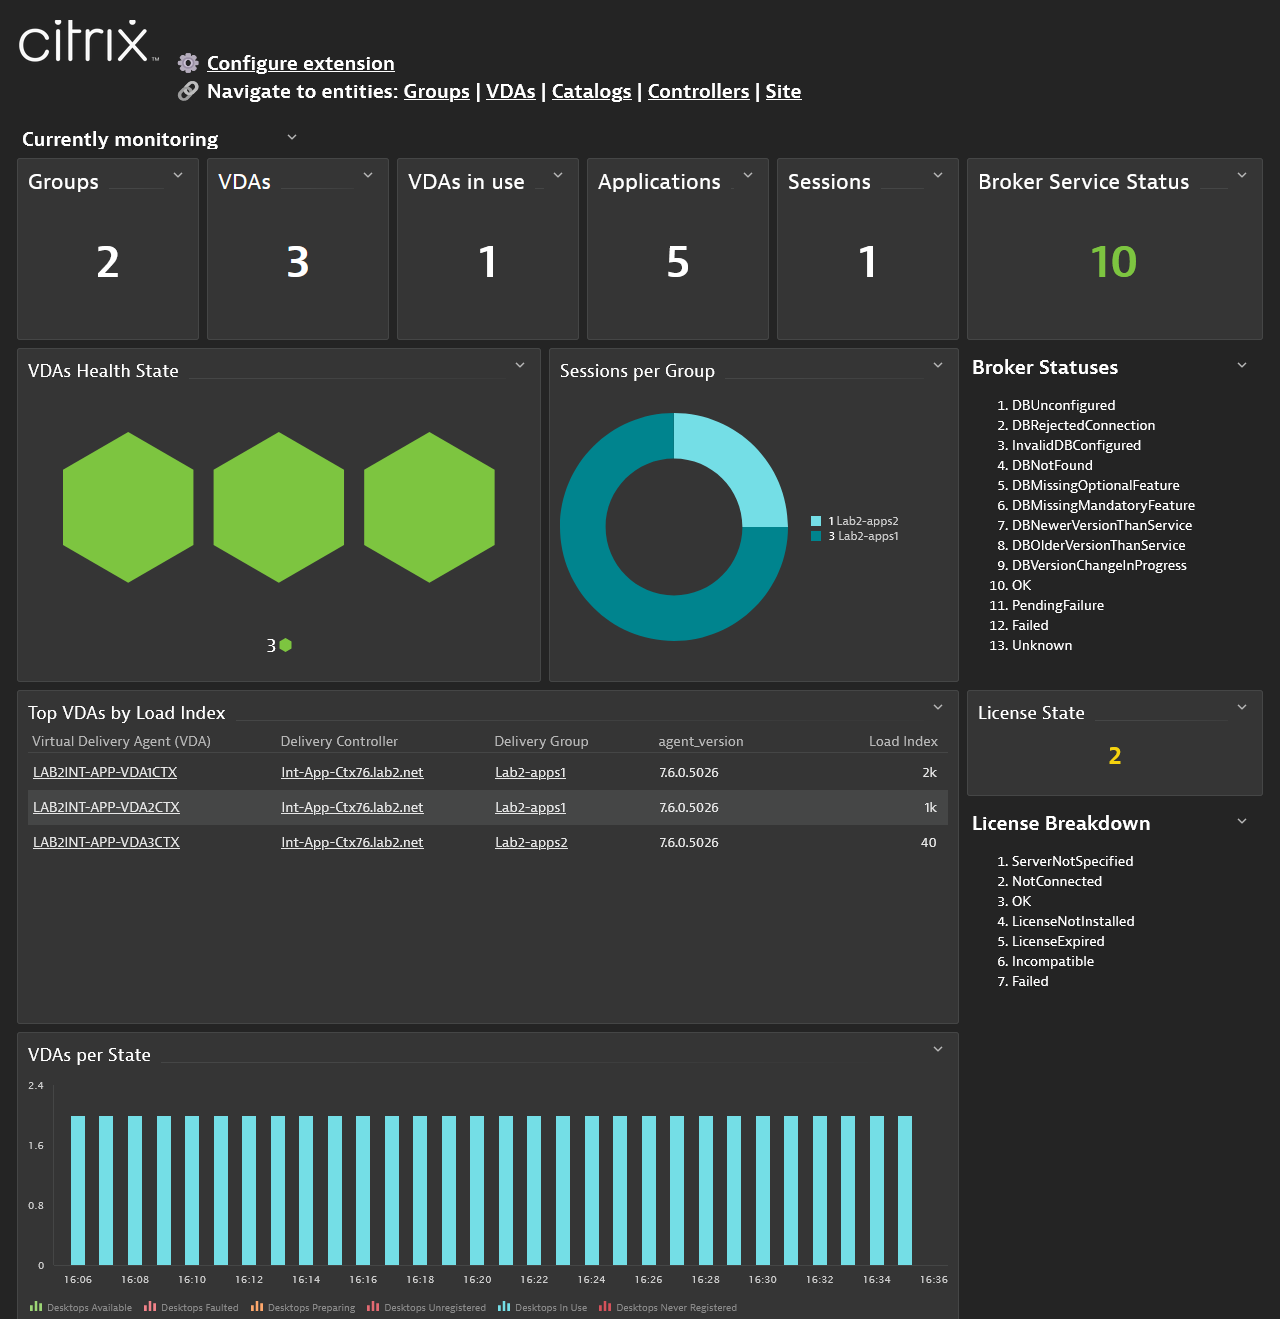
Citrix admins use an inside-out perspective to begin health assessments, troubleshoot issues, and plan landscape progression. Dynatrace collects various metrics, including the number of VDAs, active sessions, available desktops, and more. It also maintains topological relationships between monitored entities, such as site, group, and controller, along with any relevant tags applied by Citrix admins. This is crucial for maintaining large Citrix landscapes, as we have observed while working with customers who manage tens of thousands of Citrix VDAs across multiple sites.
One observability platform for everyone
With the Dynatrace platform, Citrix administrators can now easily monitor the health of both their infrastructure and applications. This unified observability eliminates any confusion or blame-shifting, as everyone can use the same Dynatrace lens to analyze the entire application stack and delivery chain.
Start monitoring Citrix now
If you already use the extension, just upgrade it to get started. If you want to start monitoring, activate the extension in Dynatrace Hub.
- Install OneAgent on all Citrix hosts
- Infrastructure Monitoring mode is enough unless you plan to monitor Java or .NET apps that run on Citrix hosts.
- Activate the Citrix extension in Dynatrace Hub
- Enable VDA mode on VDAs
- The most convenient approach is to instrument your VDA golden image. Install OneAgent on the golden image, boot it and connect to Dynatrace, activate and configure the Citrix extension using Dynatrace Hub, and then enable VDA mode.
- Enable Powershell SDK mode on hosts where the Powershell SDK is installed. Typically, this is where Citrix Studio is installed.
Expand Citrix monitoring to include NetScaler or F5 BigIP
Activate NetScaler or BigIP extensions that fit your environment and benefit from complete visibility into the application delivery chain, including the network tier.
If you run Citrix, most likely, it’s front-ended with NetScaler ADC. Or (less likely) with F5 BigIP load balancer. Dynatrace collects metrics and topology information from load balancers and analyzes these critical network devices for performance and health. Visibility into load balancer performance is essential when you’re responsible for application delivery. Dynatrace brings you this visibility in context with your entire application delivery infrastructure.
Add synthetic availability tests to proactively check infrastructure health
Enable synthetic monitors to check the availability of your Citrix login from client locations.
Use Dynatrace Synthetic to test the HTTP availability of your Citrix login page. You may also use the Ping extension to check the availability of any network resources with TCP, ICMP, or UDP tests.
Does Dynatrace replace Citrix Studio and Director?
No, Citrix Studio and Director are focused on Citrix and provide application lifecycle management capabilities. Dynatrace provides infrastructure observability and user experience monitoring. Those who don’t manage Citrix components may be sufficiently served by Dynatrace. Those who manage Citrix will use Dynatrace as a common observability platform for Citrix and apps that Citrix delivers.
What’s next
Upgrade your Citrix extension to the new version and benefit from complete landscape monitoring. At Perform 2022, we showcased how our largest customers benefit from this capability. Now, it’s available to all customers.
Don’t forget to share your feedback in the Dynatrace Community.


Looking for answers?
Start a new discussion or ask for help in our Q&A forum.
Go to forum