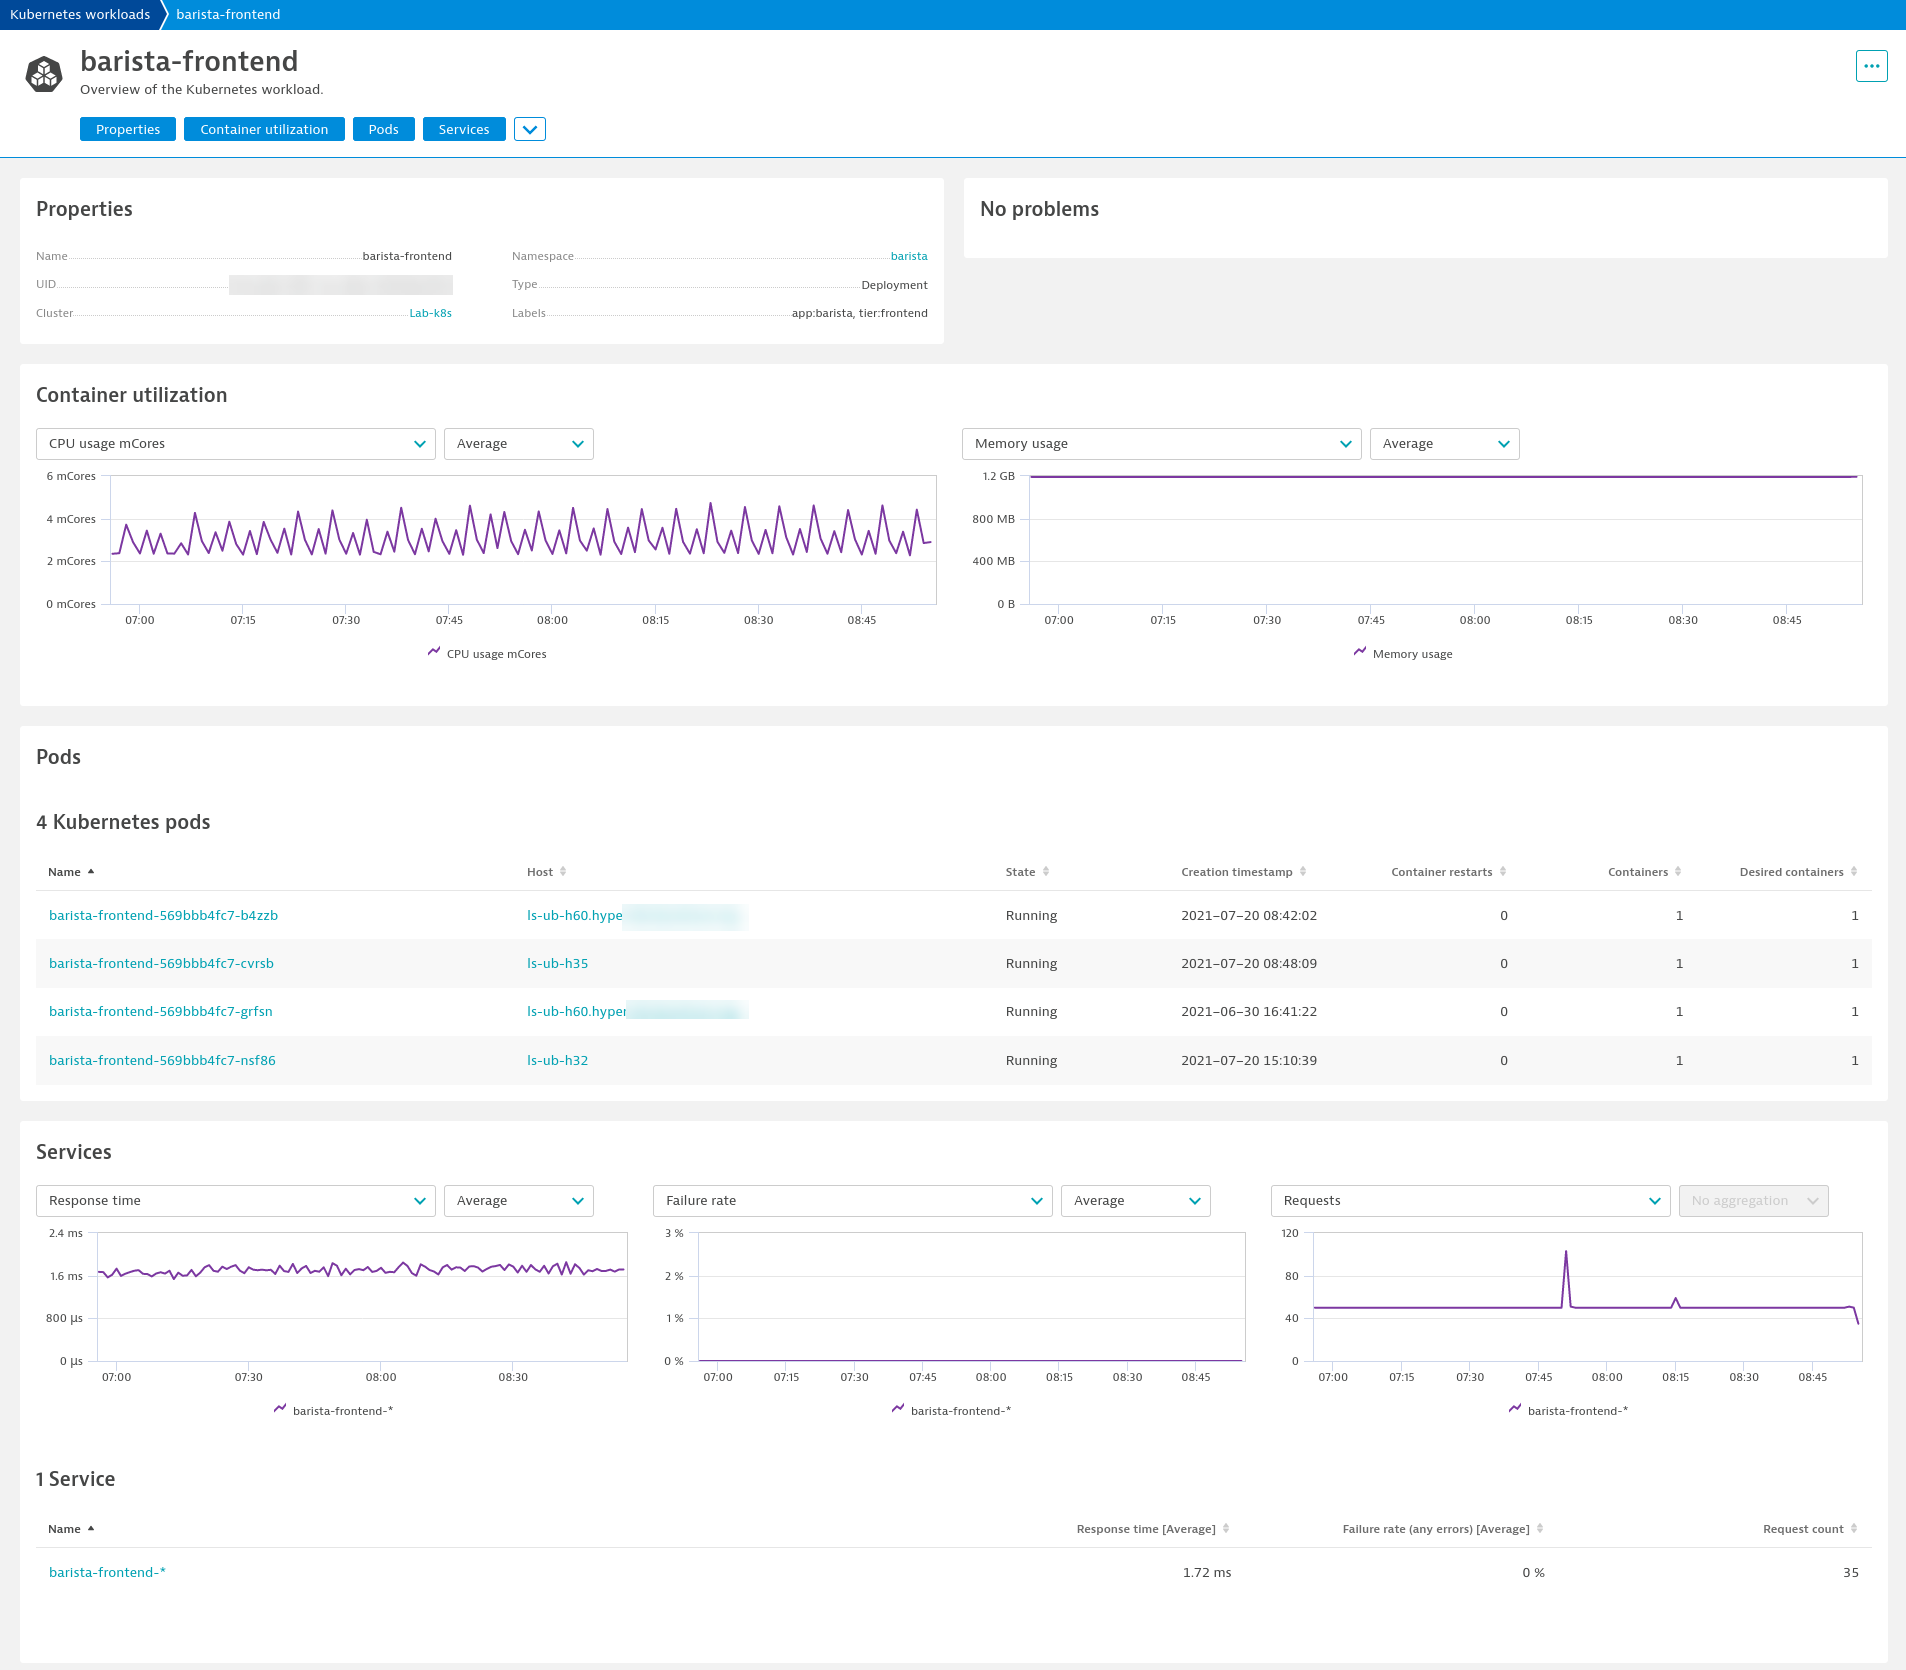
Dynatrace provides new analytics and AIOps capabilities for all data sources, including open-source observability data via OpenTelemetry, FluentD, and Prometheus. With these capabilities, you can now extend your IT landscape topology modeling based on your internal domain knowledge. Business-specific components of cloud-native ecosystems can now be added to your Smartscape topology model to provide a structure that turns open-source observability data into actionable business insights.
Today’s digital businesses run on heterogeneous and highly dynamic architectures with interconnected applications and microservices deployed via Kubernetes and other cloud-native platforms. The complexity of such deployments has accelerated with the adoption of emerging, open-source technologies that generate telemetry data, which is exploding in terms of volume, speed, and cardinality. The result is that IT teams must often contend with metrics, logs, and traces that aren’t relevant to organizational business objectives—their challenge is to translate such unstructured data into actionable business insights.
With extended contextual analytics and AIOps for open observability, Dynatrace now provides you with deep insights into every entity in your IT landscape, enabling you to seamlessly integrate metrics, logs, and traces—the three pillars of observability. By adding information about dependencies between entities, Dynatrace enables seamless navigation across all data, in context, with explorative analysis of the cause-and-effect service chain. All this data is then consumed by Dynatrace Davis® AI for more precise answers, thereby driving AIOps for cloud-native environments.
Contextualization is one of the biggest challenges of observability
BizDevOps teams are looking for answers to increasingly complex questions in structured and unstructured data that’s pulled from multiple applications and external data sources. Common questions include:
- Where do bottlenecks occur in our architecture?
- How can we optimize for performance and scalability?
- Does a certain issue impact a specific service? If so, what is the root cause and suggested remediation?
Without an easy way of getting answers to such questions, enterprises risk overinvesting in operations and underinvesting in development, which slows down innovation.
Relying solely on traditional analysis methods like tagging and data correlation to answer such questions is inadequate when an IT landscape isn’t properly represented in a data model or when the cause-and-effect chain of services remains unclear. Entity tagging requires an enormous amount of manual effort and is always open to interpretation. Common tagging standards must be defined in advance and then applied consistently across the organization.
In contrast, Dynatrace doesn’t rely on standard rules for topology modeling; Dynatrace relies solely on ingested data to build topology. With this approach, resulting in data models are clear-cut representations of actual observed entities and relationships. Dynatrace also shows all data in context with visualizations that allow for slicing and dicing of monitored data across topological layers. In this way, thanks to the extensive domain knowledge that it can model, Dynatrace is able to speak in your IT department’s own internal language.
Examples of specific domain knowledge where extended topology is used include the representation of concepts like Kubernetes or serverless functions in Dynatrace. In fact, we are so convinced of the value of extending the topology and effectiveness of this way of working that we use it ourselves at Dynatrace to build new functionality.
Dynatrace extends its unique topology-based analytics and AIOps approach
Dynatrace offers a unique approach to analytics and AI-powered insights. Our platform uses extensible real-time topology and AI to put data into an actionable context, enabling AIOps of cloud-native architectures at scale.
To achieve this, Dynatrace uniquely creates a data model that represents all detected software components and their interdependencies. Smartscape®, our topology-mapping technology, is available out-of-the-box for more than 560 technologies, enabling seamless navigation and analysis.
Extend your topology mapping to include open-source observability data
With these new capabilities, business-specific components of cloud-native ecosystems can be added to your automatically generated data model and provide structure for actionable insights into open-source observability data. For example, you may need to model physical locations of shops or branch offices due to reporting requirements. Such business requirements, or other customer-specific domain knowledge, can be used to extend Dynatrace Smartscape®. Operations teams can leverage the same approach to improve analytics and insights into data storage, network devices, or even the room temperatures of specific server rooms.
Based on such data models, Dynatrace now provides a unified analysis, which brings together all relevant information across metrics, events, logs, and traces for each component in your IT landscape, enabling advanced analysis of the data and an intuitive, relationship-aware navigation and analytics workflow.

This additional context further fuels Davis, the Dynatrace AI engine, for more precise automatic answers to application and infrastructure questions, as well as for addressing potential SLO violations before they occur. As Davis provides deterministic and explainable AI based on such a sophisticated data model, it enables AIOps for large-scale cloud-native environments.
Next steps
All Dynatrace enhancements mentioned in this blog post will be available within the next 90 days.
- If you are a Dynatrace customer and want to start using the new extended topology, please navigate to the Hub to see which technologies we support.
- If you’re not using Dynatrace yet, it’s easy to get started in under 5 minutes with the Dynatrace free trial.
For more information visit our webpage.


Looking for answers?
Start a new discussion or ask for help in our Q&A forum.
Go to forum