
Dynatrace announces improved error workflow and extended Davis AI awareness of alerting. We now detect and report problems related to your client-side HTTP errors and custom errors, automatically and out of the box.
To ensure unrivaled customer experience with your applications and websites, you need unrivaled levels of observability into your customers’ digital experiences. However, if you take a look at the current real user monitoring offerings on the market, you’ll find that while most solutions provide decent ways of detecting and analyzing JavaScript errors, only a few offer additional visibility into other error types. Even fewer solutions can analyze, detect, and report error anomalies out of the box—other tools force you to add such errors manually and then wire them with alerts. In times where weekly/biweekly software releases are the norm, in environments with thousands of applications, and when the introduction of new bugs is inevitable, we strongly believe that manual approaches to error detection and analysis are no longer feasible.
Extended Davis AI awareness of HTTP and custom errors
Dynatrace Real User Monitoring provides you with full visibility into your real users’ actions and behavior in your applications. At the beginning of this year, we provided you with additional visibility into your CDN-related HTTP errors that goes beyond JavaScript error detection to further help you reduce your Mean Time To Identify (MTTI).
With Dynatrace version 1.200, we took this value to the next level by extending the Davis AI causation engine’s awareness of HTTP and custom errors. This feature allows you to detect and report problems related to your client-side HTTP errors and custom errors, automatically and out of the box. Allowing Davis to do the work for you means that you no longer need to spend time configuring alerts or checking dashboards.
Easily analyze HTTP and custom error–related problems
After enabling Davis awareness of your HTTP and custom errors, Davis automatically starts to baseline both your HTTP as well as custom errors. Davis automatically adapts to baseline changes over time. However, when sudden drops, spikes, and anomalies occur, Davis alerts you (see the example problem details page below).
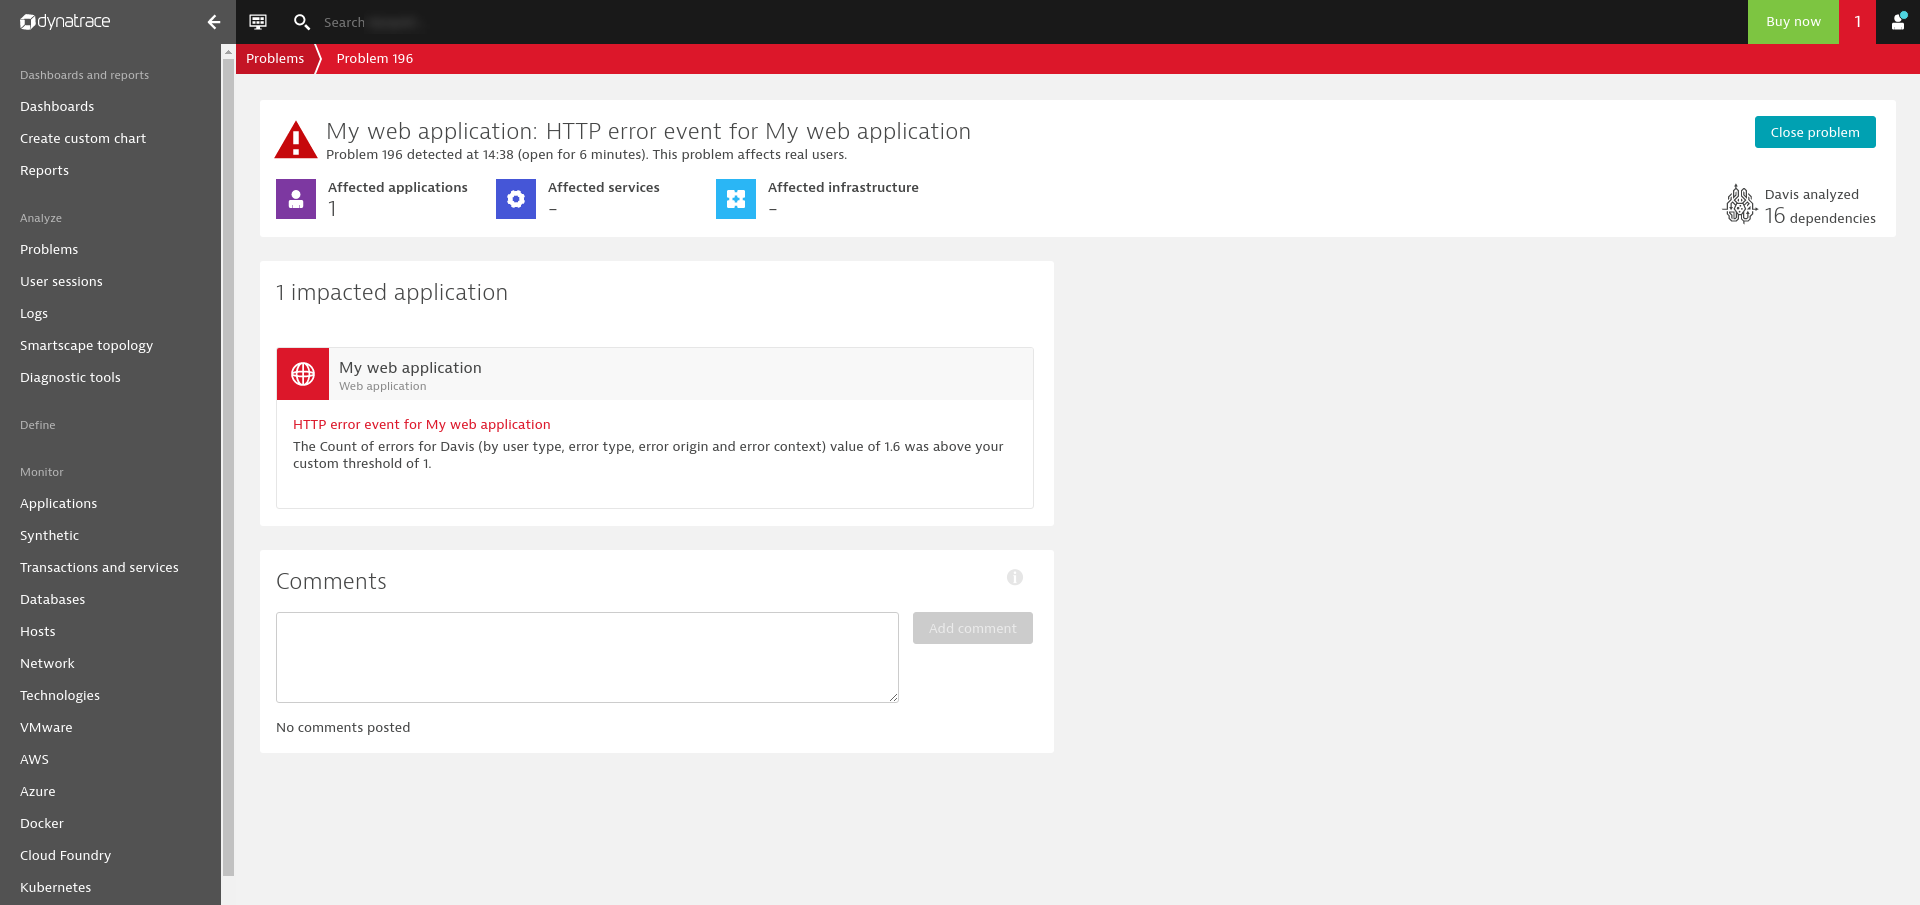
Clicking on the impacted application redirects you to the application’s overview page with the problem context activated (see the image below).
While in problem-context mode, Dynatrace automatically:
- Selects the timeframe during which the error-rate increase was detected.
- Selects Errors on the application overview page so that all error-relevant information can be obtained at a glance.
- Selects the error category that triggered the problem in the Top errors table ordered by frequency.
- Shows New errors (errors that first occurred within the problem timeframe, but not before) in the Top errors list.
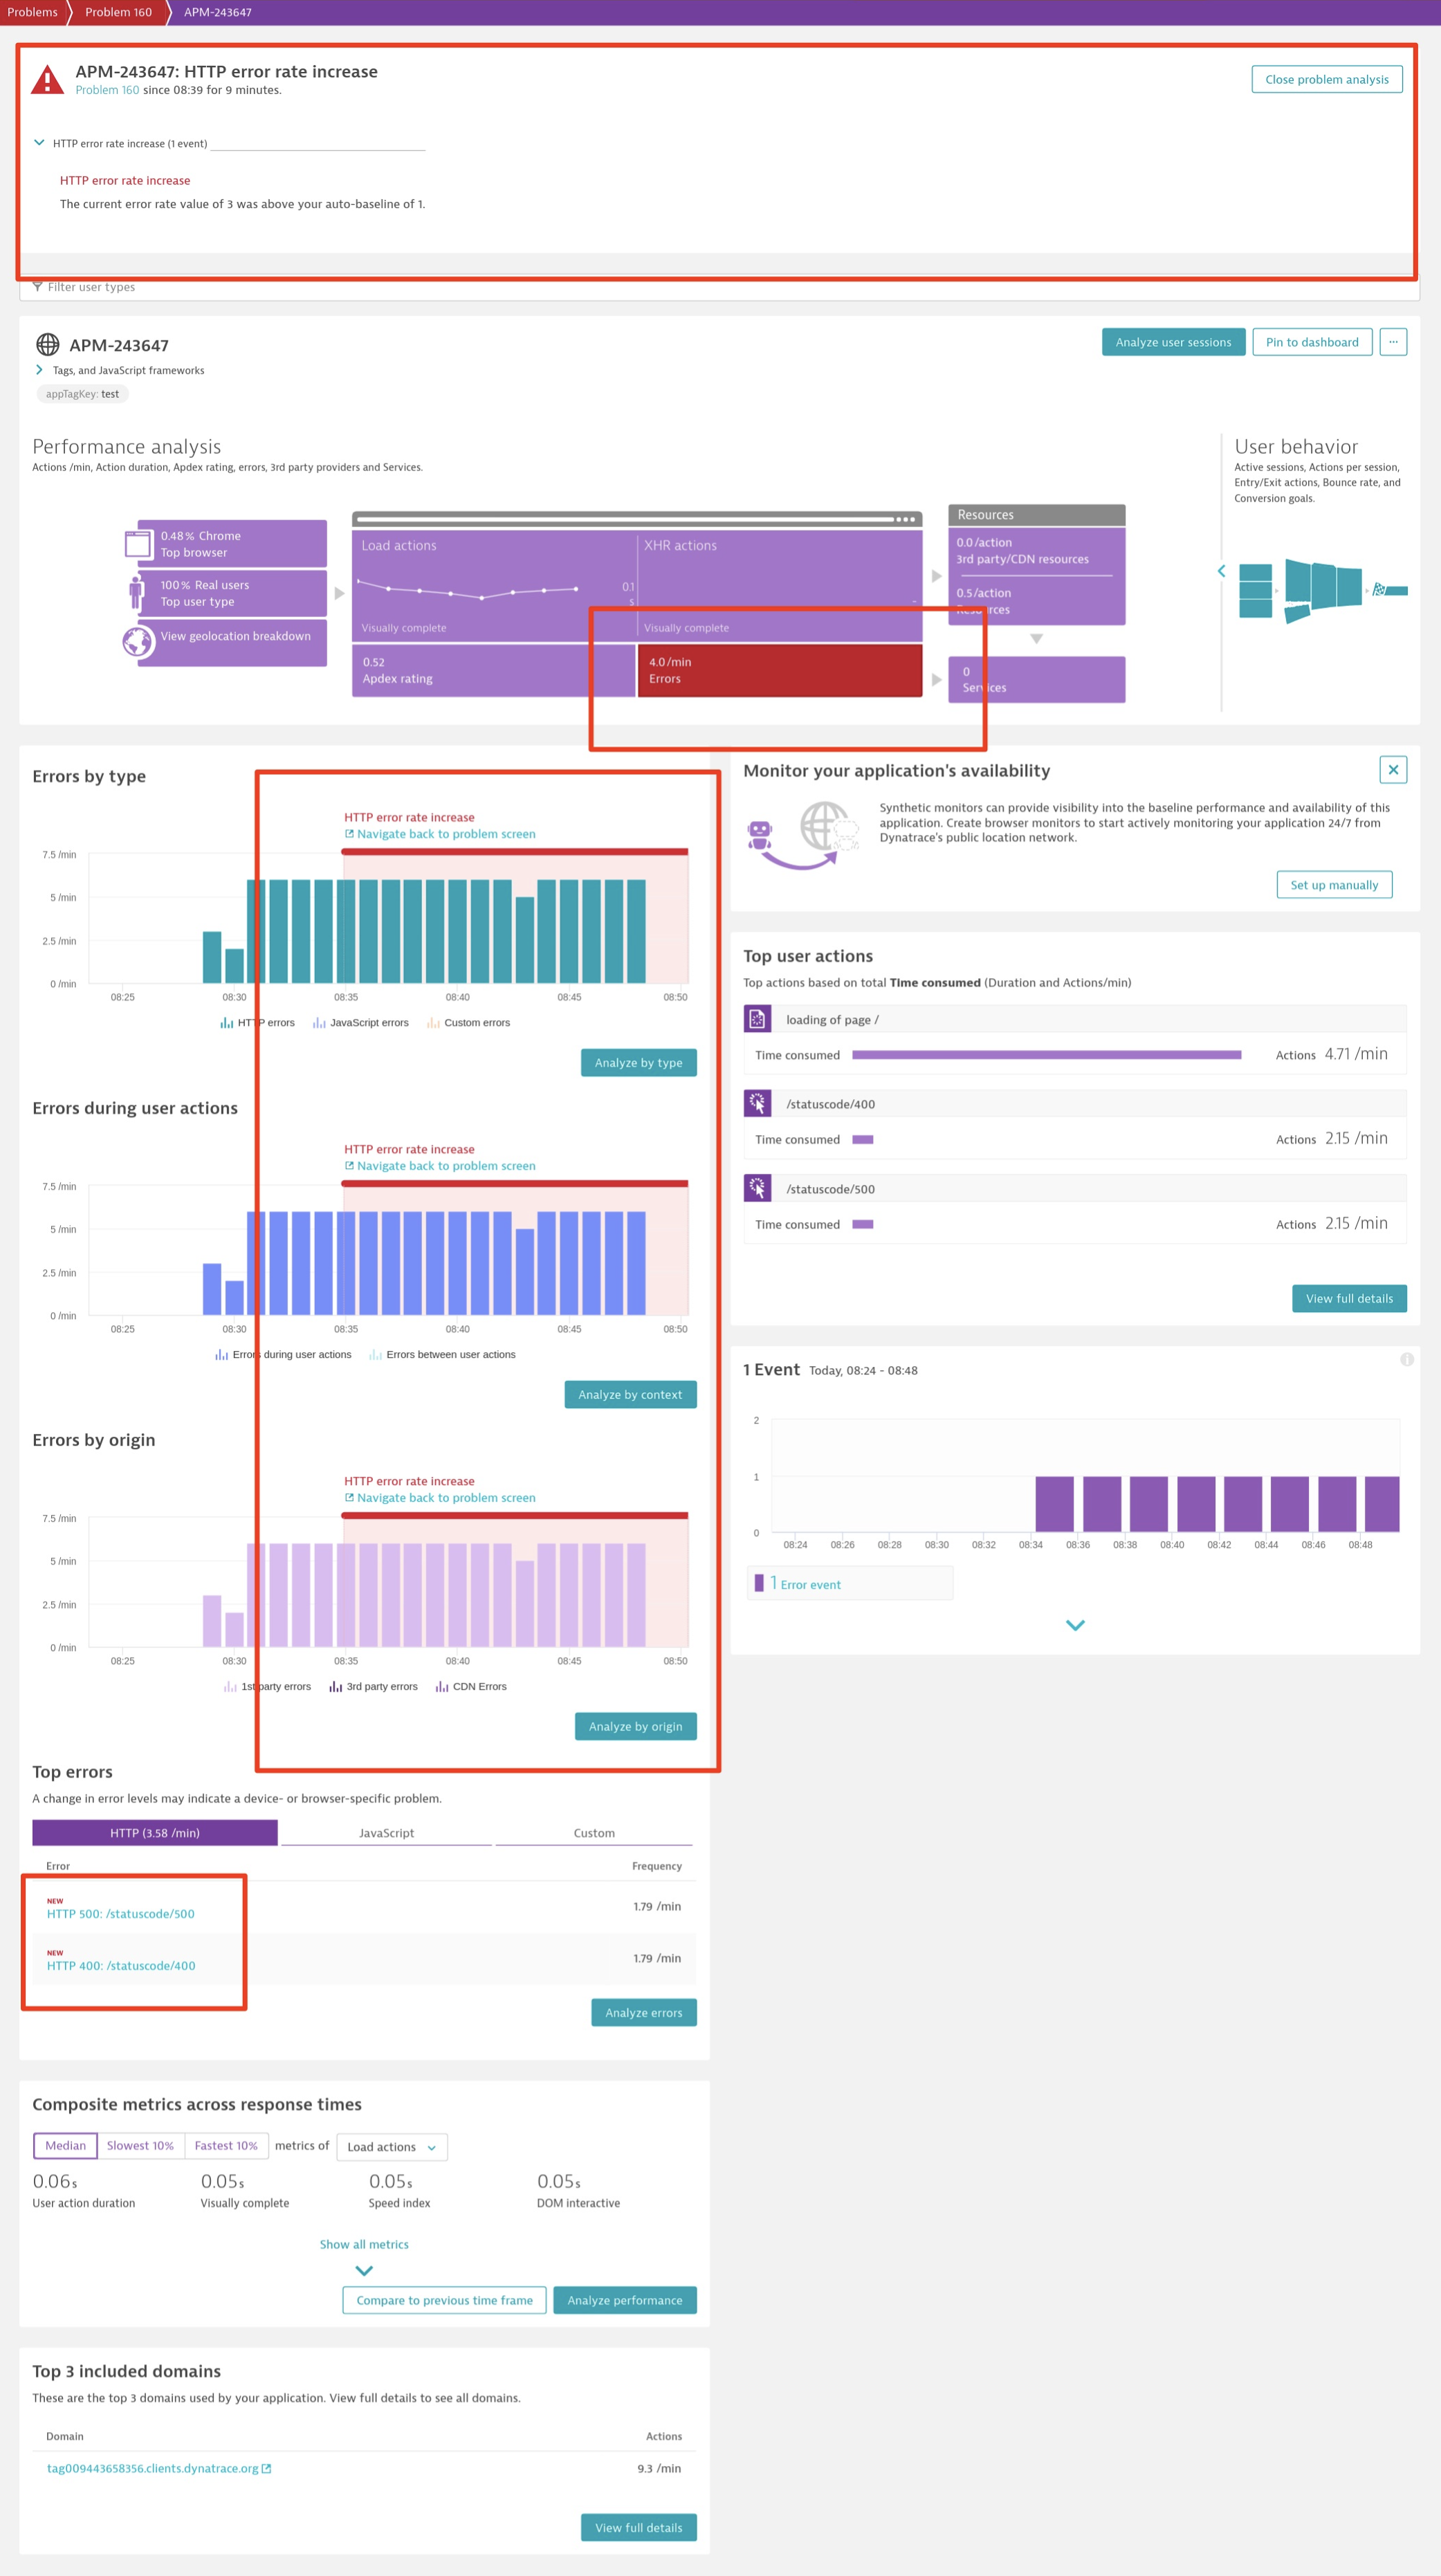
- For Top errors that occurred before the problem timeframe, Dynatrace also shows the percentage increase right below error Frequency.
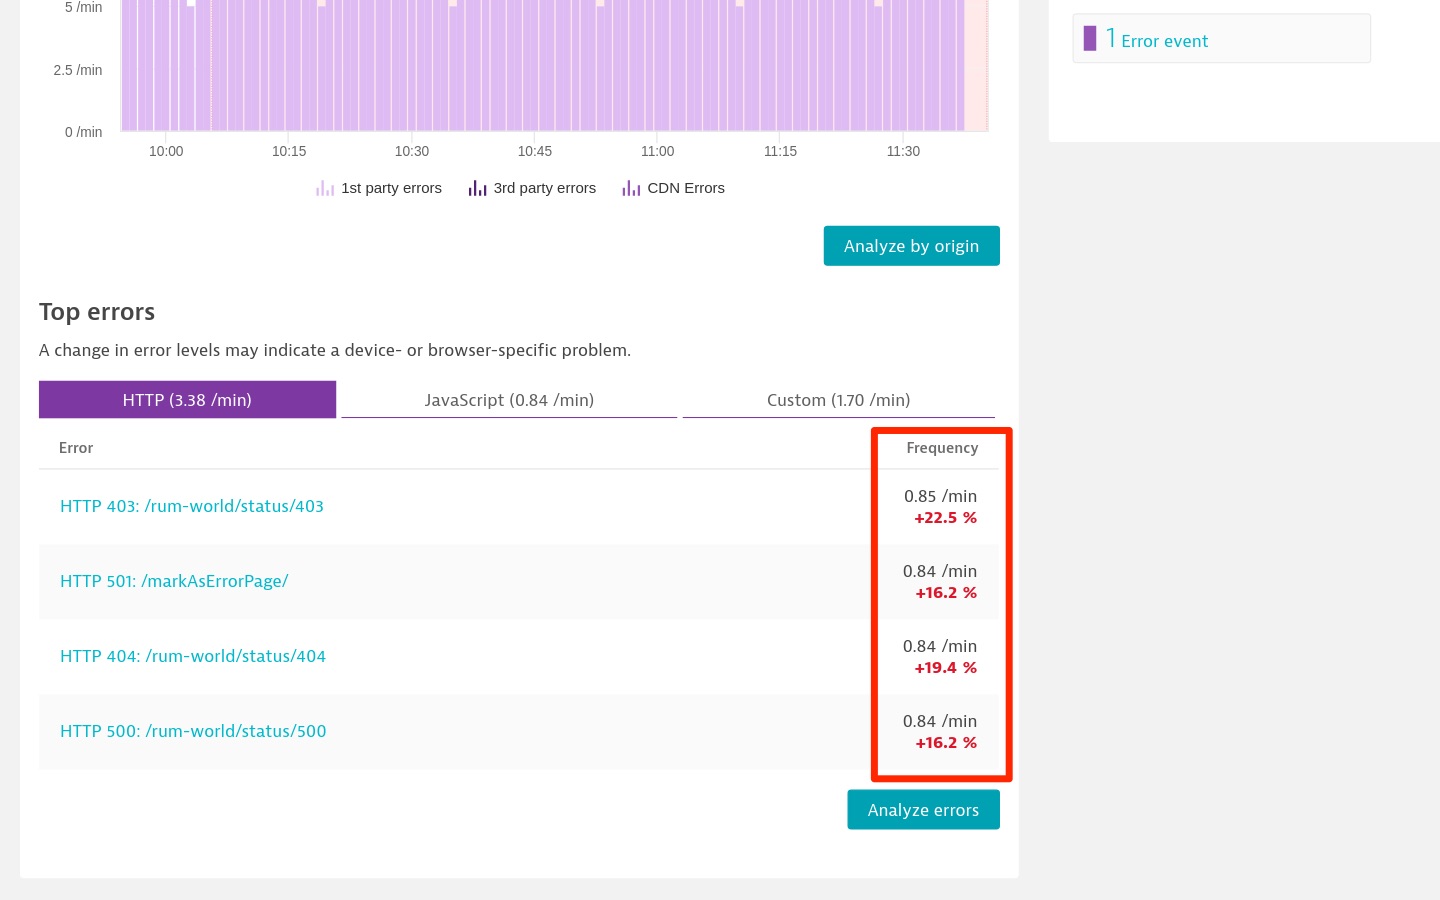
Note: Dynatrace now shows the New label and the percentage increase, visible in the Top errors table, also on the Multidimensional analysis page.
From the application overview page in problem context, to drill further into the root cause of your HTTP or custom errors:
- When almost all errors increase similarly, you might want to look at your errors more broadly on the Multidimensional analysis page for errors—go there by selecting Analyze by type, Analyze by context, or Analyze by origin on the respective error card.
- If only a few errors increased in the Top errors list, or if only a few errors are indicated as New in this table, you might want to jump directly to the respective error details page by clicking the name of the error in the table.
Fine tune what Davis AI considers for alerting
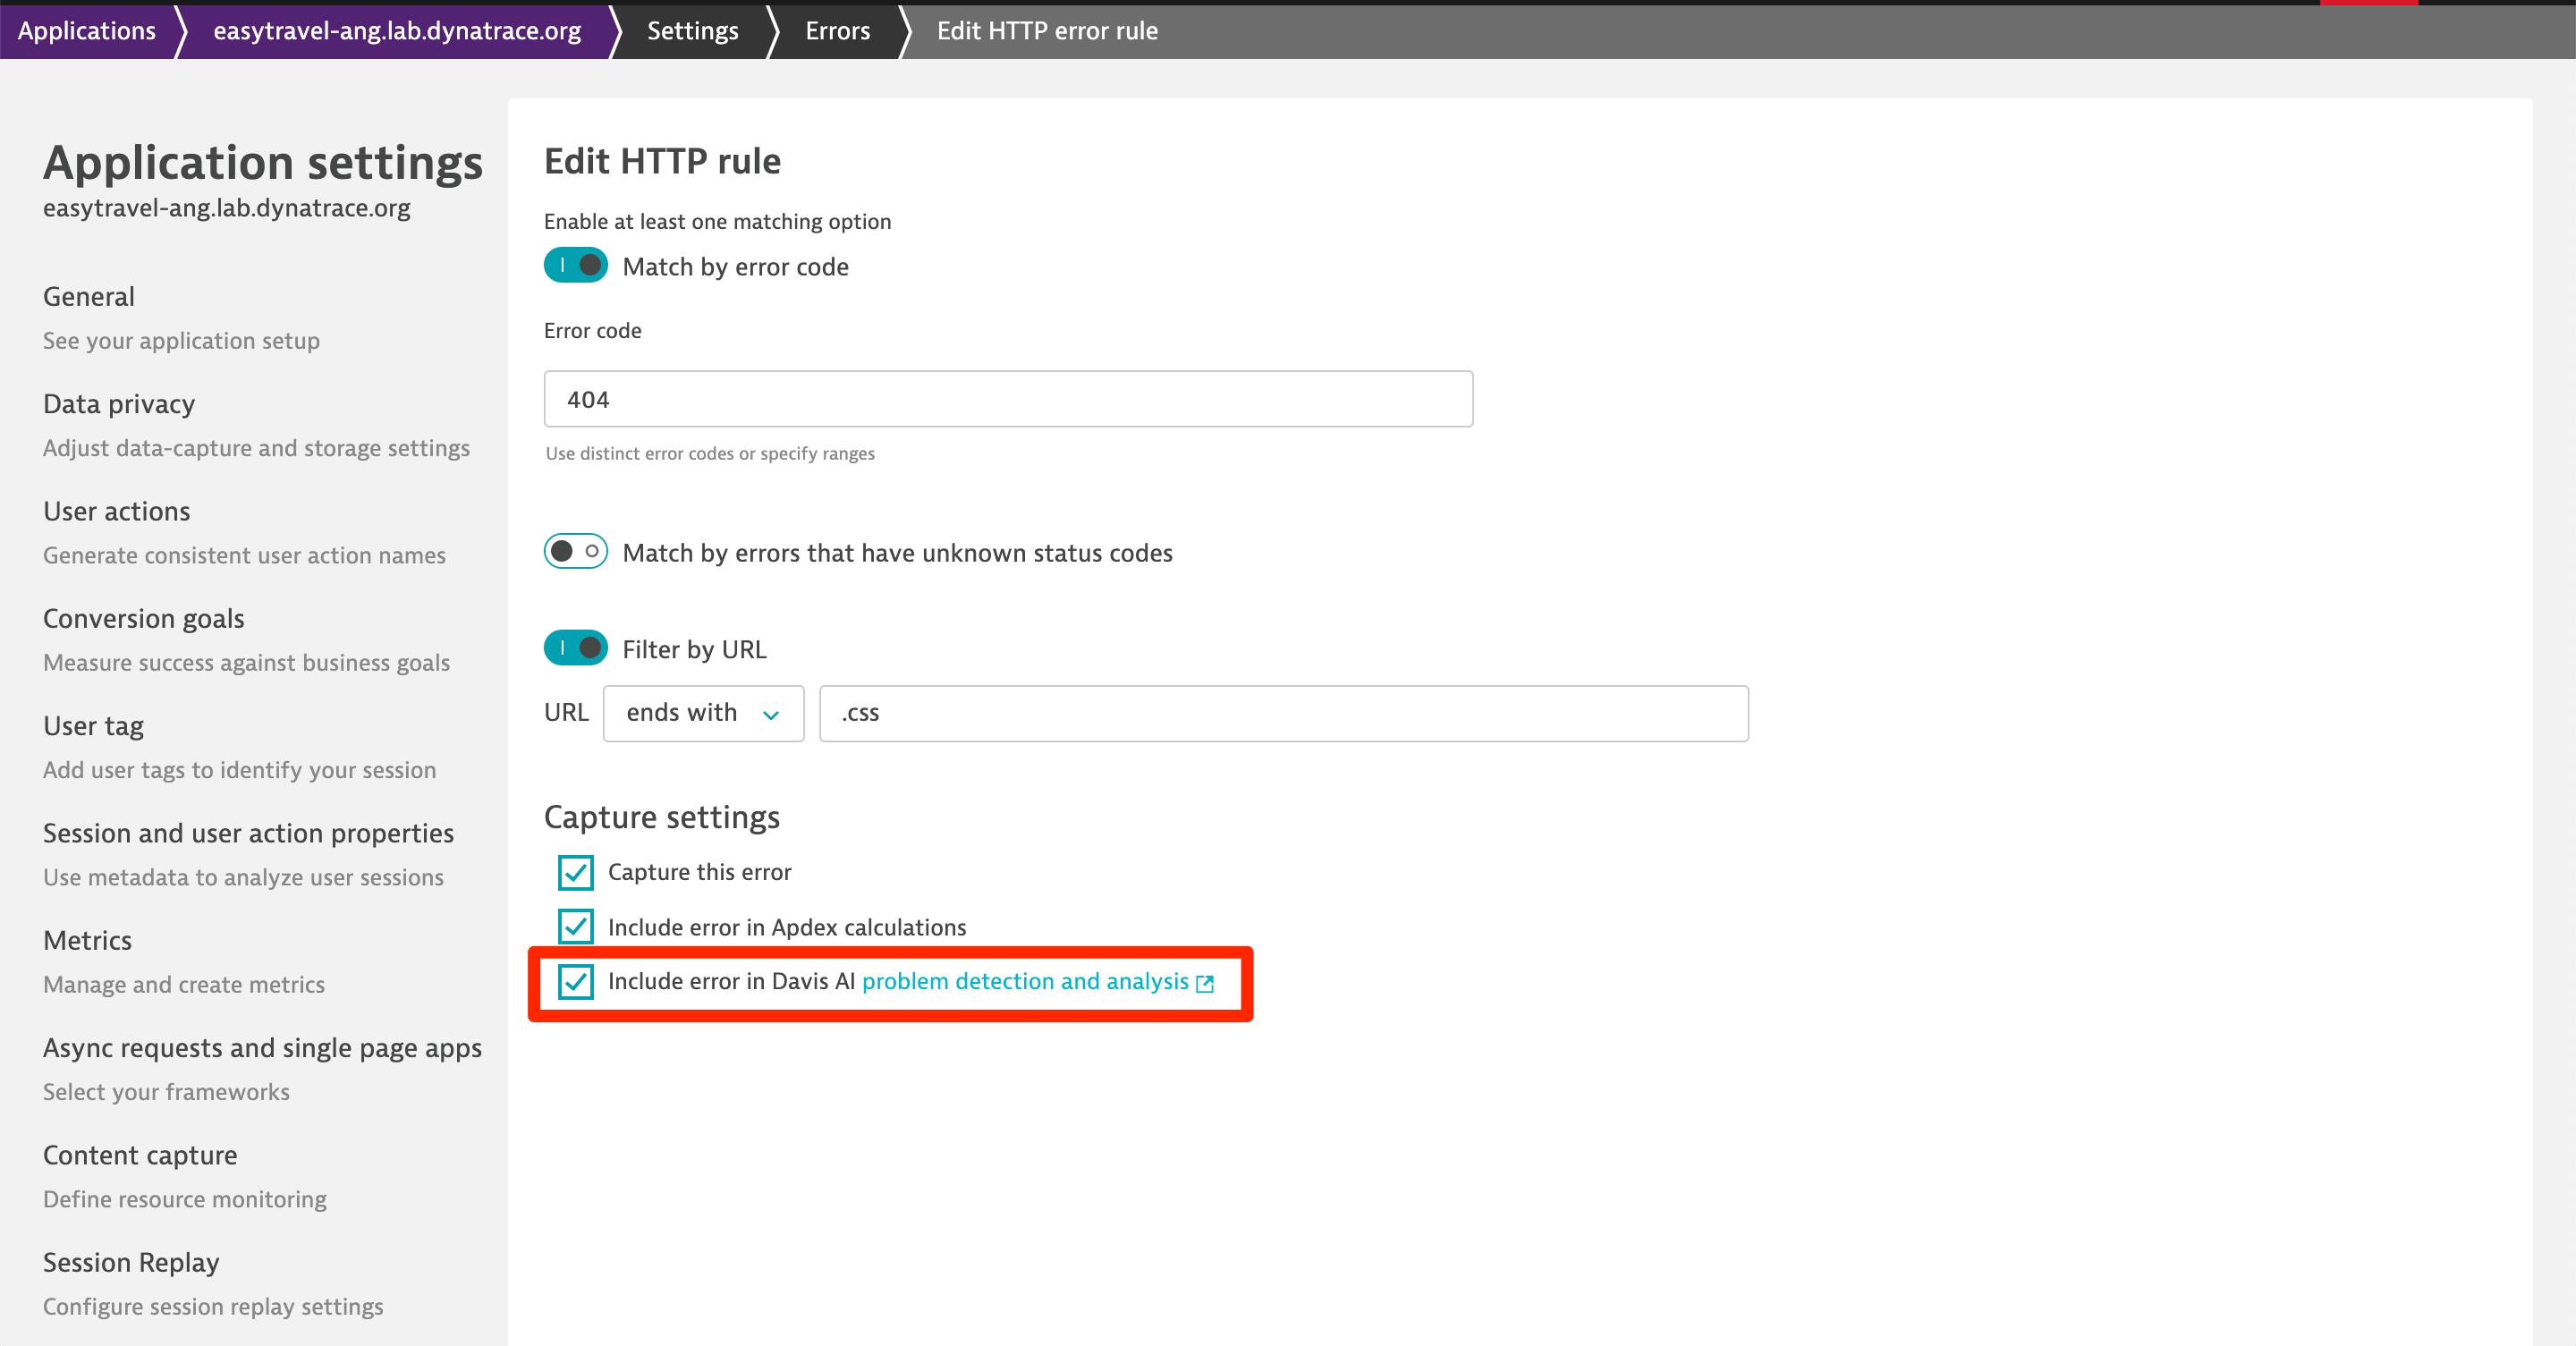
If the settings for error rate increase alerting don’t fit your application, you can make Davis aware of error rules by configuring them for Davis AI analysis in application settings (Settings > Errors).
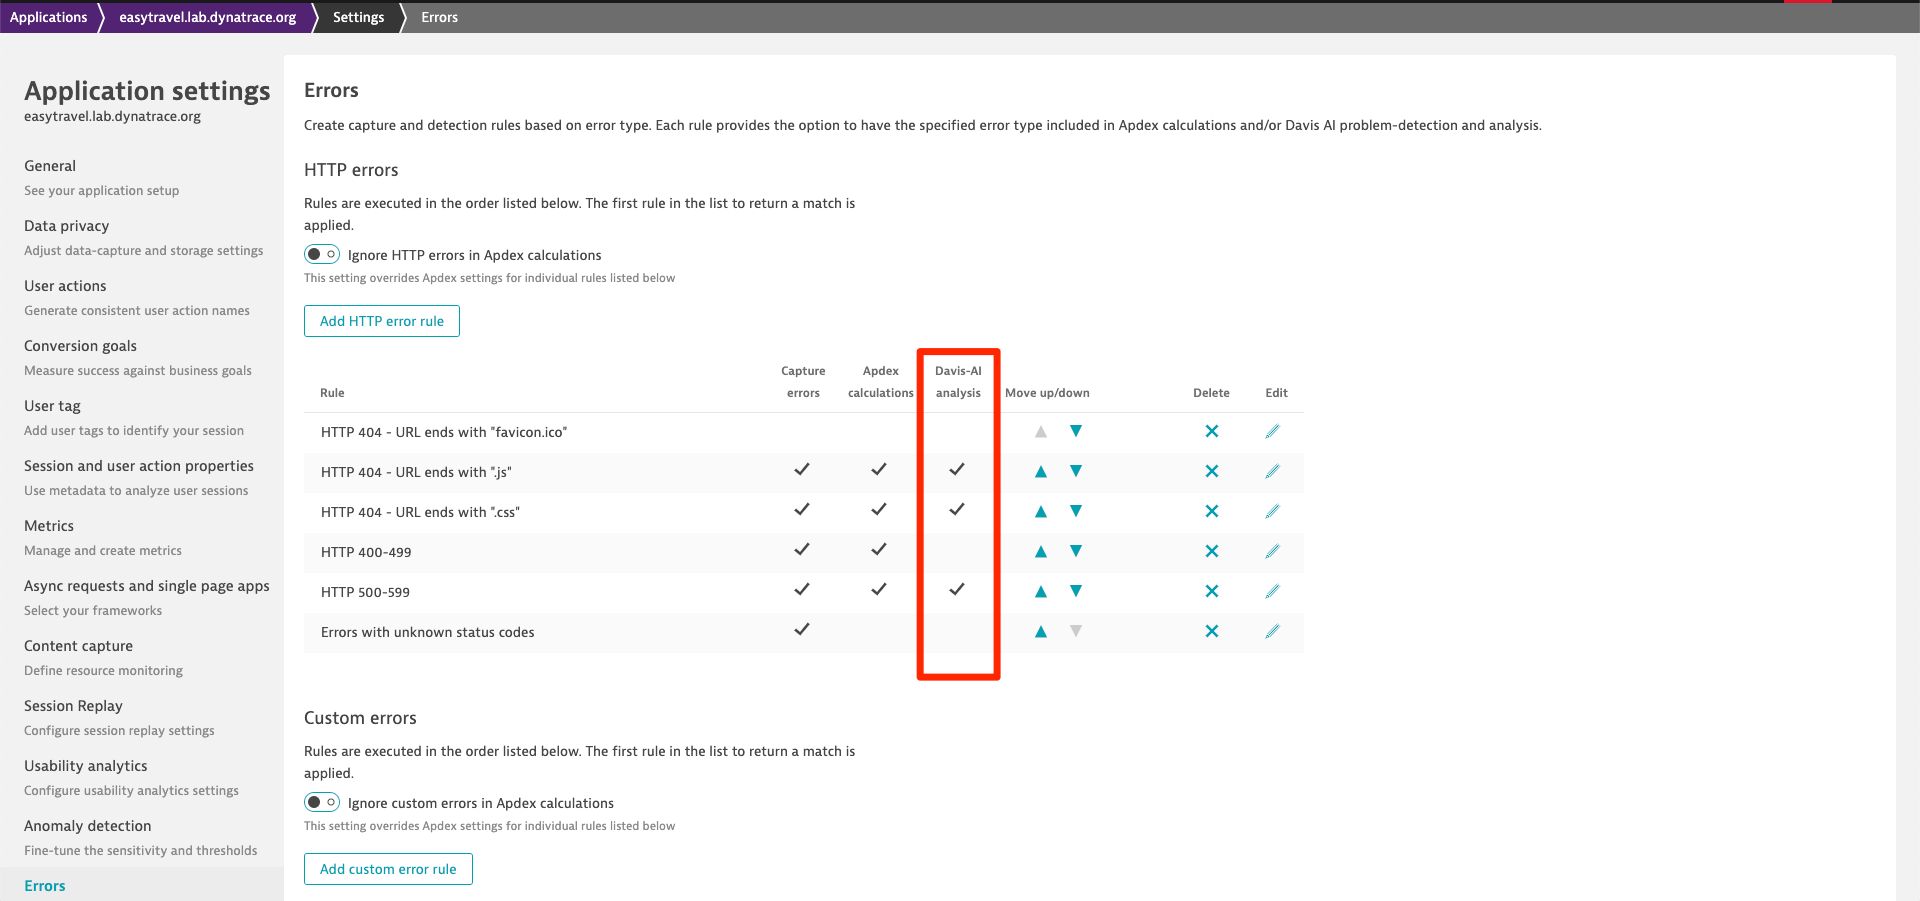
If not already configured for Davis AI analysis, Edit any existing HTTP error rule and select Include error in Davis AI problem detection and analysis, as shown below:
Watch our Performance Clinic video for more about the error rules page. If you want to find out more about how Davis detects your HTTP and custom error rate increases, check out our Automated baselining Help topic and our recent blog post about auto-adaptive metric baselines.
How to enable extended Davis awareness of HTTP and custom errors
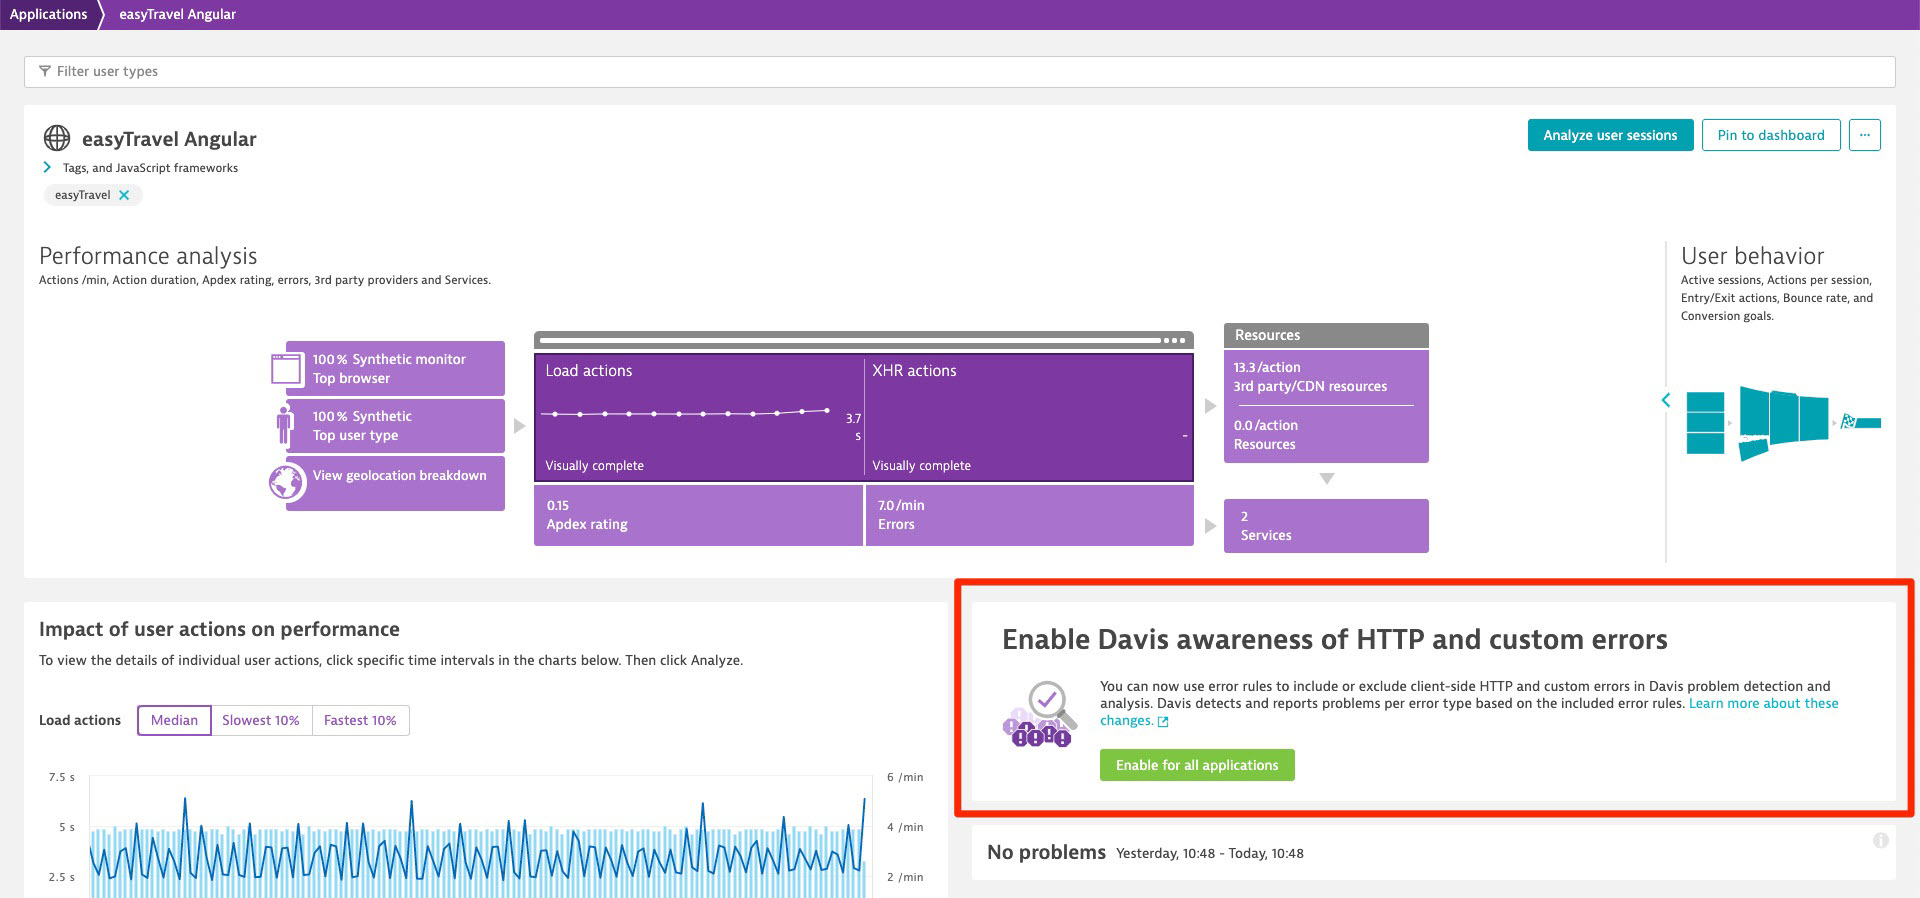
Enable extended Davis AI awareness with a single click via the call-to-action card on both the Applications page (at the bottom of the page) and on each application overview page (see example below). Be aware that clicking this card will enable the feature environment-wide and for all your applications.
What happens once extended Davis awareness is enabled?
Extended Davis awareness:
- Creates the necessary time series for HTTP and custom errors that include all the errors covered by defined error rules on your application’s error settings page for the individual error type.
- Creates the custom events required for alerting on HTTP and custom errors for each application.
- Kicks off the baselining, detection, and reporting of HTTP and custom error-rate increases by Davis.
- Automatically repeats all the steps above whenever you create a new application.
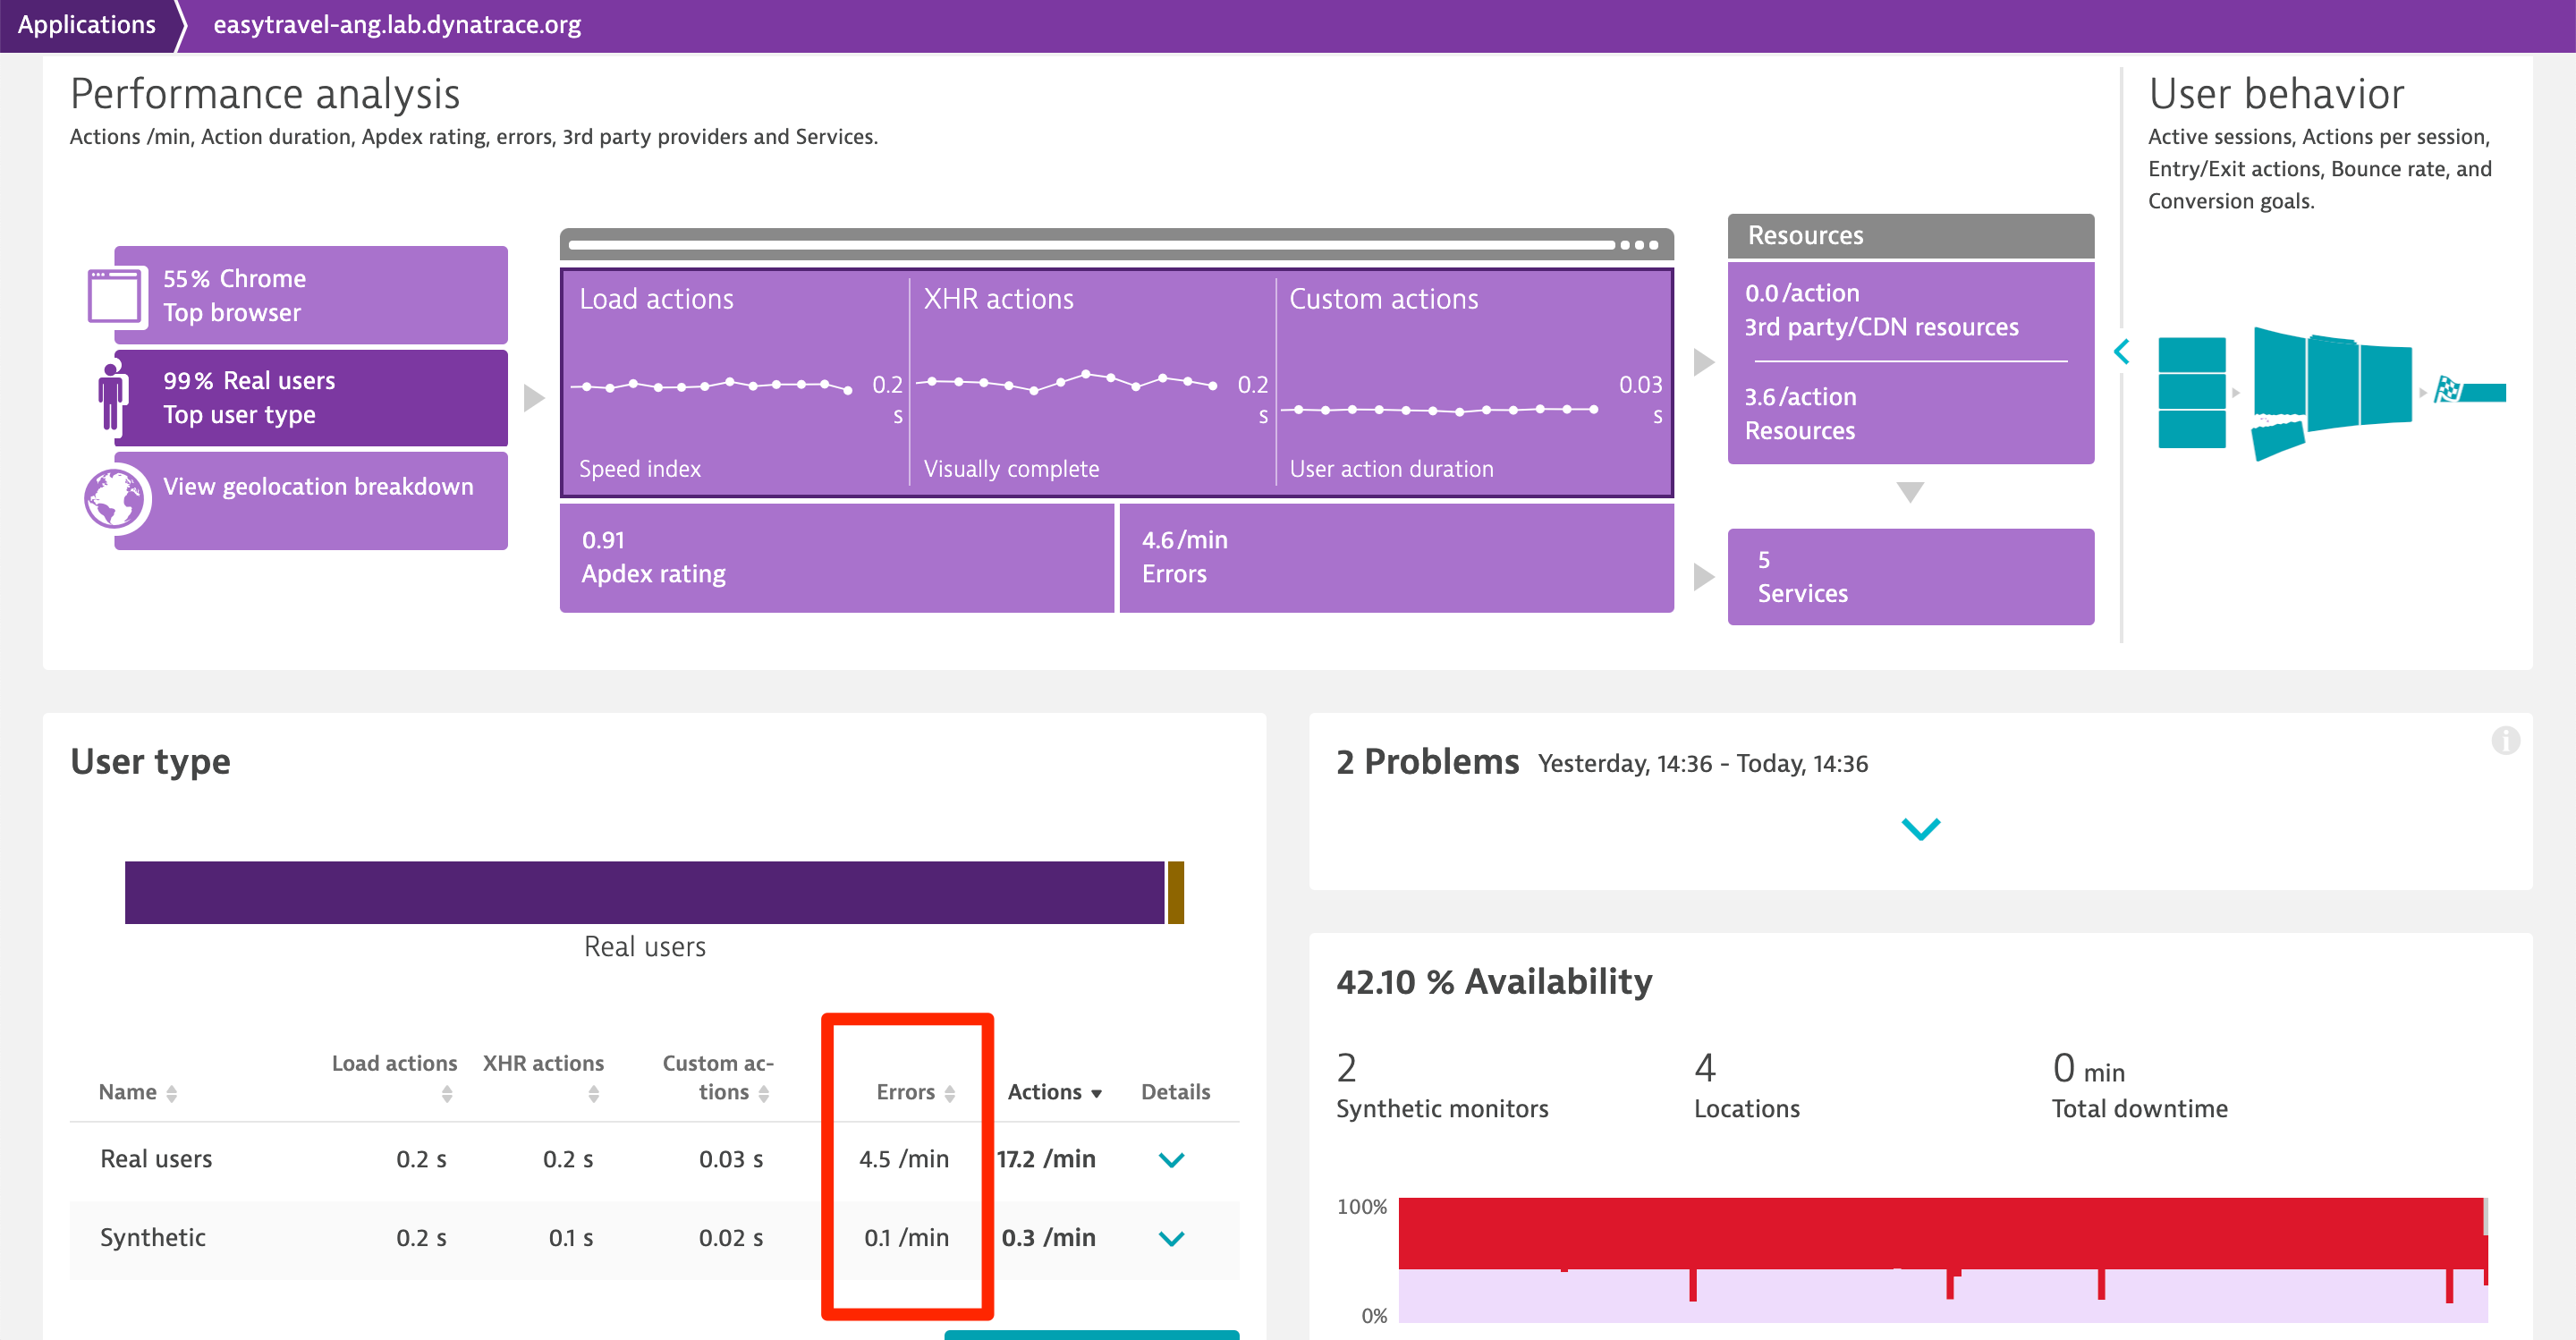
- Replaces all JavaScript error columns in Dynatrace with an Error column that sums up all three error types (see example below), as we now fully support JavaScript, HTTP, and custom error types.
Note: After the time series are created per application, you can also use them in custom charting.
What’s next
Here are the updates we’re working on now to provide you with even better Davis awareness and alerting for HTTP and custom errors:
- The ability to fine-tune what is considered in error analysis and the baselining of HTTP and custom errors for each application (for example, opting to alert only on errors that occur with real users)
- The ability to disable alerting per application
- Further improved problem workflows and problem-context information (for example, further align alerting for all error types) to facilitate troubleshooting of errors
Questions?
We’d love to hear your feedback about our improved error workflows and extended Davis awareness and alerting. Please share your feedback with us at Dynatrace Community.


Looking for answers?
Start a new discussion or ask for help in our Q&A forum.
Go to forum