
In the previous blog post of this series, we discussed the crucial role of Dynatrace as an orchestrator that steps in to stop the testing phase in case of any errors. Additionally, Dynatrace equips SREs and application teams with valuable insights powered by Davis® AI. In this blog post of the series, we will explore the use of Site Reliability Guardian (SRG) in more detail.
SRG is a potent tool that automates the analysis of release impacts, ensuring validation of service availability, performance, and capacity objectives throughout the application ecosystem by examining the effect of advanced test suites executed earlier in the testing phase.
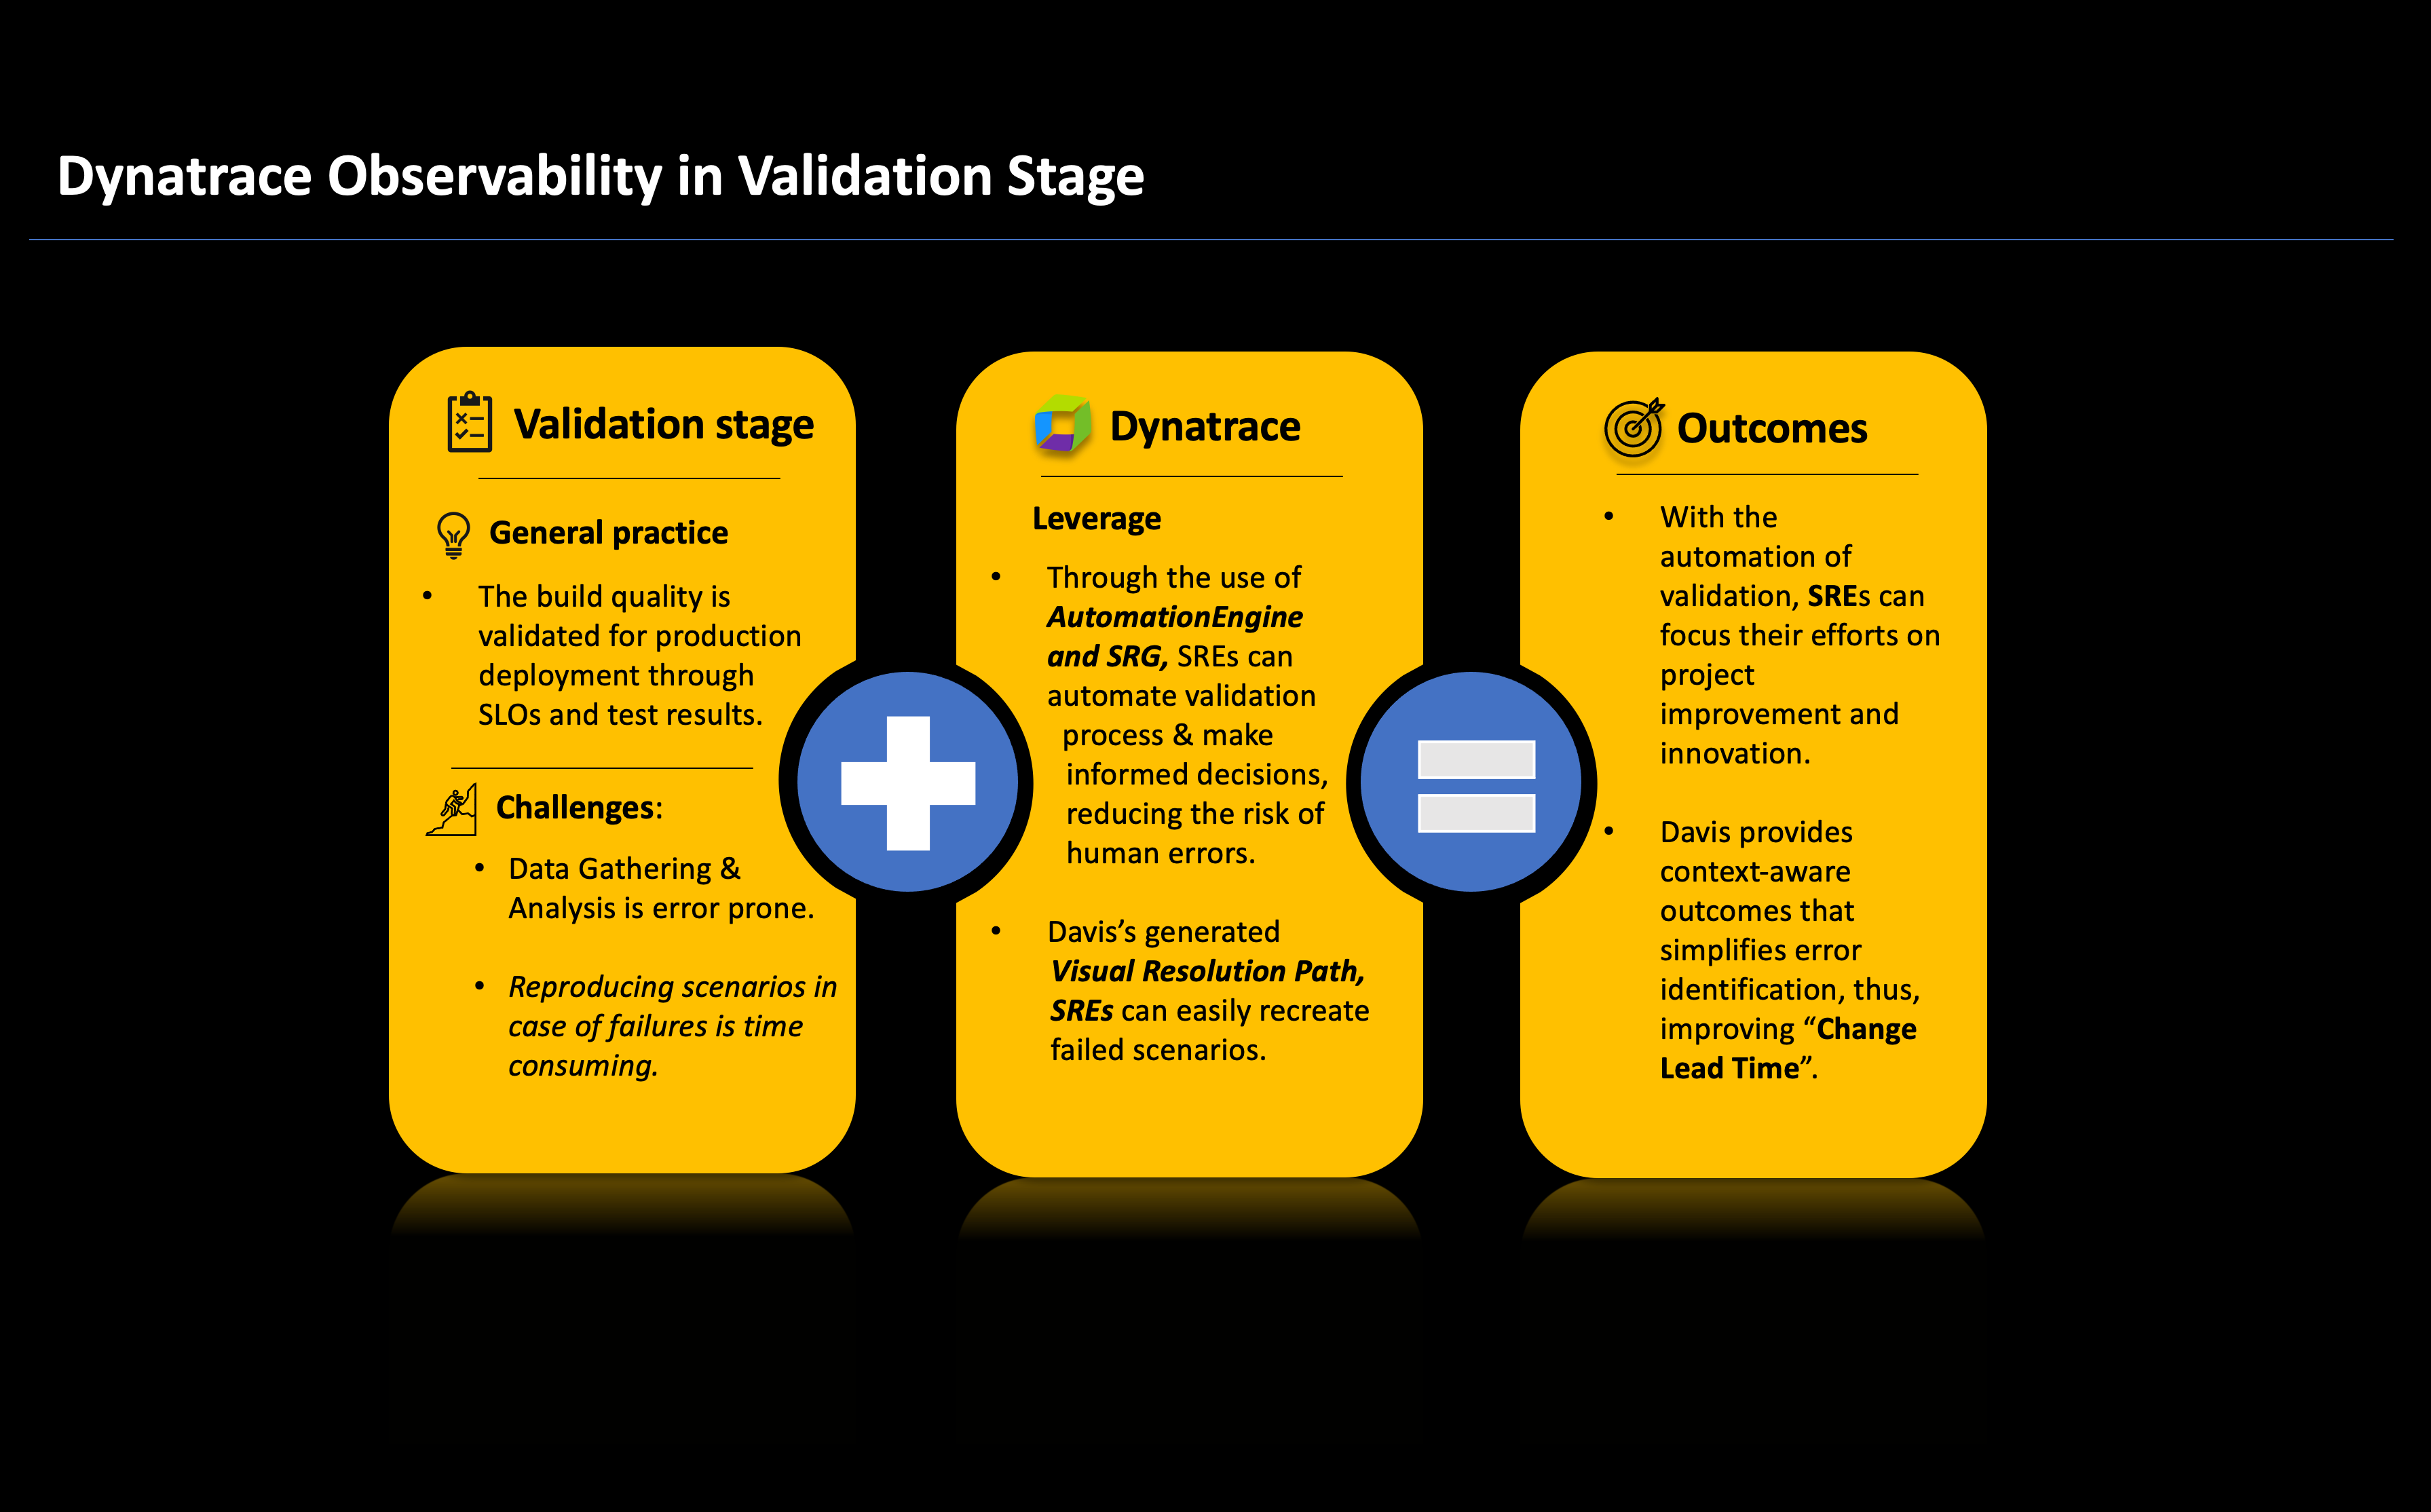
Validation stage overview
The validation stage is a crucial step in the CI/CD (Continuous Integration/Continuous Deployment) process. It involves carefully examining the test results from the previous testing phase. The main goal of this stage is to identify and address any issues or problems that were detected. Doing so reduces the risk of production disruptions and instills confidence in both SREs (Site Reliability Engineers) and end-users. Depending on the outcome of the examination, the build is either approved for deployment to the production environment or rejected.
Challenges of the validation stage
In the Validation phase, SREs face specific challenges that significantly slow down the CI/CD pipeline. Foremost among these is the complexity associated with data gathering and analysis. The burgeoning reliance on cloud technology stacks amplifies this challenge, creating hurdles due to budgetary constraints, time limitations, and the potential risk of human errors. Additionally, another pivotal challenge arises from the time spent on issue identification. Both SREs and application teams invest substantial time and effort in locating and rectifying software glitches within their local environments. These prolonged processes not only strain resources but also introduce delays within the CI/CD pipeline, hampering the timely release of new features to end-users.
Mitigate challenges with Dynatrace
With the support of Dynatrace Grail™, AutomationEngine, and the Site Reliability Guardian, SREs and application teams are assisted in making informed release decisions by utilizing telemetry observability and other insights. Additionally, the Visual Resolution Path within generated problem reports helps in reproducing issues in their environments. The Visual Resolution Path offers a chronological overview of events detected by Dynatrace across all components linked to the underlying issue. It incorporates the automatic discovery of newly generated compute resources and any static resources that are in play. This view seamlessly correlates crucial events across all affected components, eliminating the manual effort of sifting through various monitoring tools for infrastructure, process, or service metrics. As a result, businesses and SREs can redirect their manual diagnostic efforts toward fostering innovation.
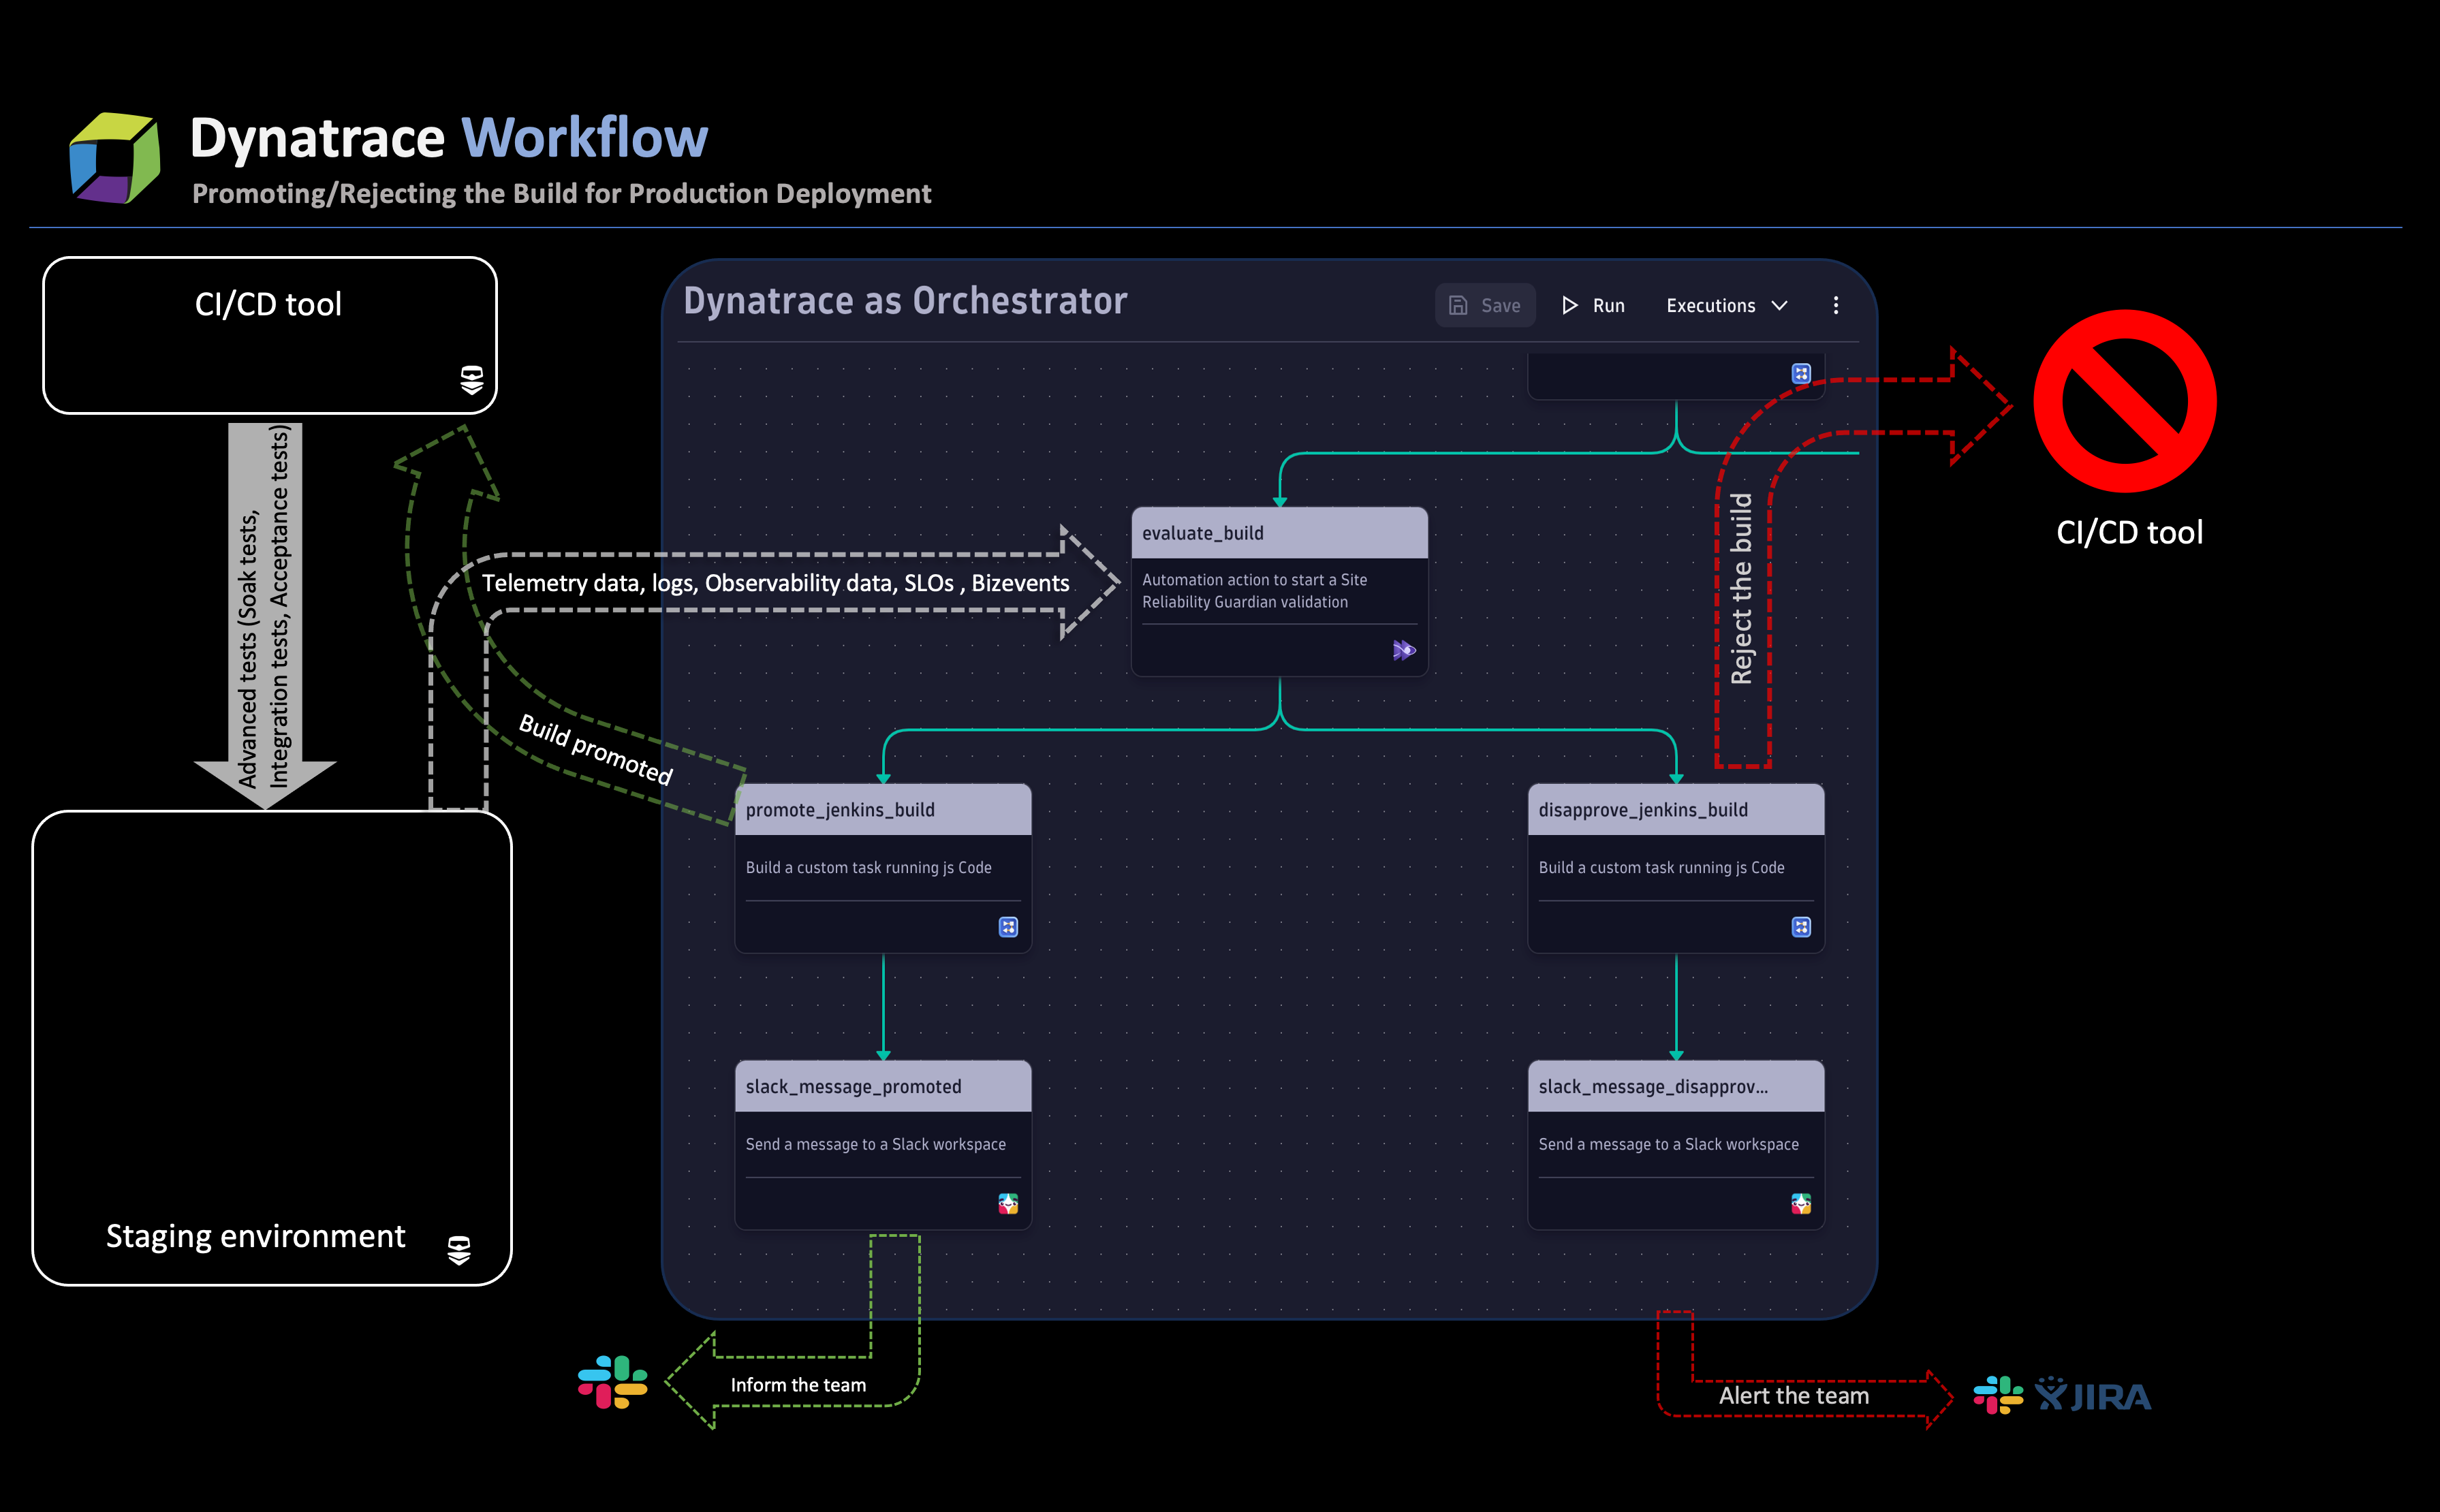
- Configure an action for the Site Reliability Guardian in the workflow. The action should focus on validating the guardian’s adherence to the application ecosystem’s specific objectives (SLOs). Additionally, align the action’s validation window with the timeframe derived from the recently completed test events.
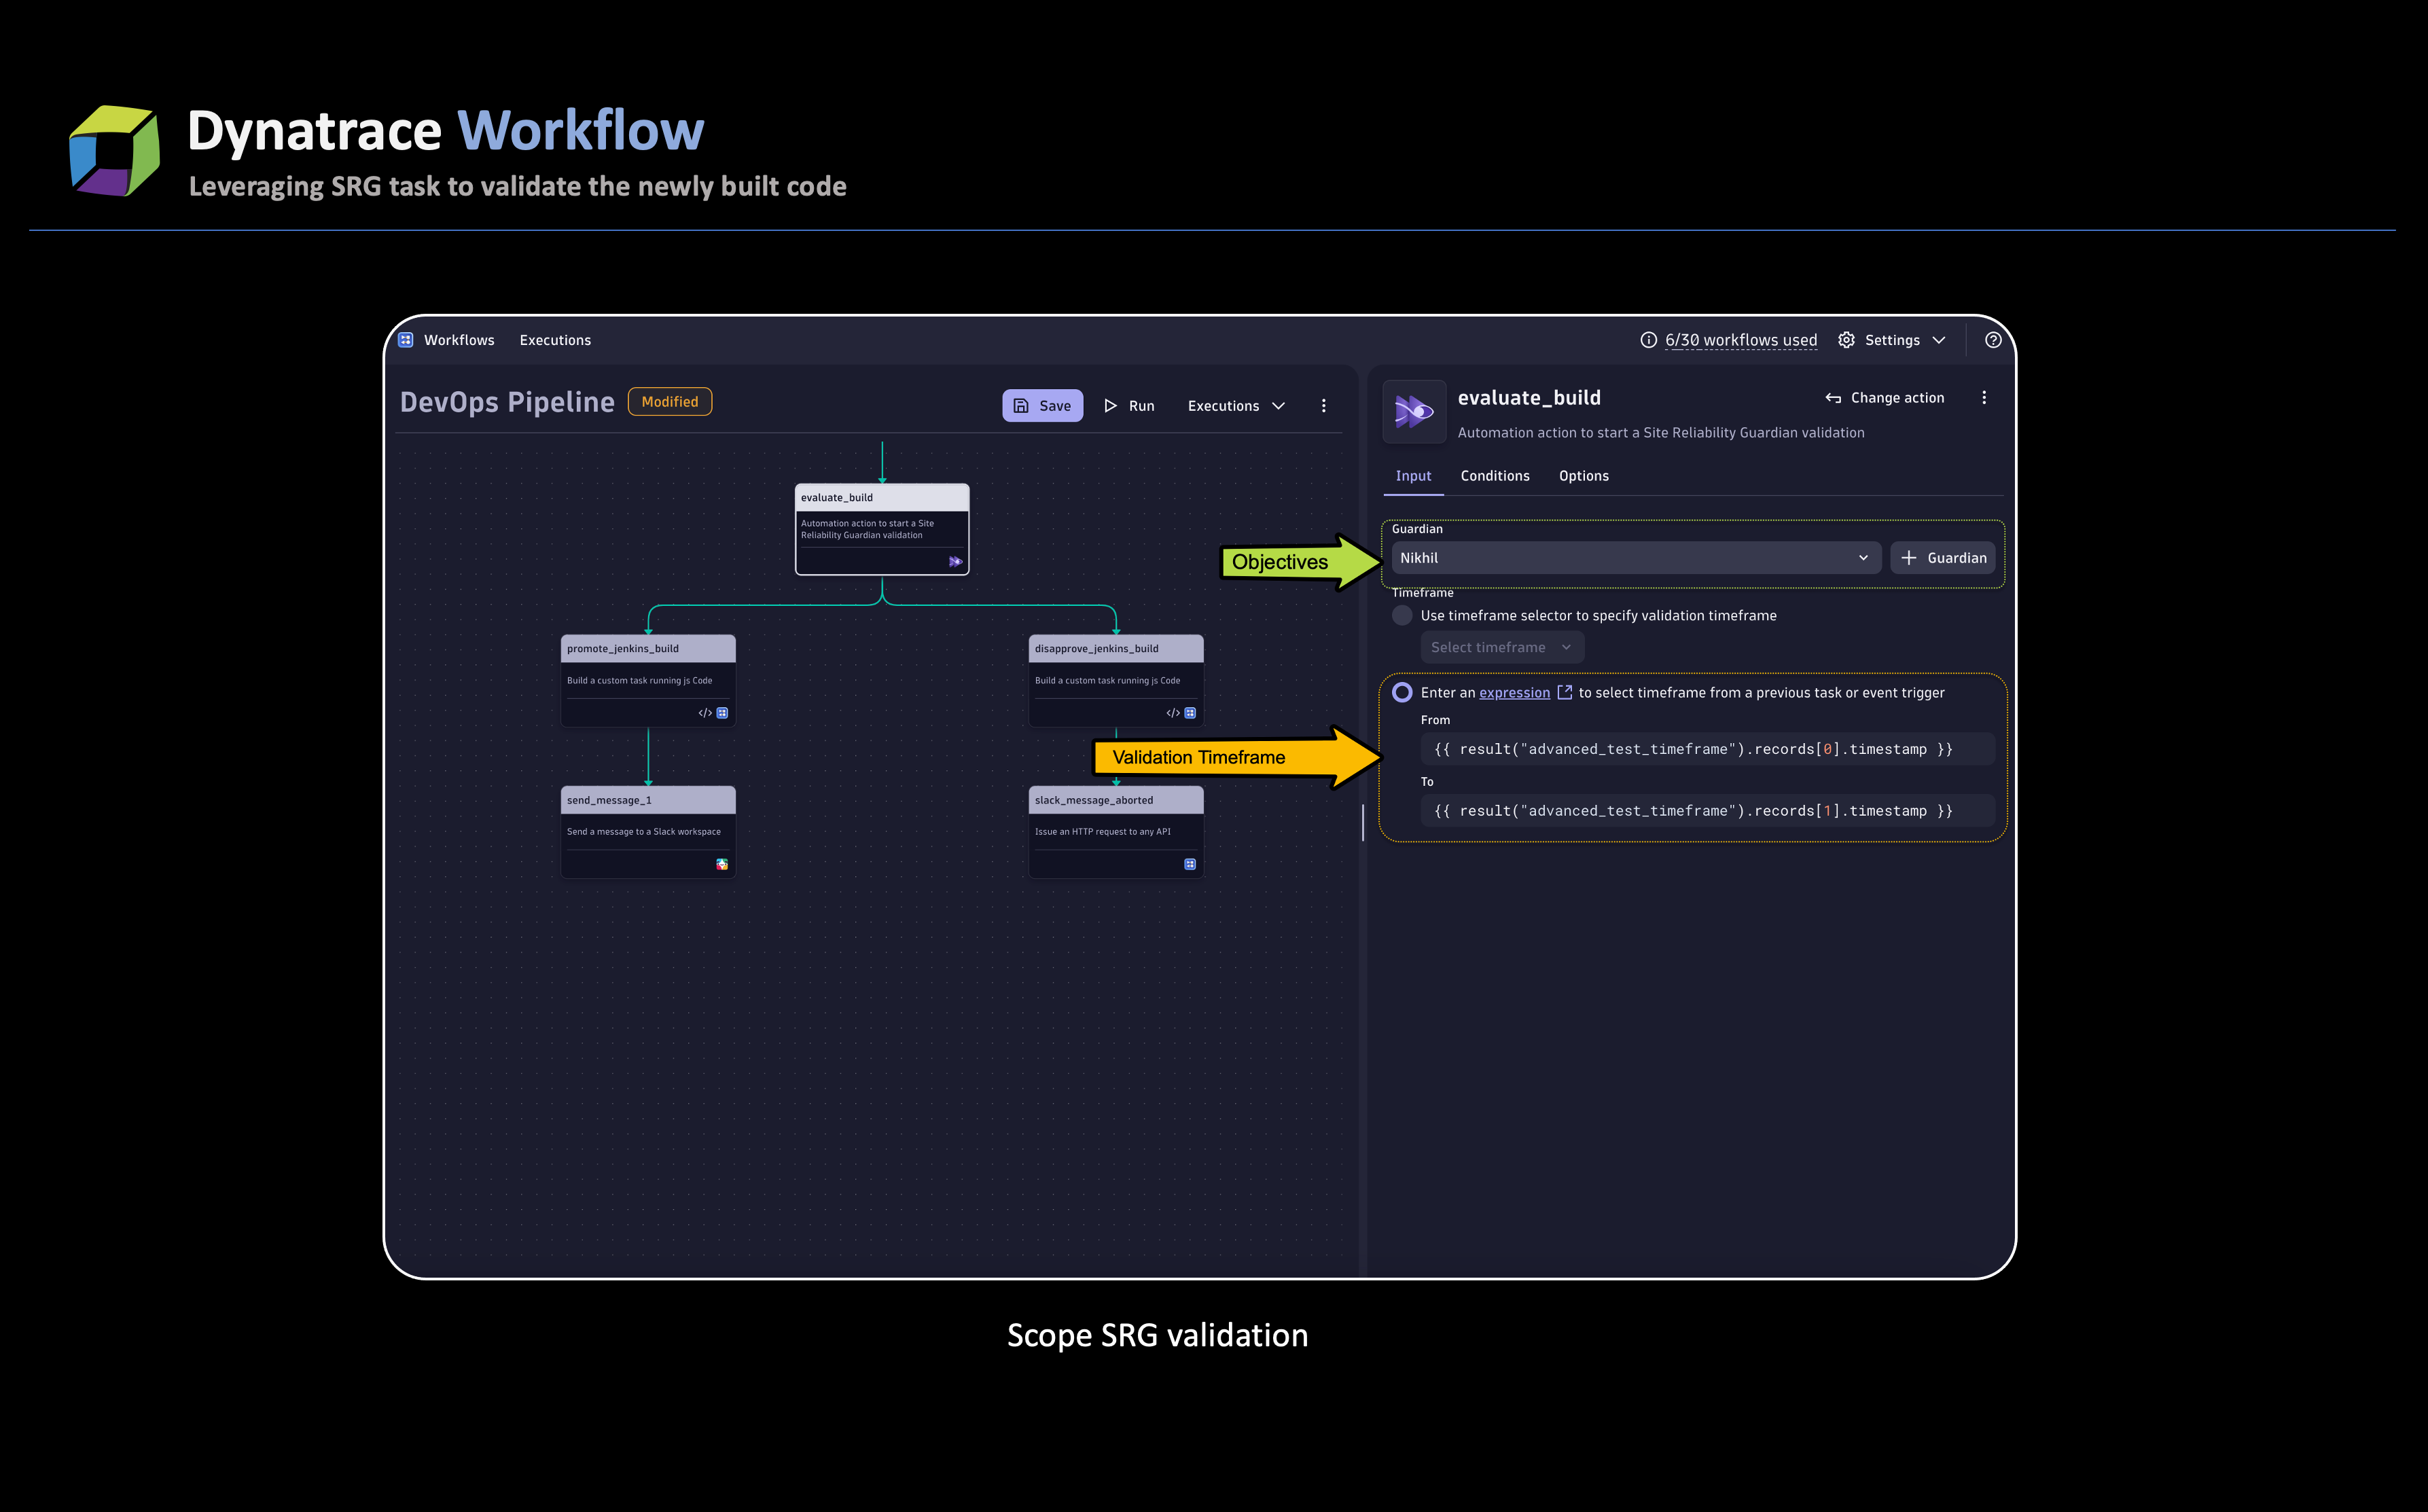
- As the action begins, the Site Reliability Guardian (SRG) evaluates the set objective by analyzing the telemetry data produced during advanced test runs. At the same time, SRG uses DAVIS_EVENTS to identify any potential problems which could result in one of two outcomes.
Outcome #1: Build promotion
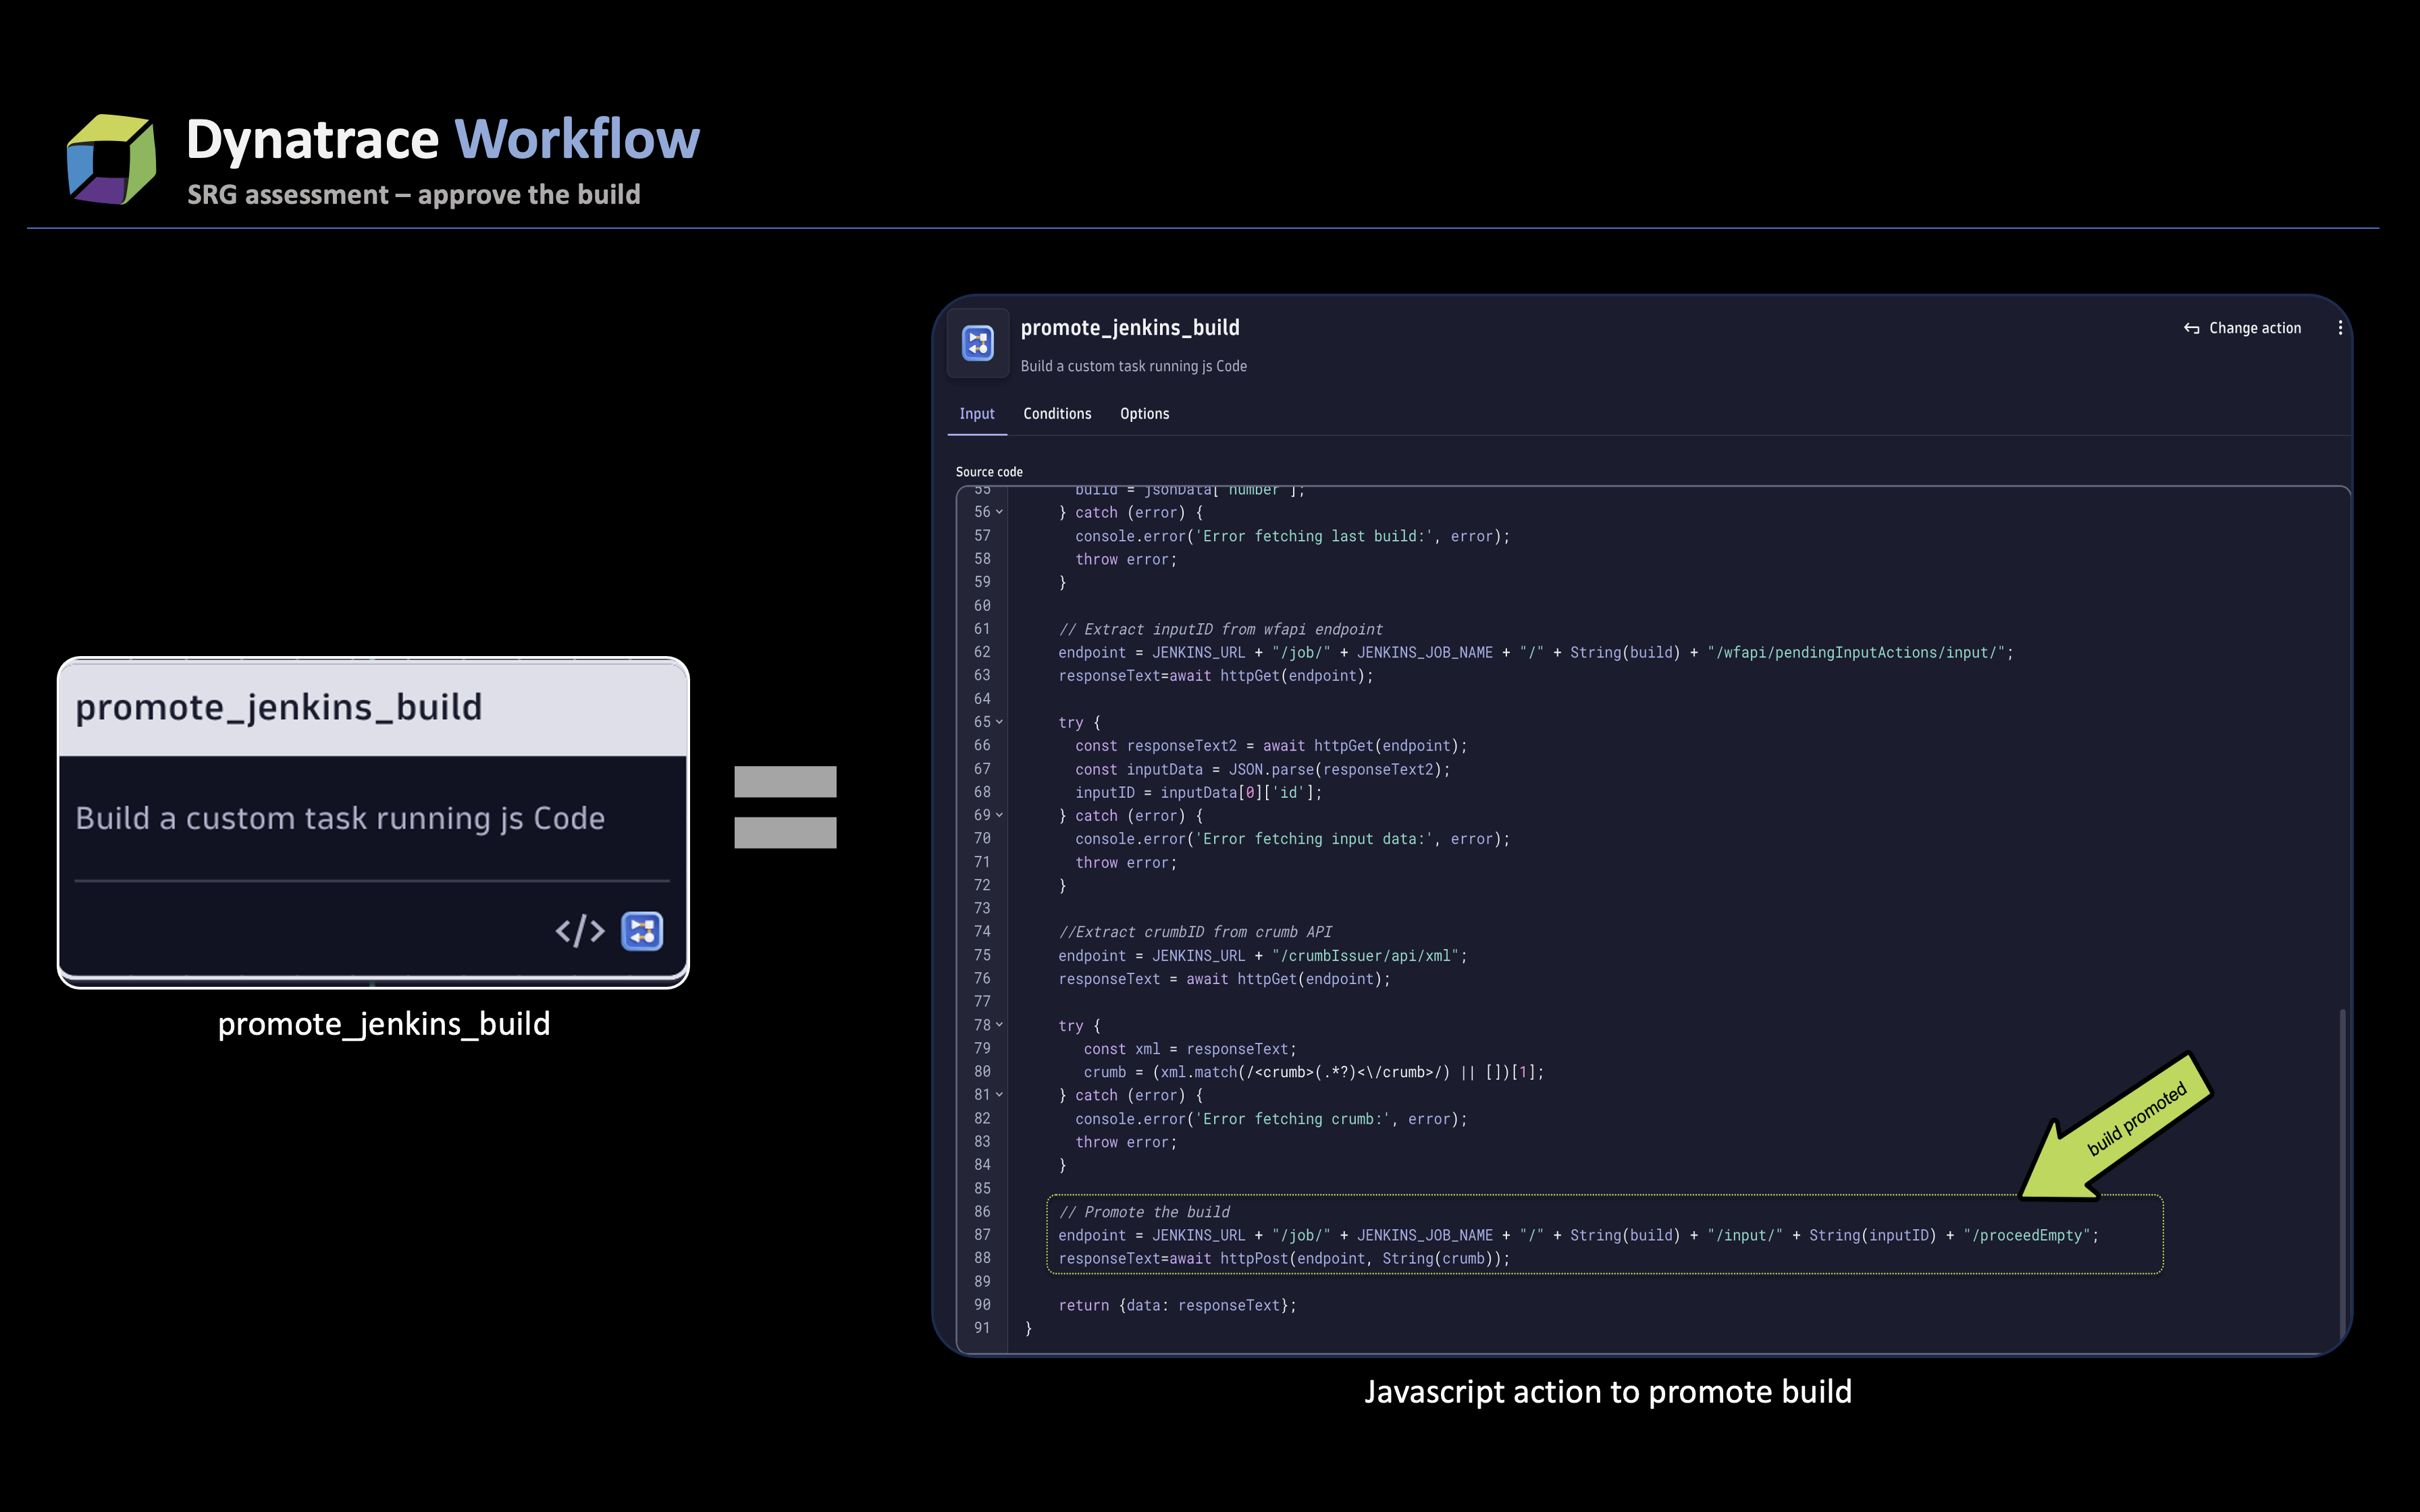
Once the newly developed code is in line with the objectives outlined in the Guardian—and assuming that Davis AI doesn’t generate any new events—the SRG action activates the successful path in the workflow. This path includes a JavaScript action called promote_jenkins_build, which triggers an API call to approve the build being considered, leading to the promotion of the build deployment to production.
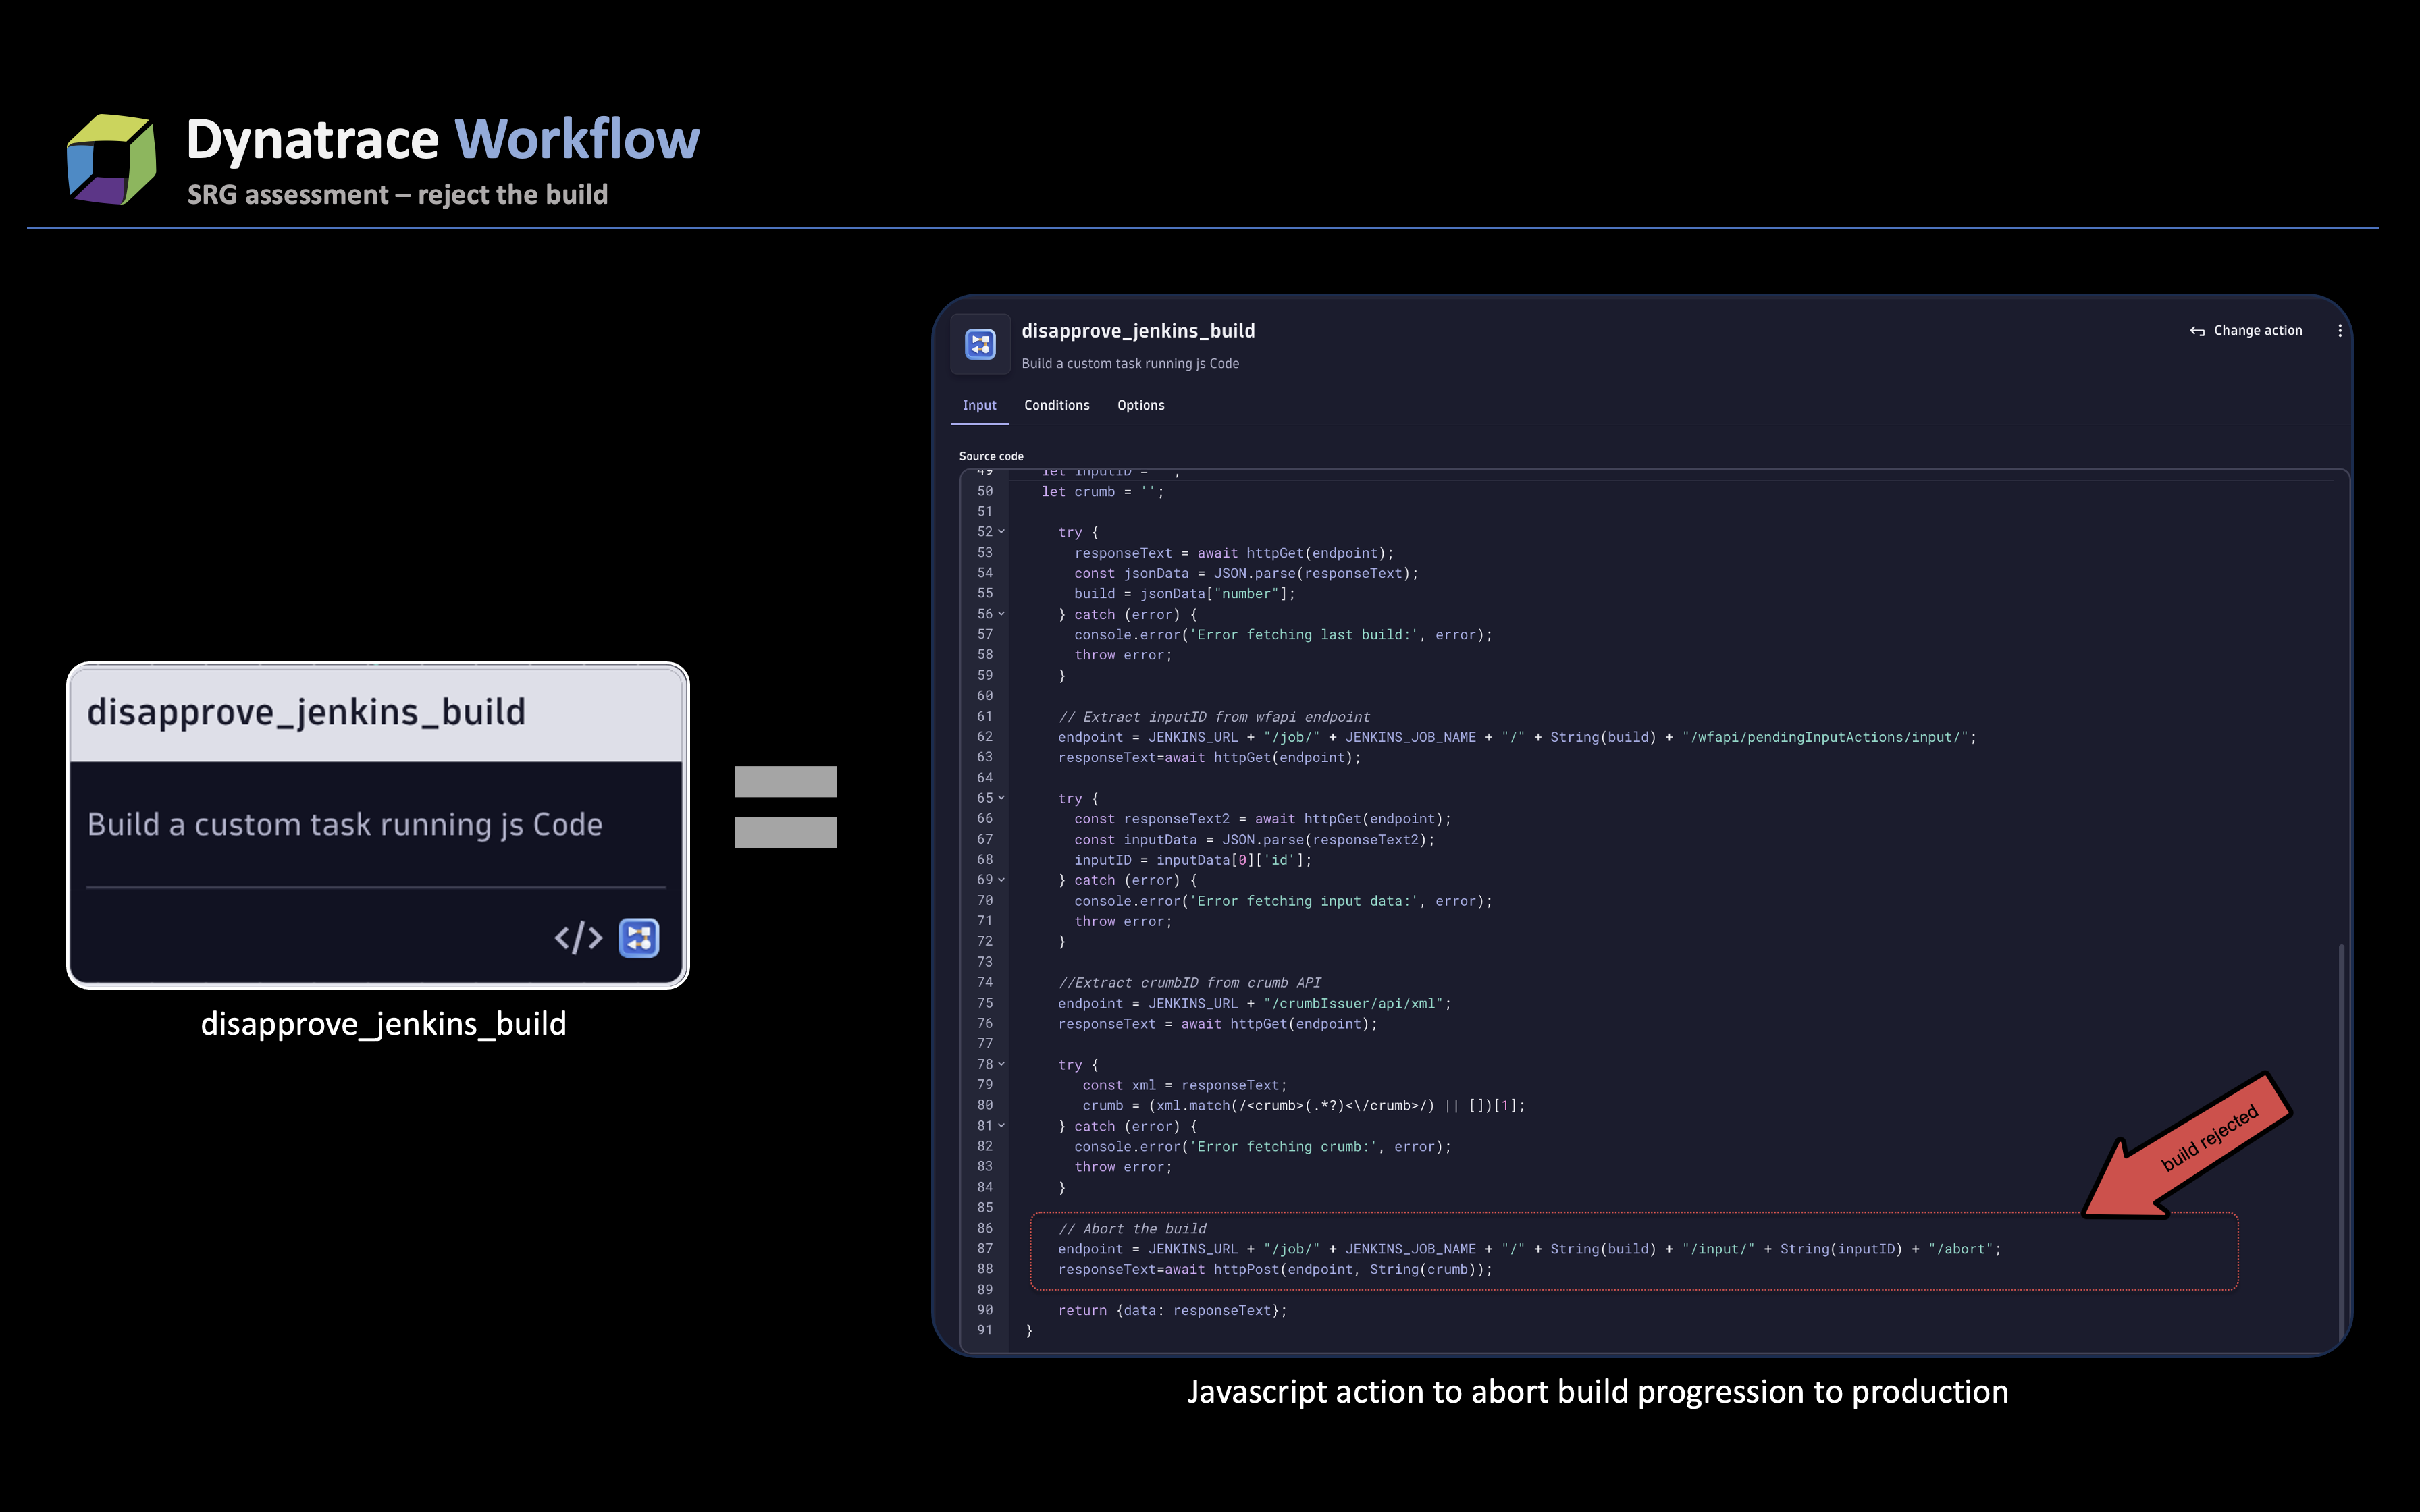
Outcome #2: Build rejection
If Davis AI generates any issue events related to the wider application ecosystem or if any of the objectives configured from the defined guardian are not met, the build rejection workflow is automatically initiated. This triggers the disapprove_jenkins_build JavaScript action, which leads to the rejection of the build.
Moreover, by utilizing helpful service analysis tools such as Response Time Hotspots and Outliers, SREs can easily identify the root cause of any issues and save considerable time that would otherwise be spent on debugging or taking necessary actions. SREs can also make use of the Visual Resolution Path to recreate the issues on their setup or identify the events for different components that led to the issue. In both scenarios, a Slack message is sent to the SREs and the impacted app team, capturing the build promotion or rejection.The telemetry data’s automated analytics, powered by SRG and Davis AI, simplify the process of promoting builds. This approach effectively tackles the challenges that come with complex application ecosystems. Additionally, the integration of service tools and Visual Resolution Path helps to identify and fix issues more quickly, resulting in an improved mean time to repair (MTTR).
Validation in the platform engineering context
Dynatrace—essential within the realm of platform engineering—streamlines the validation process, providing critical insights into performance metrics and automating the identification of build failures. By leveraging SRG and Visual Resolution Path, along with Davis AI causal analysis, development teams can quickly pinpoint issues, and further rectify them ensuring a fail-smart approach. The integration of service analysis tools further enhances the validation phase by automating code-level inspections and facilitating timely resolutions. Through these orchestrated efforts, platform engineering promotes a collaborative environment, enabling more efficient validation cycles and fostering continuous enhancement in software quality and delivery.
In conclusion, the integration of Dynatrace observability provides several advantages for SREs and DevOps, enabling them to enhance the key DORA metrics:
- Deployment Frequency: Improved deployment rate through faster and more informed decision-making. SREs gain visibility into each stage, allowing them to build faster and promptly address issues using the Dynatrace feature set.
- Change Lead Time: Enhanced efficiency across stages with Dynatrace observability and security tools, leading to quicker postmortems and fewer interruption calls for SREs.
- Change Failure Rate: Reduction in incidents and rollbacks achieved by utilizing “Configuration Change” events or deployment and annotation events in Dynatrace. This enables SREs to allocate their time more effectively to proactively address actual issues instead of debugging underlying problems.
- Time to restore service: While these proactive approaches can help improve Deployment Frequency and Change Lead Time, telemetry observability data with Dynatrace AI causation engine Davis AI can aid in improving Time to restore service.
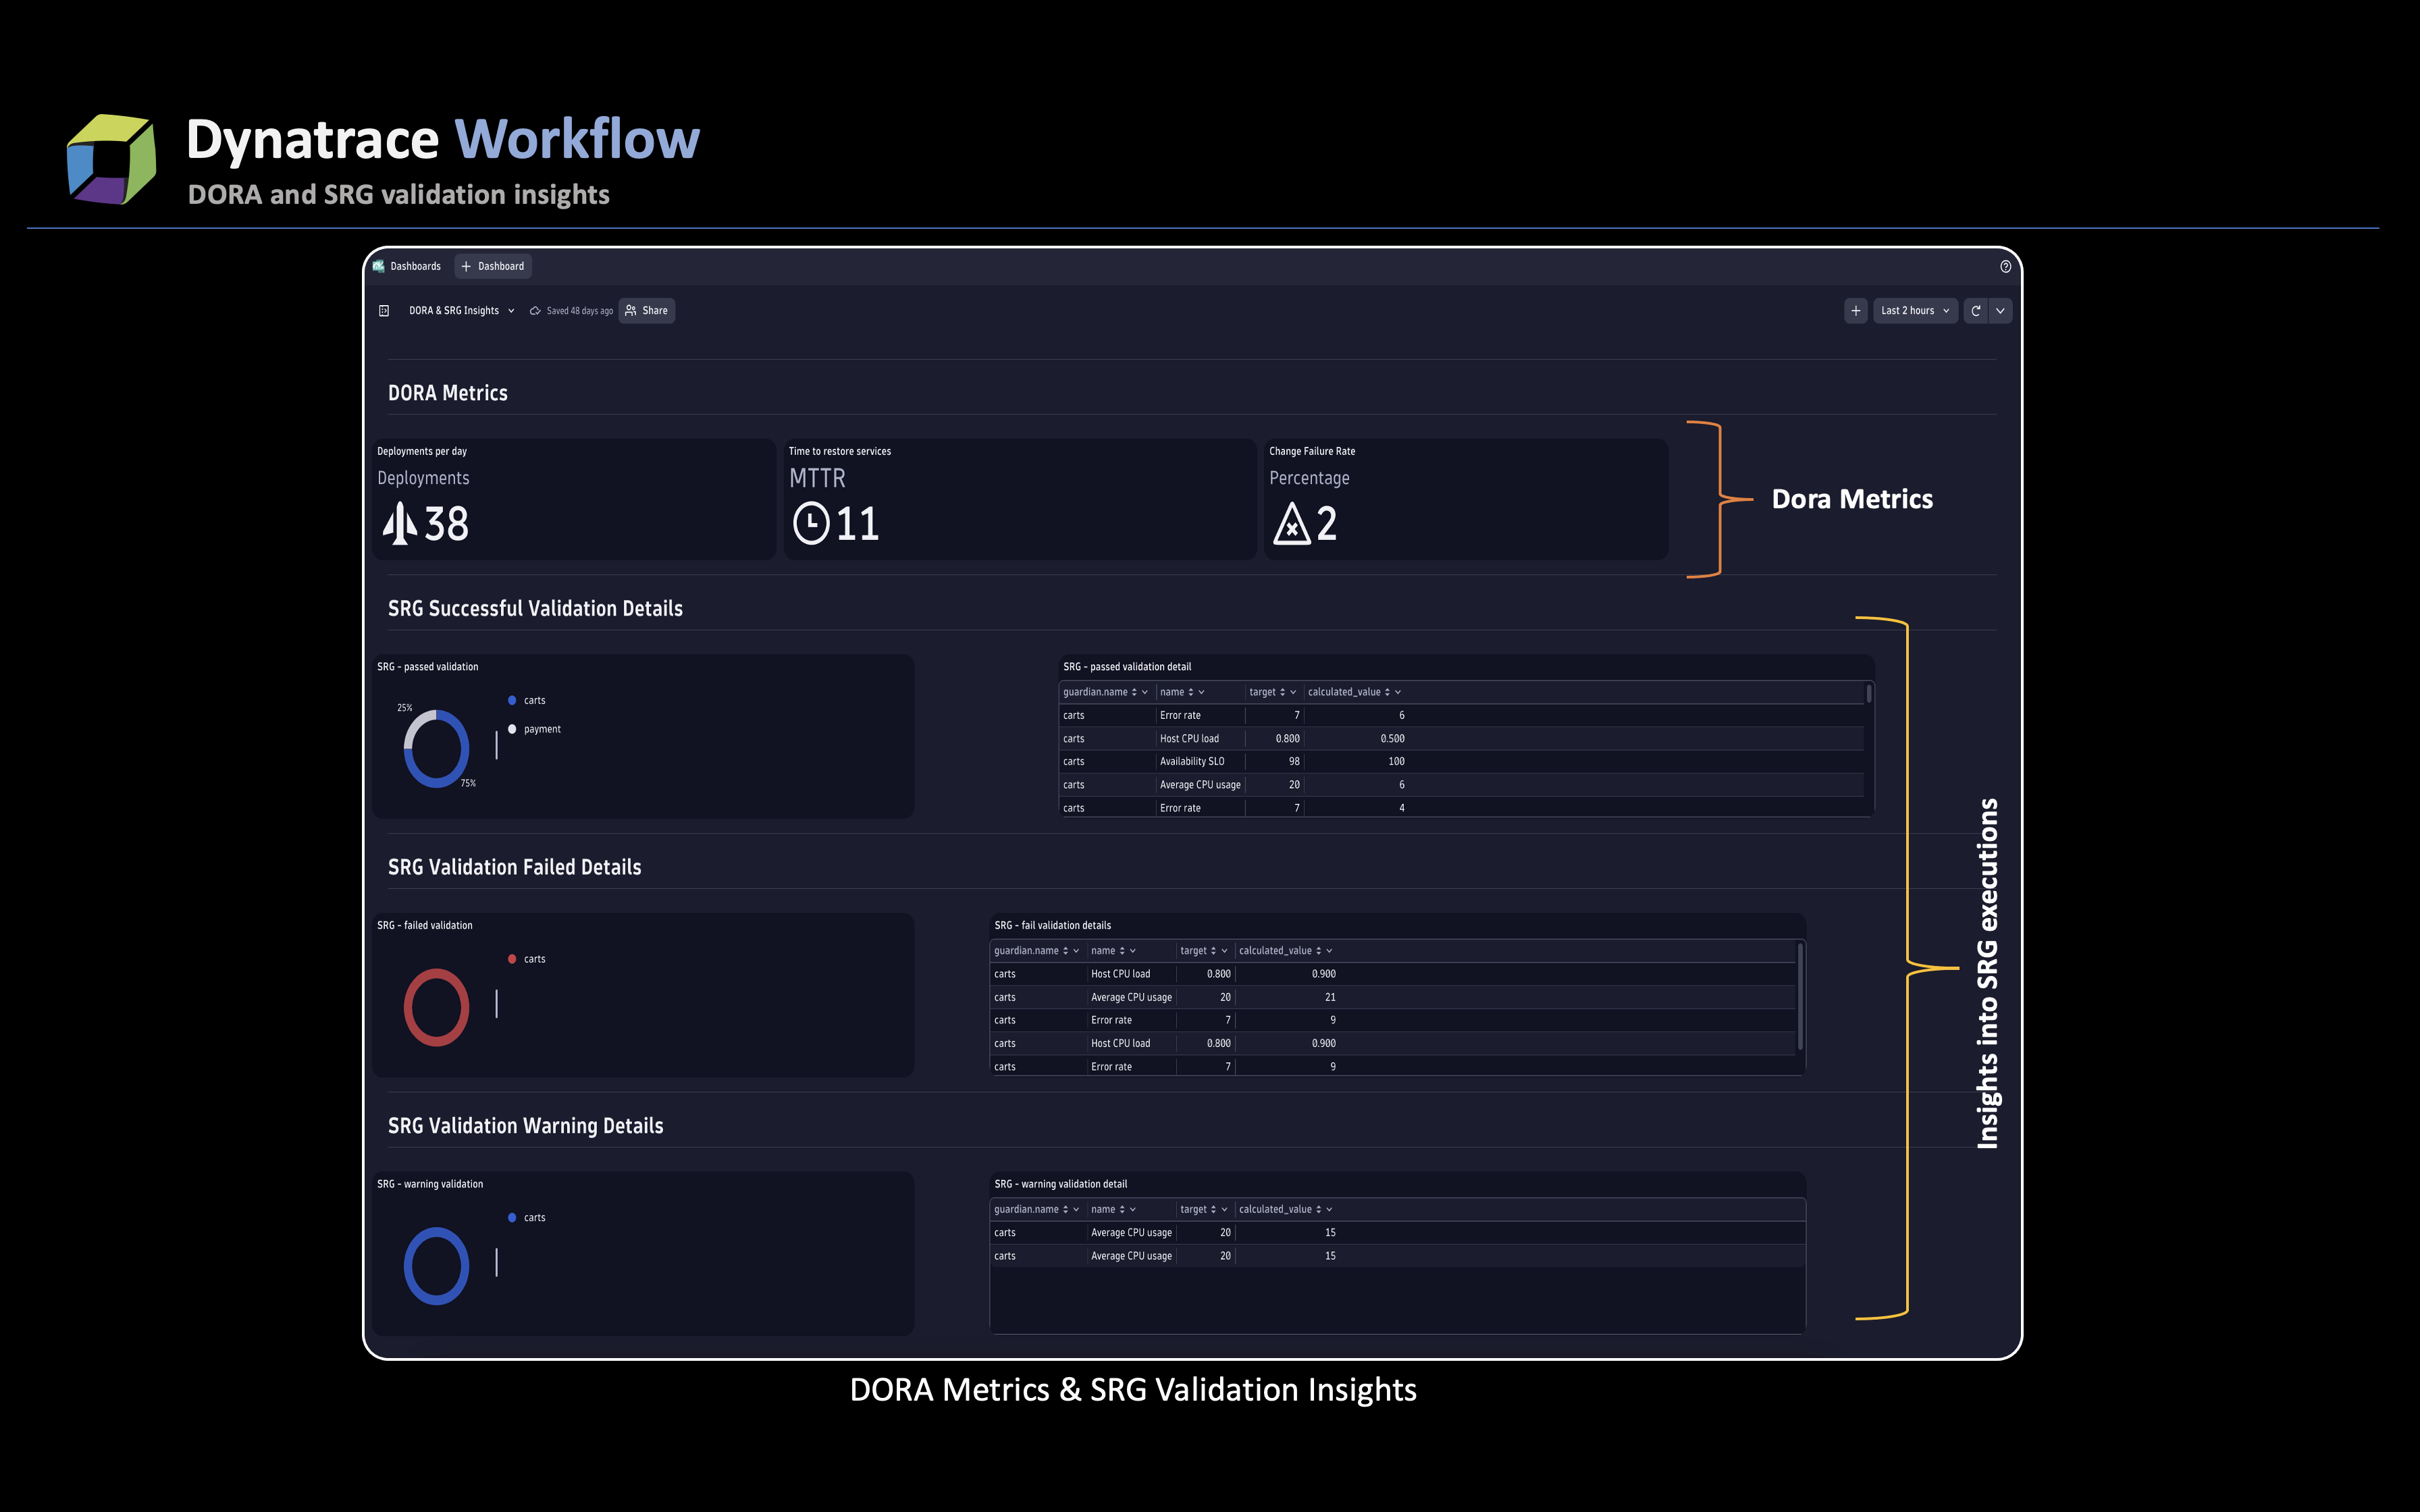
In addition, Dynatrace can leverage the events and telemetry data that it receives during the Continuous Integration/Continuous Deployment (CI/CD) pipeline to construct dashboards. By using JavaScript and DQL, these dashboards can help generate reports on the current DORA metrics. This method can be expanded to gain a better understanding of the SRG executions, enabling us to pinpoint the responsible guardians and the SLOs managed by various teams and identify any instances of failure. Addressing such failures can lead to improvements and further enhance the DORA metrics. Below is a sample dashboard that provides insights into DORA and SRG execution.
In the next blog post, we’ll discuss the integration of security modules into the DevOps process with the aim of achieving DevSecOps. Additionally, we’ ll explore the incorporation of Chaos Engineering during the testing stage to enhance the overall reliability of the DevSecOps cycle. We’ll ensure that these efforts don’t affect the Time to Restore Service turnaround build time and examine how we can improve the fifth key DORA metric, Reliability.
What’s next?
Curious to see how it all works? Contact us to schedule a demo and we’ll walk you through the various workflows, JavaScript tasks, and the dashboards discussed in this blog series.
Contact us to schedule a demo and we’ll walk you through the various workflows, JavaScript tasks, and the dashboards discussed in this blog series.
If you’re an existing Dynatrace Managed customer looking to upgrade to Dynatrace SaaS, see How to start your journey to Dynatrace SaaS.


Looking for answers?
Start a new discussion or ask for help in our Q&A forum.
Go to forum