
Dynatrace is proud to provide deep monitoring support for Azure Linux as a container host operating system (OS) platform for Azure Kubernetes Services (AKS) to enable customers to operate efficiently and innovate faster. This integration is a result of our collaboration with Microsoft to better serve our Azure customers across the Microsoft portfolio.
What is Azure Linux?
Azure Linux is a lightweight container host operating system (OS) that includes only the packages needed for container workloads. Microsoft initially designed the OS for internal use to develop and manage Azure services. Today, it’s a generally available container host for AKS and AKS-HCI.
The core operating system has a lightweight footprint of only a few hundred MBs when uncompressed, yet it is powerful enough to support various profiles, including x64 or Arm64-based architectures. Microsoft designed the kernel and other aspects of the OS with an emphasis on security due to its focused role in executing container workloads. This design approach helps eliminate the need to patch and maintain essential packages. Furthermore, the OS enables rapid deployment of containers as applications scale up or down in Kubernetes.
Why monitor Azure Linux container host for AKS?
Azure Kubernetes Services (AKS) is Microsoft’s managed Kubernetes (k8s) service that allows organizations to deploy and manage their containerized workloads quickly. Now, organizations can deploy Azure Linux node pools in a new cluster, add Azure Linux node pools to existing Ubuntu clusters, or even migrate Ubuntu nodes to Azure Linux nodes. However, providing observability into an AKS cluster and its node pools can be complex. Tracking the availability, health, and resource utilization of the underlying Kubernetes infrastructure is essential for several reasons.
- Resource utilization management. Ensure the cluster has enough resources to deploy new applications and deal with demand surges or node failures while avoiding impacts on the existing workload.
- Node and workload health. Visibility of the lifecycle of k8s objects (pods, services, nodes) and associated events is needed.
- Performance. Monitoring the performance of the Azure Linux OS platform is critical to ensure that containerized workloads are running efficiently and effectively. Performance monitoring can help identify bottlenecks, optimize resource usage, and prevent downtime.
- Security. Azure Linux is designed to be highly secure, but monitoring the OS is critical to ensure it remains secure. Security monitoring can help detect and prevent security breaches, identify vulnerabilities, and ensure compliance with regulatory requirements.
Jim Perrin, Principal PM, Microsoft Azure Linux at Microsoft said, “With Azure Linux, customers see benefit from the value of having a secure, performant, and fully native AKS container host. Microsoft controls the supply chain for Azure Linux end to end, resulting in a more streamlined image tailored and optimized for AKS. Azure Linux provides a consistent k8s experience throughout the developer and production lifecycle coupled with the level of support you expect from Microsoft.”
How Can Dynatrace Monitor Azure Linux container host for AKS?
Dynatrace offers continuous automation and comprehensive observability for the entire stack in Kubernetes without requiring any modifications to code, container images, or deployments, setting it apart as the sole monitoring solution of its kind. Deploying through the Dynatrace Operator in Kubernetes environments enables application teams to confirm that their applications deliver the anticipated value and performance while giving them an understanding of their application’s behavior.
With insights into Azure Linux OS-based Kubernetes node pools, Dynatrace can quickly assess the following.
- Cluster resource utilization to ensure business continuity while controlling costs.
- Pod and workload overview to quickly identify unexpected differences in application and microservice instances.
- All native Kubernetes events to diagnose common platform problems such as crash loops, failed image pulls, and out-of-memory containers.
- Instantly visualize the Kubernetes environment with all the detailed metrics and events teams care about.
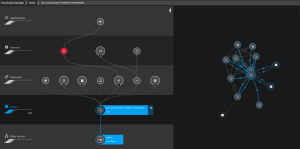
An example dashboard for Kubernetes workload might look like the following.

Indeed, Dynatrace continuously maps the interdependencies between these entities. At the same time, Dynatrace AI engine, Davis® saves additional time and resources by automatically identifying and prioritizing alerts from Kubernetes applications and infrastructure.
AI-powered observability for clusters, pods, and microservices
With Davis, the Dynatrace AI engine prioritizes anomalies in these environments in real time, detailing the root cause of issues impacting end users. This saves infrastructure and application teams time and resources and empowers them to act collaboratively. Dynatrace’s radically different AI determines the following.
- The functional root cause of a performance or availability problem, including code-level visibility.
- The foundational root cause is the deployment or configuration change responsible.
- The impact on real users and business KPIs.
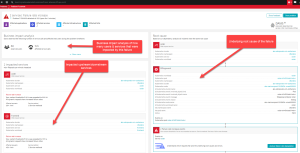
Here’s an example of a Problem card that Davis opened because of an increased failure rate in the workload called order service. Not only did it identify the business impact of this failure, but it also identified any upstream or downstream services, which in this case was an upstream service called front end.
Intuitive view on Kubernetes node utilization
Quickly identify node pools with unexpected resource utilization or excessive pod-level resource limits. Identify pending and failed pods in workloads and filter by namespace and workload type.
- Launch an analysis from a natural starting point with the node pools in mind.
- Identify and diagnose nodes that are being CPU or memory challenged.
- Quickly locate all nodes in the Kubernetes cluster.
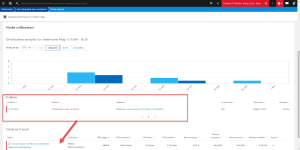
Here’s an example of a node in the AKS cluster that Davis identified as having a Memory Pressure condition on one of the nodes, indicating that it is running low on memory.
Modern cloud done right.
With Dynatrace support for Azure Linux container host for AKS, organizations can achieve greater visibility into their containerized workloads and ensure their digital ecosystems’ optimal performance and security.
Dynatrace also has many other Azure services, such as Virtual Machines, Functions, App Services, Spring Cloud, Service Fabric, and Virtual Machine Scale Sets.
To learn more about Azure Linux container host for AKS read Microsoft’s blog.
Visit the Dynatrace Software Intelligence Hub to learn about over 100 Azure services we support.


Looking for answers?
Start a new discussion or ask for help in our Q&A forum.
Go to forum