Seeing poor Performance and/or Structure Scores on your GTmetrix Report? We’ll tell you if you need to consult your hosting provider or developer.
Overview
GTmetrix is primarily used to assess front-end issues though it can detect potential back-end issues as well.
In this article, we discuss whether bad Performance and/or Structure Scores could be related to your site’s front-end code or your hosting service.
Note that there is a myriad of reasons that can cause bad Performance/Structure Scores – it’s often the case that both front-end and back-end issues are responsible.
Why Should I be Concerned About Bad Performance/Structure Scores?
Performance and Structure scores, while related, reflect certain aspects about your page’s performance.
Performance Score
Your Performance Score essentially represents your visitors’ experience in key user-centric metrics (e.g., Web Vitals) while loading your page.
The lower your Performance Score, the worse your page performance from your visitors’ perspective.
Factors like location, network connection speeds, and more (ads, cookies, etc.) may also impact the loading of your page, which in turn impacts your Performance Score.
Structure Score
On the other hand, a bad Structure Score tells you that your page is likely not built with front-end best practices in place.
There are numerous strategies and methods to implement a website to ensure optimal loading time, and with a poor Structure score – your website likely does not have them in place.
Structure Scores don’t directly impact Performance Scores
How well you do in your Structure score doesn’t necessarily correlate to your Performance score.
However, improving your Structure score can serve as a good starting point to improve page load times overall (which can potentially impact your Performance score).
Overall, achieving better GTmetrix results can not only enhance your visitors’ experience on your page, but also likely lead to more conversions and potentially improved SEO rankings as well.
That means improving your GTmetrix scores has tangible benefits to your website/business/operations.
What Causes Bad Performance/Structure Scores?
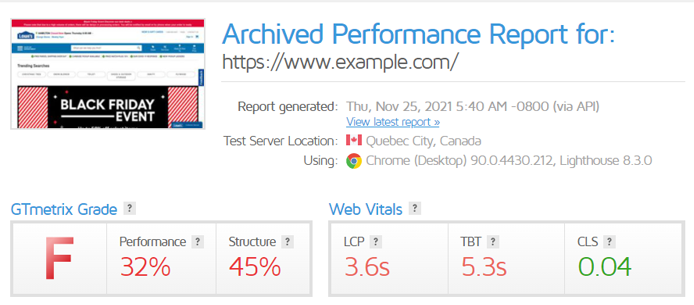
Your GTmetrix Report can give you great insight as to why your Performance/Structure Scores are poor.
Reasons for Bad Performance Scores:
- Not meeting thresholds for any of the 6 Performance metrics:
- Many of these metrics are directly correlated with CSS/JavaScript execution.
- For example, TTI and TBT measure how long the browser’s main thread was occupied processing a task.
- For example, TTI and TBT measure how long the browser’s main thread was occupied processing a task.
- A poor Performance score indicates the browser could not load your page in a performant manner.
- Depending on which metrics were poor, it could indicate a slow-loading, non-interactive, and/or visually unstable website.
Reasons for Bad Structure Scores:
- Not meeting requirements for various Lighthouse Audits:
- These audits are mostly related to how your page was built/configured (i.e., front-end related).
- A poor Structure Score indicates your page was not set up following web performance best practices.
We elaborate on the major potential causes of poor Performance/Structure Scores below:
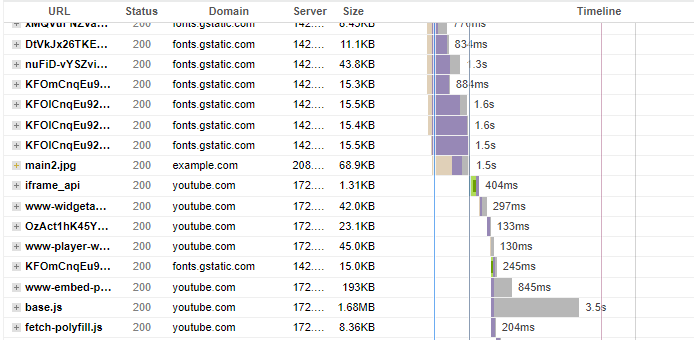
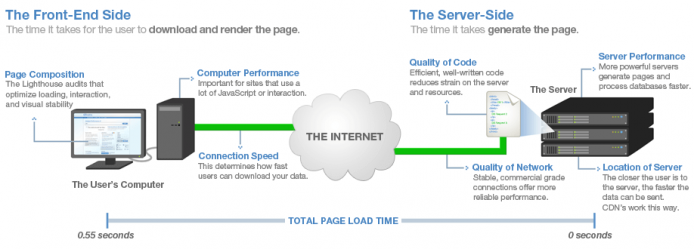
1) Slow Server Response
We’ve covered this previously – a slow server response often results in a slow Time to First Byte (TTFB).
A slow TTFB then proceeds to delay your page’s key metrics like FCP, LCP, SI, and TTI.
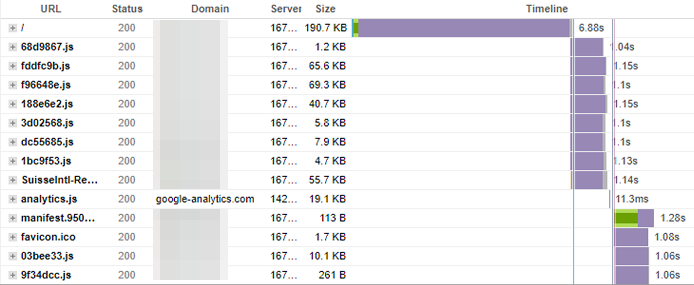
A slow server response usually means your server is underpowered and struggling to generate your page content. We commonly see this with complex WordPress sites.
It’s also possible (though less common) that your slow server response is due to bad/inefficient back-end code. Regardless of the cause, if you see a long purple bar on the Waterfall Chart for the initial HTML request, you should investigate it.
Content Delivery Network (CDN) Issues
Note that a long purple bar on the initial HTML request (and a slow TTFB in general) could also be caused by CDN Cache Misses/Revalidations. More on this below.
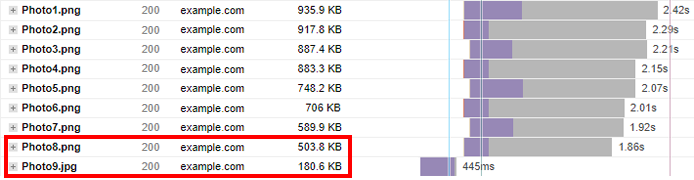
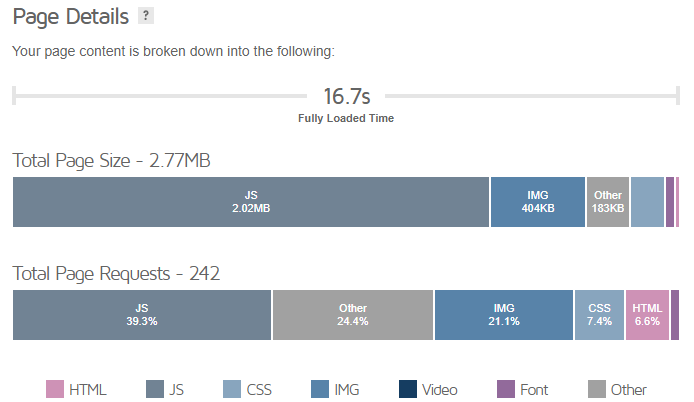
2) Unoptimized Images/Too Much Media
Images are often the single largest resource type on your website, so optimizing them is essential for a good user experience.
We frequently see pages where more than 70% of the Total Page Size is made up of only images.
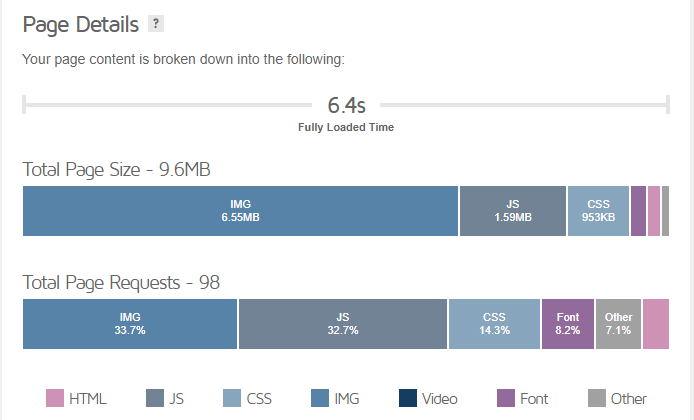
If your images aren’t properly sized or efficiently encoded, you may be serving larger files to your visitors than necessary, extending key metrics like FCP, LCP, and TTI.
Unoptimized images not only worsen your Performance/Structure Scores but also increase data costs for your visitors.
Other image-related blunders may include not serving images in an appropriate format, or not lazy loading below-the-fold images.
Similarly, large videos can also worsen Performance/Structure Scores and slow down your page load, as seen in our previous Black Friday Performance Monitoring Event.
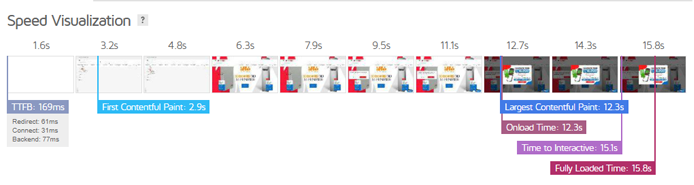
3) Too Much CSS/JavaScript
CSS and JavaScript are render-blocking resources – they will delay the browser from starting the rendering process, extending your page’s First Paint.
Delaying the First Paint also means delaying FCP, LCP, SI, and TTI – nearly all the metrics that determine your page’s Performance Score. This generally results in a very slow rendering of page content as experienced by your visitors.
While modern browsers have gotten better at handling CSS, excessive JavaScript usage continues to plague many websites.
We frequently see WordPress (and other CMS) pages using plugins and extensions to add features and website functionality. These plugins usually add extra scripts that must be parsed and executed by the browser when loading your page.
According to Tom Dale (Principal Staff Software Engineer, LinkedIn):
“Byte-for-byte, JavaScript is more expensive for the browser to process than an equivalently sized image or Web Font.“
If your page uses many such plugins, it is likely to delay LCP and TBT, two metrics that account for more than half of your Performance Score.
4) Ads/Third-Party Content
Third-party content is often another reason for poor Performance/Structure Scores as these files are not on your server and therefore out of your control. While we understand that you’re including them for a reason, you should also consider how they impact your webpage’s performance.
For example, third-party fonts and YouTube embeds can take longer to load, and they can block rendering of your page while they are being processed by the browser.
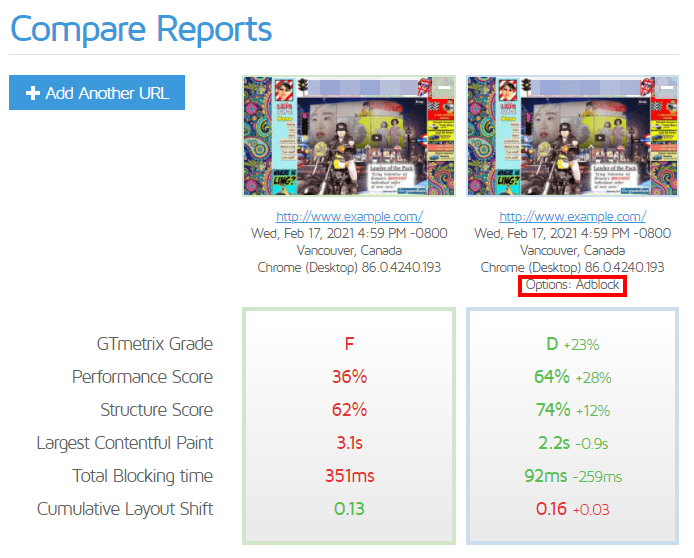
Ads are especially ubiquitous these days and many webpages utilize them as their primary source of revenue generation.
However, they can also impact the user experience by way of affecting the loading speed, interactivity, and visual stability of your page (i.e., all the Web Vitals).
Moreover, if your page has too many ads, it may incur an added SEO penalty if the ads are too intrusive or drastically affect user experience. Test your page with our Adblock Plus feature and see how ads impact your page experience.
While there’s nothing you can do to control how these third-party assets load, we’ve always recommended auditing your website’s third-party content usage and only keeping the ones that add value to your website/business/operations.
You should also consider deferring third-party scripts essential to your website operations, wherever possible.
5) CDN Issues
If you’re using a CDN, then you may be seeing lower Performance Scores due to Cache Misses or Revalidations.
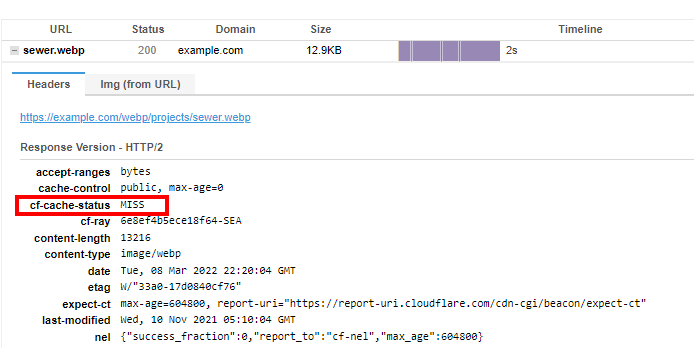
In addition to a MISS or REVALIDATION, you may also see EXPIRED or DYNAMIC.
While all of these terms have different meanings, they all have the same result – the request goes to your origin server, increasing the time taken to fetch that asset.
If you have multiple such Cache Misses, it could end up slowing down your page drastically.
6) Lack of Caching
Caching refers to “storing” your page and its assets so that your server doesn’t have to generate them every time someone visits your page. Caching reduces the load on your server, and speeds up the delivery of your page.
Conversely, lack of caching can result in a slow loading page with poor Performance/Structure Scores, especially if your server is slow to respond.
There are several solutions available for caching:
a) CDN Level Caching
CDNs store cached versions of your page and its resources in Edge servers around the world. This ensures speedy delivery for global visitors, as the Edge servers nearest the visitor’s location serve your content, reducing latency.
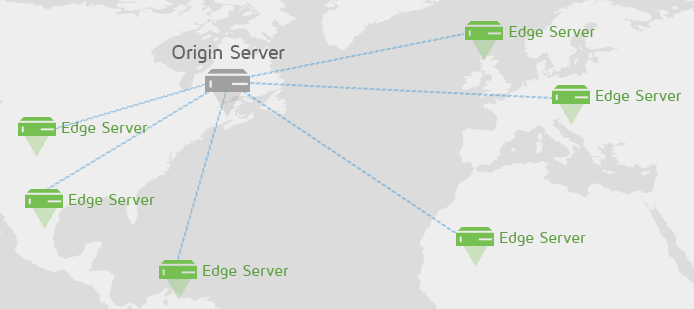
CDNs are an appropriate solution for most websites looking for speed improvements; however, not every site necessarily needs one.
b) Application Level Caching
Also known as Page Caching, this refers to adding caching functionality to your page using WordPress plugins or other caching services.
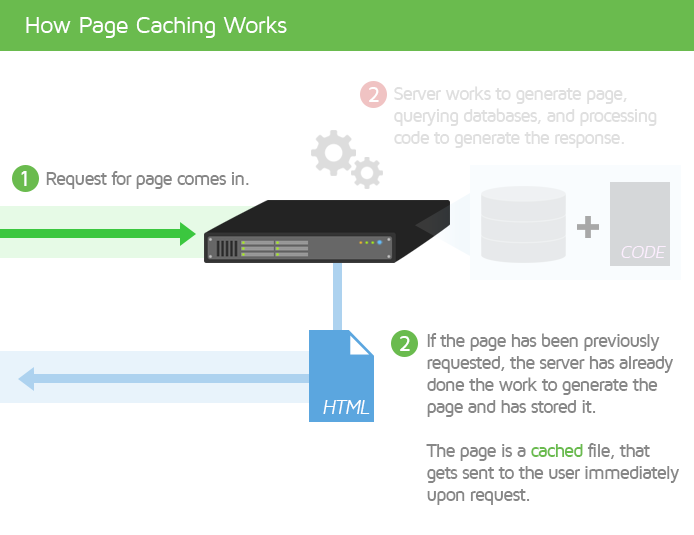
Page caching allows pages to be stored, reducing your server’s workload as it doesn’t need to dynamically generate a page every time a user wants to load it.
c) Server Level Caching
Similar to page caching, you can enable caching functionality at the server-level (e.g., via Varnish or Nginx). More on this here.
d) Browser Level Caching
This only affects your Structure Scores as GTmetrix doesn’t employ browser caching when testing your page. Browser caching is similar to the aforementioned caching solutions, except your page assets are stored at the browser level.
While first time visitors to your page won’t experience anything different, repeat visits will be faster as the browser delivers “cached content” that is already stored in the browser cache.
Once again, this has no effect on your Performance Scores as the GTmetrix browser doesn’t cache any content on our side.
Should I Contact My Hosting Provider or Developer?
There is no straightforward answer here as it depends on what is responsible for your poor Performance/Structure Scores.
We’ve outlined 6 major reasons above explaining why you could be seeing low Performance/Structure Scores on your GTmetrix Report.
Contact your Hosting Provider if…
You have a long TTFB
If a long TTFB due to a slow server response is the reason for your poor Performance/Structure Scores, it’s quite often the case that underperforming servers/lack of server resources are the cause.
However, also note that poor/inefficient backend code could also be responsible for this, in which case you may need developer assistance. We’ve written a guide that explains this in detail.
You see CDN Issues
If your poor results are caused by CDN issues, then contact your CDN provider (in some cases, this turns out to be the same as your hosting provider).
Contact your Developer if…
You have unoptimized images/videos
If your poor GTmetrix Results are caused by having too many unoptimized images (or videos), you’ll need to contact your developer as this is a purely front-end structure issue.
You can refer to our existing resources on image optimization:
- What Does Image Optimization Mean?
- How to Optimize Images: A Practical Guide
- How to properly size images
- Are You Using the Right Image Format?
- How to upload SVGs to WordPress
You have unoptimized CSS/JavaScript
When CSS and/or JavaScript is responsible for your poor GTmetrix scores, you’ll need to seek developer assistance as this is again a front-end issue.
While trimming your website’s CSS/JavaScript code will naturally help improve performance, you should take care to ensure essential code isn’t stripped away.
According to the HTTP Archive:
36.2% of JavaScript bytes on the median mobile page go unused.
Reducing unused CSS/JavaScript should therefore be a priority to ensure that the browser isn’t processing potentially expensive code that is not even needed on the page.
You need caching configured
Finally, if want to set up caching, you can do so on your own (for WordPress users) or contact your developer to have it set up for you.
Keep in mind that your poor GTmetrix results could also be due to a combination of the above reasons. In this case, we recommend tending to the most critical issues first and then dealing with the rest based on feasibility.
Third-party scripts are problematic
If your poor scores are caused by third-party content, you should contact your developer only after you’ve audited your site’s third-party content, determined which requests are impacting your performance negatively, and removed the ones that don’t add value to your business.
A developer can then potentially assist with further optimization opportunities for your required third-party requests.
TL;DR
- Contact your hosting provider for TTFB and CDN issues (only if your hosting provider is the same as your CDN provider)
- Contact your developer for all other front-end issues seen in the Structure tab.
We recommend working on the critical issues first (long TTFB, Top Issues on Summary Tab) and dealing with the rest after.
Summary
Bad Performance/Structure Scores can be caused by a myriad of performance issues on your page, both back-end and front-end.
No matter what the cause, they likely indicate that your visitors aren’t enjoying a good experience on your page. We’ve outlined all the major causes of poor Performance/Structure Scores and whom to likely contact if you see them on your page.
Use this guide to aid your optimization efforts and remember to deal with the issues in order of how critical they are.
Test with different countries, speeds and options
Get access to more Test Locations, Analysis Options and Connection Speeds!
Sign up for a Basic GTmetrix account and see how your site performs in more scenarios – It’s FREE!
Get Mobile Testing, Premium Locations, and more
Get more On-Demand Tests, Monitored Slots and Premium Test Locations along with Hourly testing with a GTmetrix PRO plan.
Upgrade to GTmetrix PRO and see how your site performs in all scenarios.
Need More Help?
We recommend finding help using one of our optimization partners. They’re a great option for website owners that want to improve performance, but don’t have the technical skill to implement optimizations.
We only recommend products and services that we’ve reviewed and tested ourselves. If you decide to purchase their services through the links provided, we may be paid a commission at no extra cost to you.
Got a WordPress site?
![]()
Optimize WP performance with just a few clicks using WP Rocket.
Get page caching, JS and CSS script optimizations, database cleanup and more!
Hire a WordPress Developer

Check out WP Speed Guru – a WordPress optimization specialist who can help you improve performance of premium themes, WooCommerce implementations and all things WordPress.
Optimize your WordPress performance today
Hire a Developer
![]()
We recommend finding help on Fiverr. This is a great option for website owners that want to improve performance, but don’t have the technical skill to implement optimizations.
Visit Fiverr, register for an account, and search for a speed optimization service that matches your platform, whether it’s WordPress, Magento, Shopify, Squarespace, Opencart, etc.