
Log forensics—investigating security incidents based on log data—has become more challenging as organizations adopt cloud-native technologies. Organizations are increasingly turning to these cloud environments to stay competitive, remain agile, and grow.
But as organizations rely more on cloud environments, data and complexity have proliferated. Teams struggle to maintain control of and gain visibility into all the applications, microservices and data dependencies these environments generate. Without visibility, application performance and security are easily compromised.
As a result, teams are turning to technologies such as observability to understand events in their cloud environments. Moreover, they have come to recognize that they need to understand data in context. But most observability technologies today provide information in silos. Without unifying these silos, teams miss critical context that can lead to blind spots or application problems—problems that compound when there’s a need to investigate security events.
Modern observability enables log forensics
Dynatrace is a software intelligence platform that provides deep visibility into and understanding of applications and infrastructure. It started as an observability platform; over time, it has expanded to provide real user monitoring, business analytics, and security insights. The recent innovation around log storage, processing, and analysis—Grail—makes Dynatrace a great solution for security use cases such as threat hunting and investigating the who-what-when-where-why-how of an incident.
Grail is a data lakehouse that retains data context without requiring upfront categorization of that data. Unifying data in Grail brings critical security capabilities to bear as teams seek to understand malicious events.
Grail enables organizations to find and analyze security events in the context of their broader cloud environments. Moreover, with capabilities such as log forensics—the analysis of log data to identify when a security-related event occurred—organizations can explore historical application data in its full context.
Grail makes it easy to query historical data without data rehydration or indexing, re-indexing, and up-front schema management. This accessibility gives users quick and precise results about when malicious activity occurred, when reconnaissance was first seen in the systems, what was attempted, and if the attackers were successful.
Demo: “Ludo Clinic” uses log forensics to discover and investigate attacks using Grail
Imagine working as a security analyst for a respectable medical institution called Ludo Clinic. As Ludo Clinic started using Dynatrace, the platform’s Runtime Application Protection feature detected a SQL-injection (SQLI) attack. Thanks to the details provided by the code-level vulnerability functionality, the developers knew where in the code the exploited vulnerability was and were able to address and patch it quickly.
The task now is to investigate whether the system experienced any suspicious activity before the attack so we can determine if any other systems are affected. The good news is there are metrics available a few days before your team detected the attack, and you also ingested three months of application and access logs into Grail. Because these logs are ready for querying with no rehydration, the investigation can start immediately. The bad news is we don’t know exactly what to look for. “Find suspicious activity” can mean anything. So, we’ll start by exploring the data using the hints and context information we already detected with Dynatrace.
Hint one: Blocked SQL injection report details
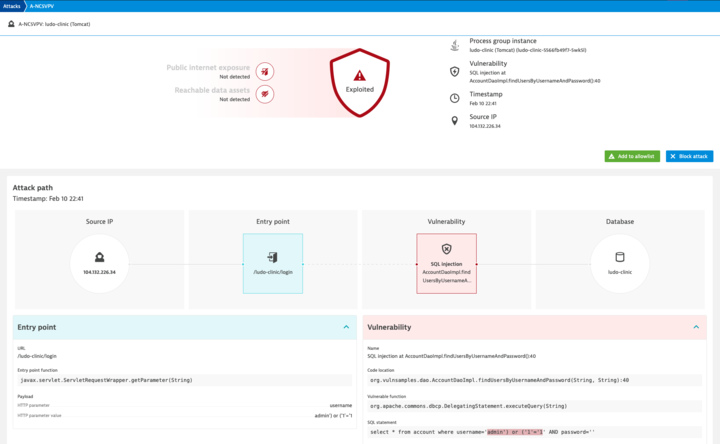
Here’s the report from Dynatrace on the blocked SQL injection details on 10 February from the IP 104.132.226.34. This report shows details of the attack, such as the entry point, the vulnerability that was exploited, the IP address of the attacker, and so on.
Hint two: Failed logins spike
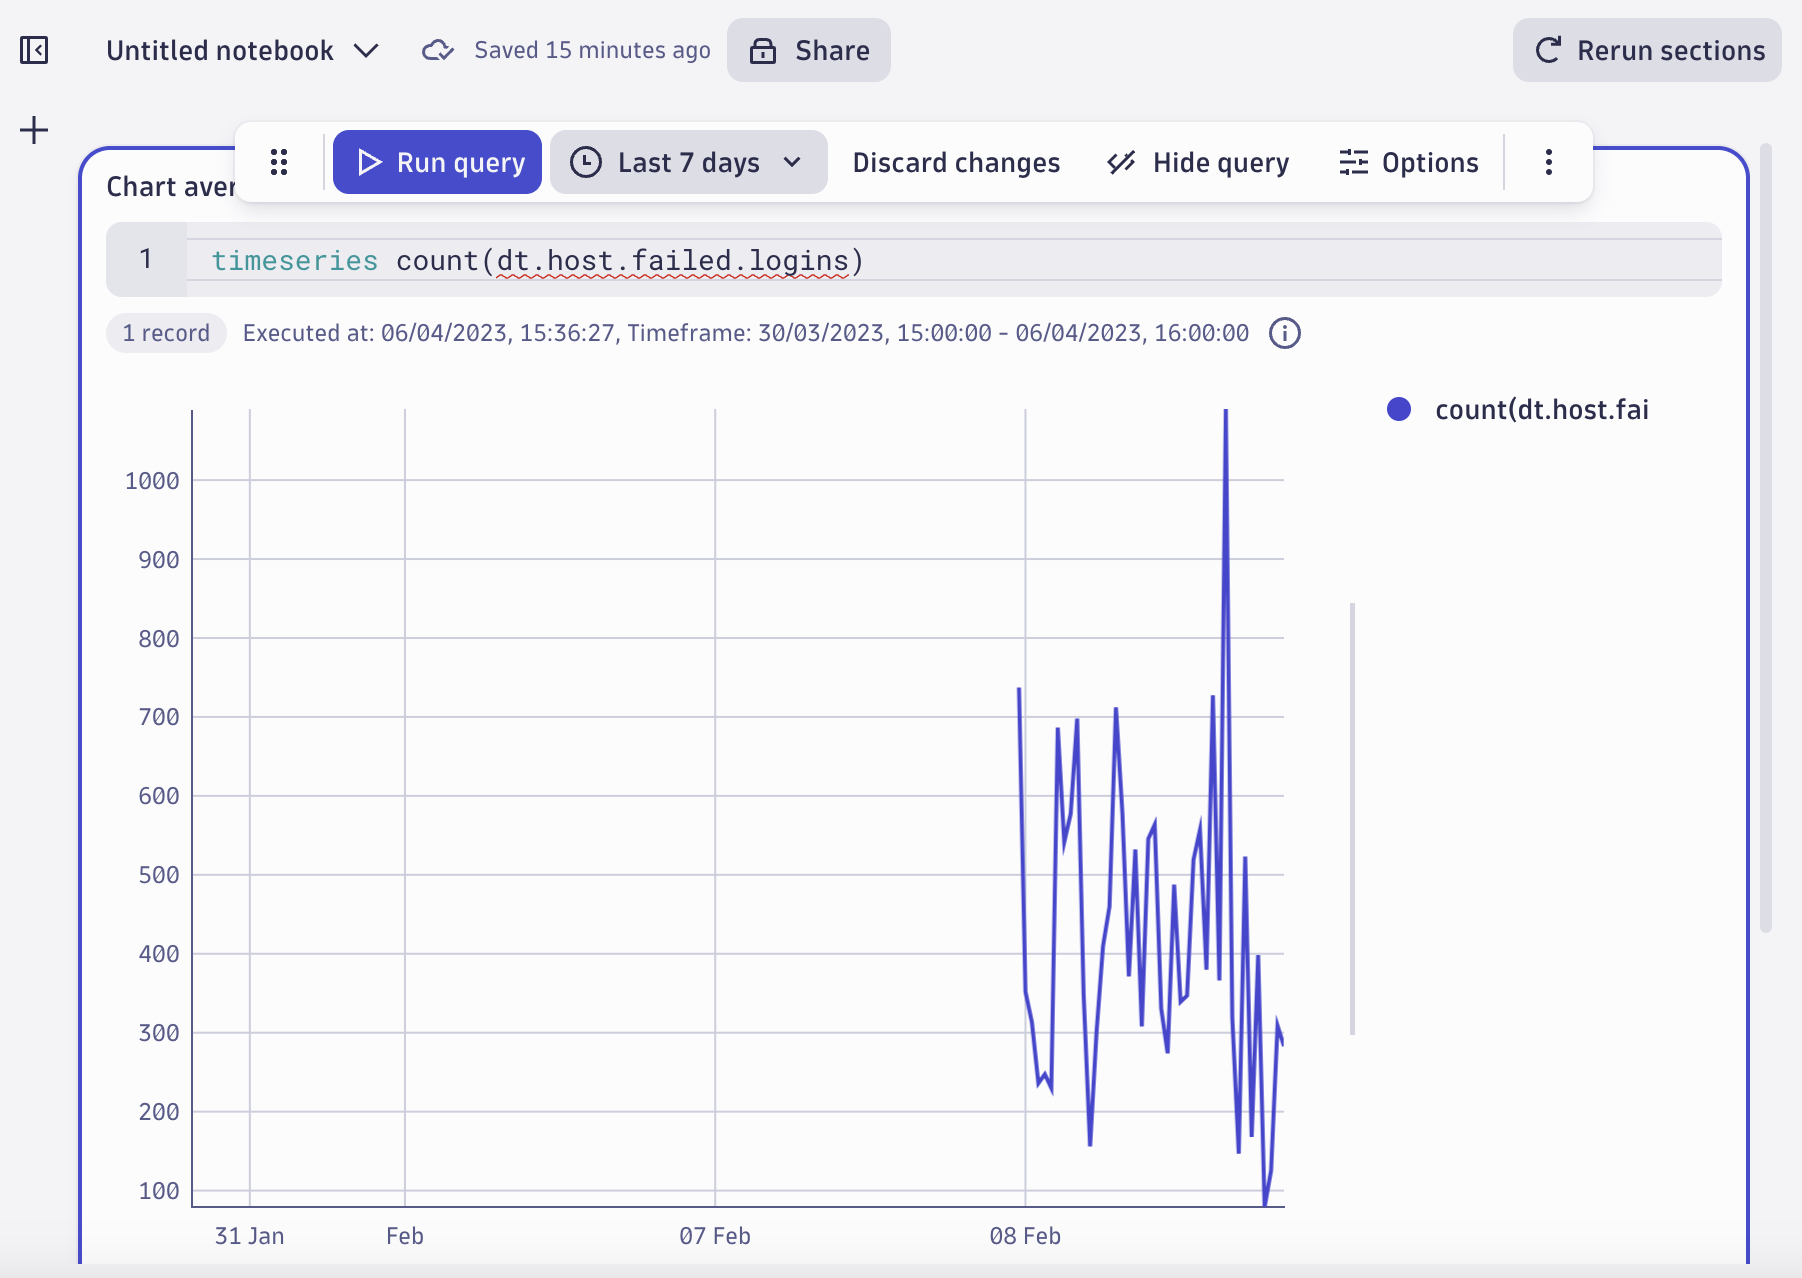
A quick look at the metrics dashboard dating back to 8 February shows a spike in failed logins metrics before your team detected the attack. Indeed, there’s a spike on 8 February.
It would make sense to see if there’s any activity from that IP before we set up monitoring. Has the attacker been doing reconnaissance from that same IP in our systems even before this? If yes, how? Did they try something else during those three months? Were they successful?
Notebooks, DQL, and DPL: Tools of the Grail log forensics trade
Now that we have some clues about where to look for suspicious activity, we’ll dig into the logs using Notebooks, DQL, and DPL.
Dynatrace Notebooks
Dynatrace Notebooks is a collaborative data exploration feature that operates on data stored in Grail for ad-hoc exploratory analytics. Notebooks enable cross-functional teams, such as IT, development, security, and business analysts, to build, evaluate, and share insights for exploratory analytics using code, text, and rich media. The ability to build insights from the same data using the expertise of different roles helps organizations truly understand everything their data has to say.
Dynatrace Query Language (DQL)
Dynatrace Query Language (DQL) is a piped SQL-like query language, similar to Linux commands executed in sequence. You can look at the queries like a series of building blocks applied in an order you happen to need at this moment. Select fields, summarize, and count a value, apply more filters, select additional fields, extract data from a particular field, and so on. DQL is great for exploring and experimenting with data, which makes it a great ally in log forensics and security analytics.
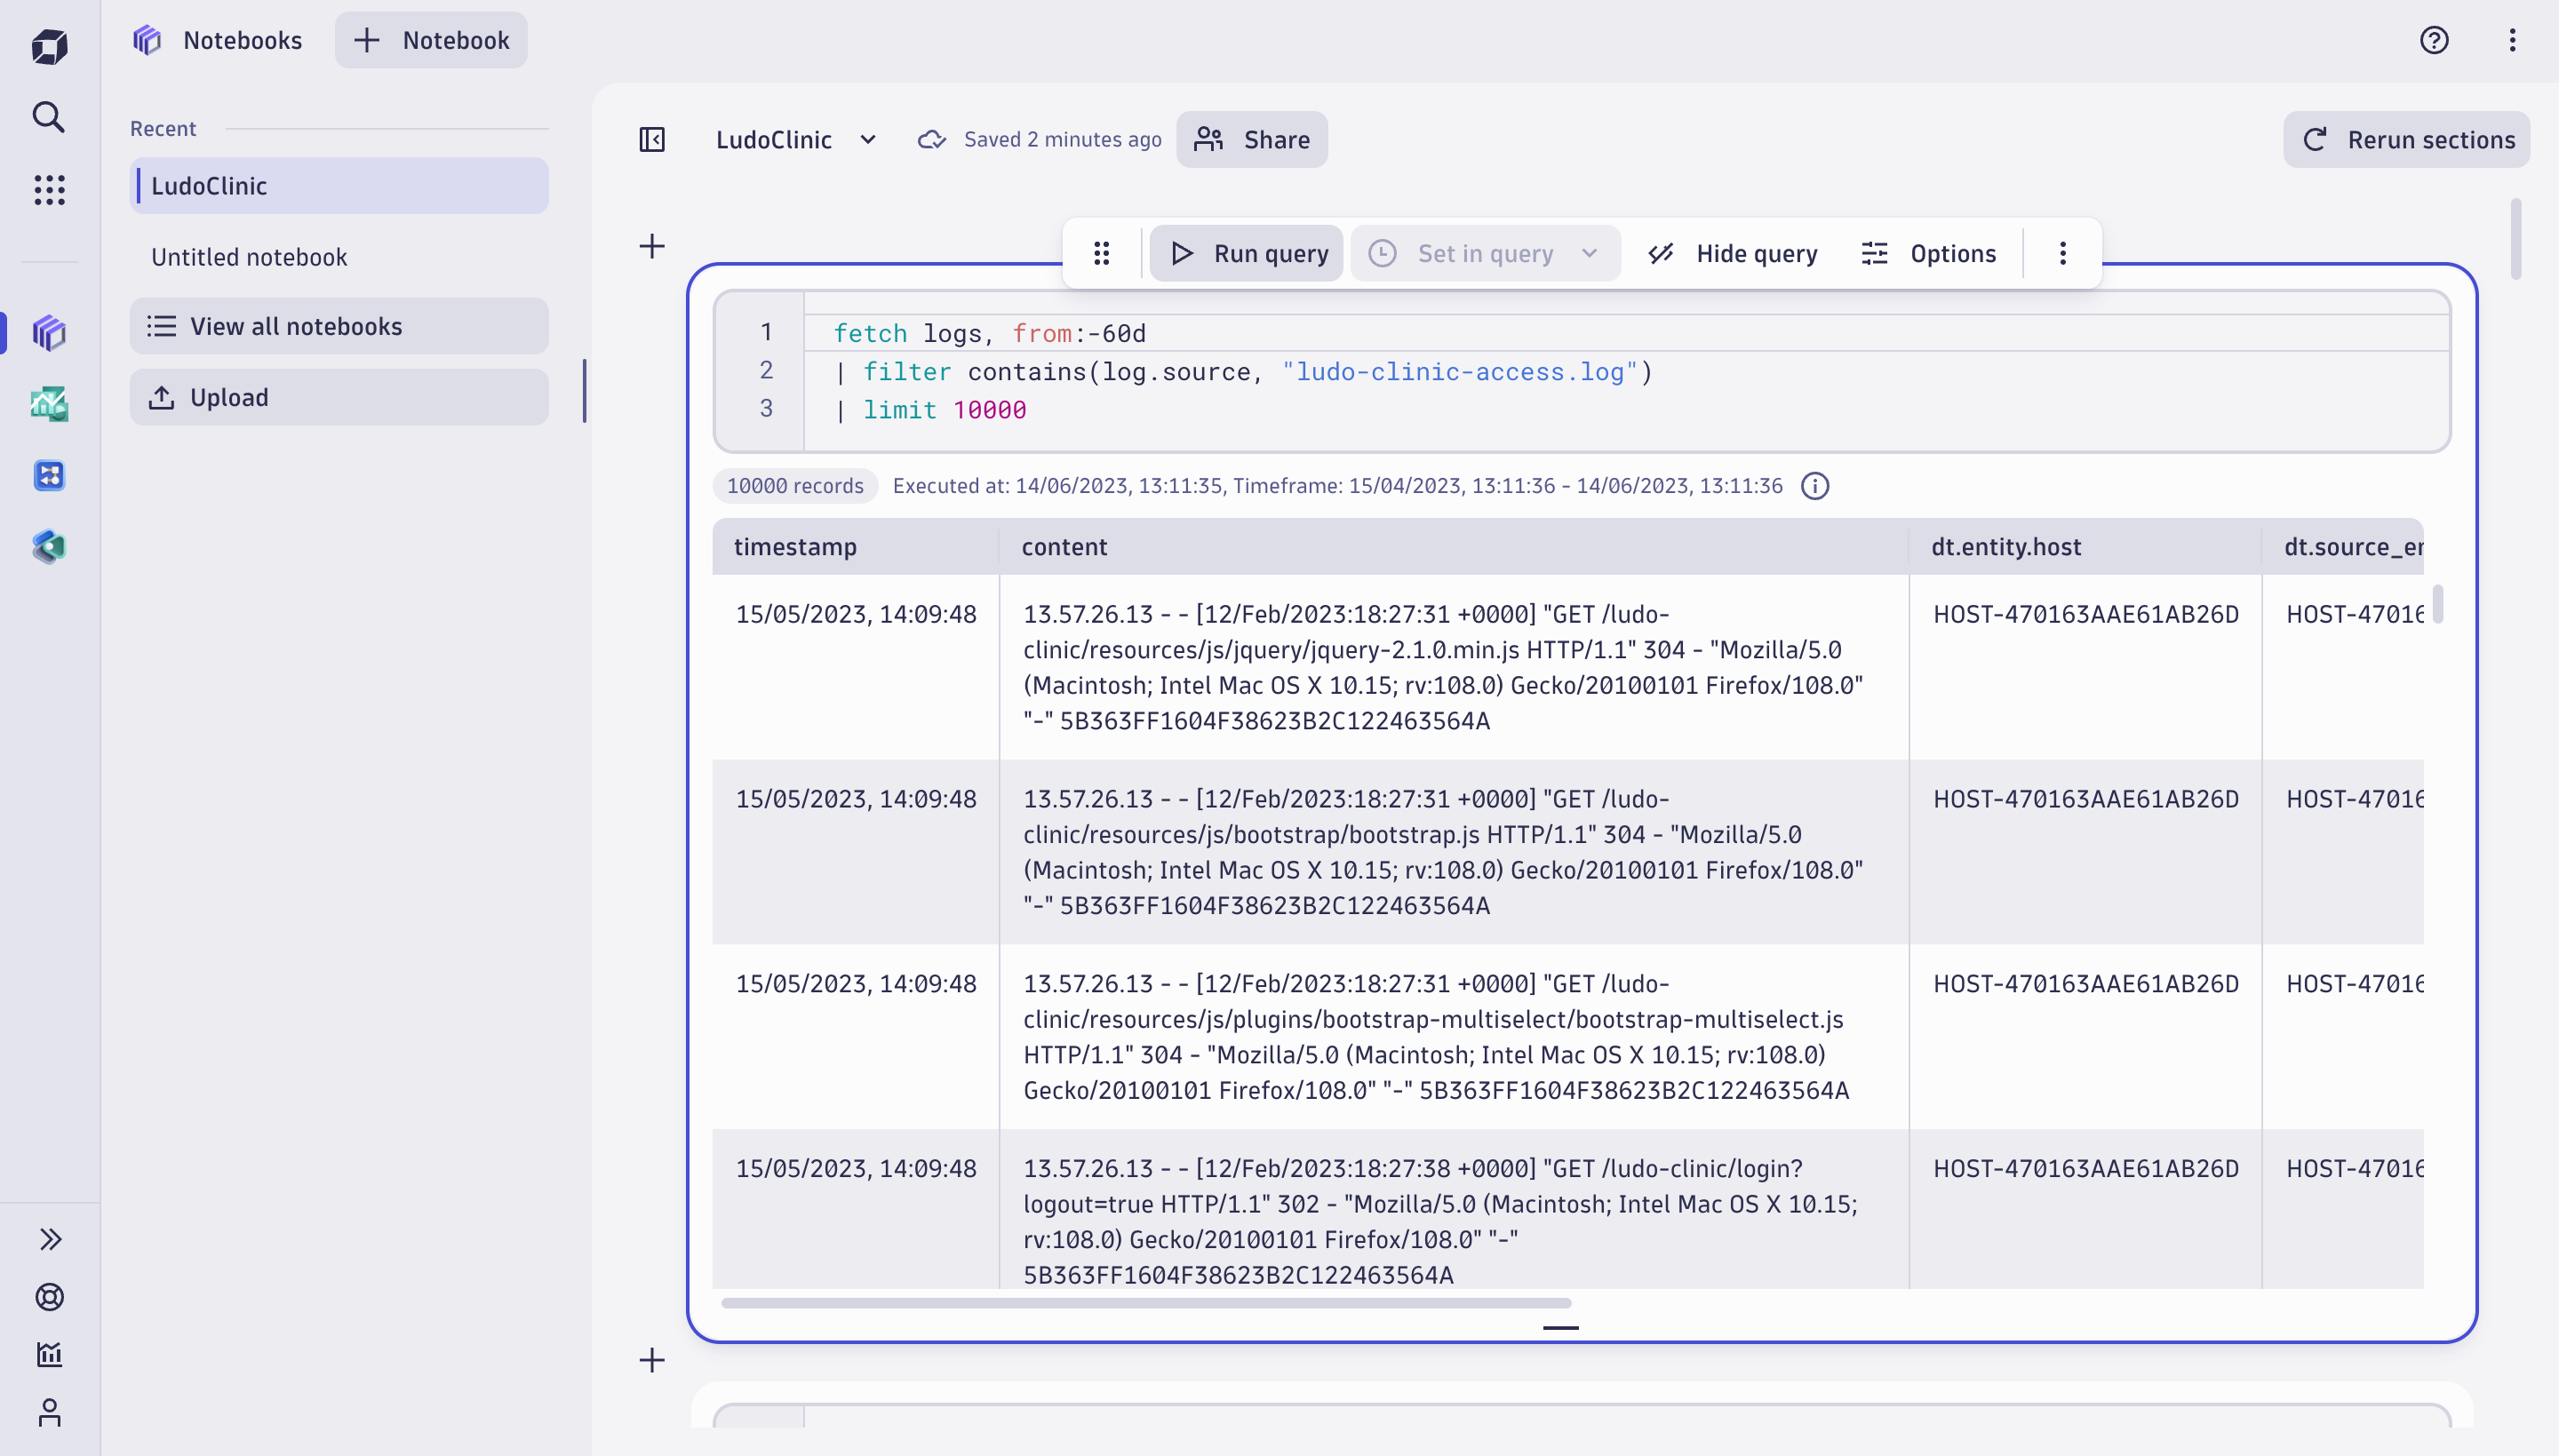
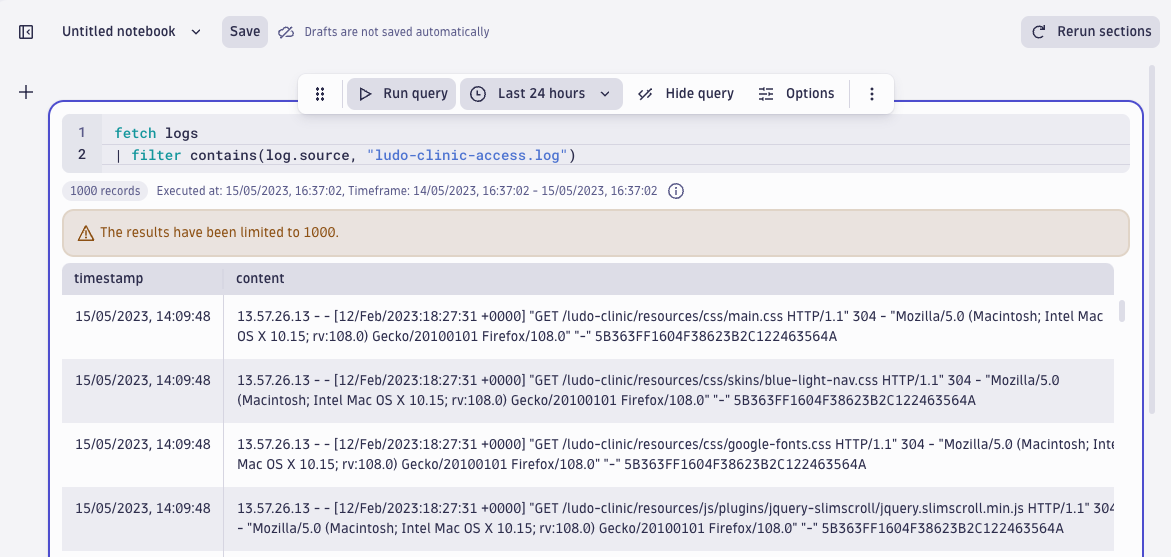
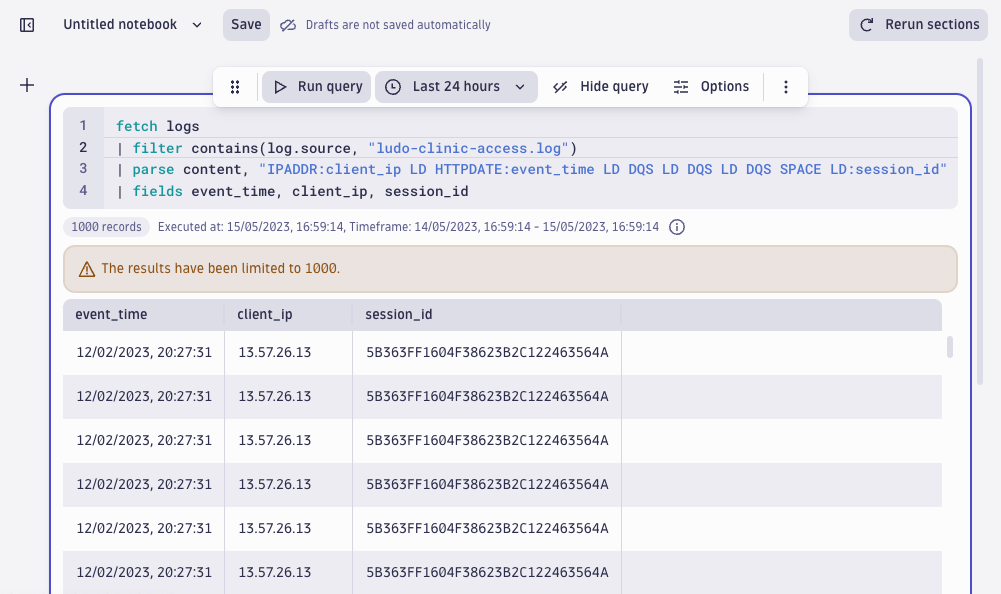
The first query of our investigation uses DQL in Notebooks to fetch logs from Grail, filter the access log, and limit the result to 1000 records for initial exploration.
Dynatrace Pattern Language (DPL)
In our investigation, we’ll also use DPL. DPL stands for Dynatrace Pattern Language, a parsing language that also consists of intuitive building blocks that help to extract meaningful fields from data on read. That means there is no need to manage indexes and rehydrate archived data; simply specify an ad hoc schema using DPL as part of the query.
What’s more, with DPL, the parsed results return typed fields, so you can be sure that a timestamp is a timestamp and an IP address is an IP address, not some random octets separated by a dot like 320.255.255.586. Working with typed data means excellent quality and precision for investigation results because you can run type-specific queries like calendar operations, calculations on numeric data, working with JSON objects, and so on. Working with typed data means excellent quality and precision for investigation results, as you can run type-specific queries like calendar operations, calculations on numeric data, working with JSON objects, and so on.
Log forensics: Querying the access log
Remember: our task is to investigate whether any other systems are affected. The first step is to query whether the IP address where the SQLI attack came from has been used before. Can we see it in the web application access log months prior to the attack?
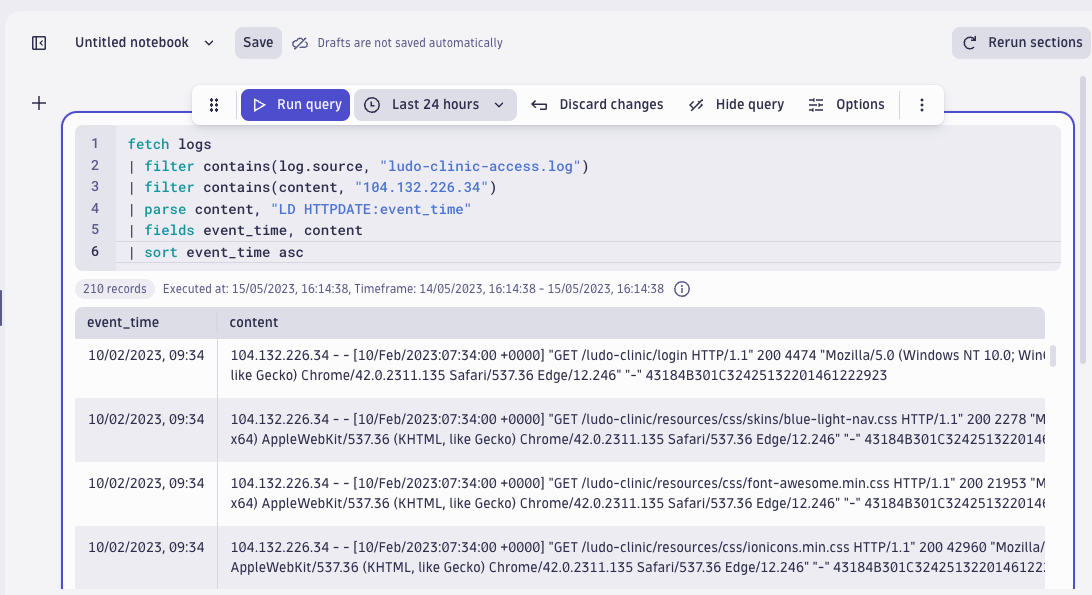
The query result shows there is no activity from that IP earlier than records on 10 February, the day Dynatrace detected the SQL injection attack. This means that the attack appeared “out of the blue,” and it is likely the attackers were using other IP addresses to do reconnaissance on our systems.
Because we can’t find the attacker by the IP address, let’s look at abnormalities in login behavior because there is a chance they’ll be related to reconnaissance. This means we’ll investigate the spike in failed logins we saw earlier in the metrics graph. Are there any other failed login spikes three months prior to the attack? Where do the failed logins originate from?
We can see that a failed login attempt takes users to a specific URL:
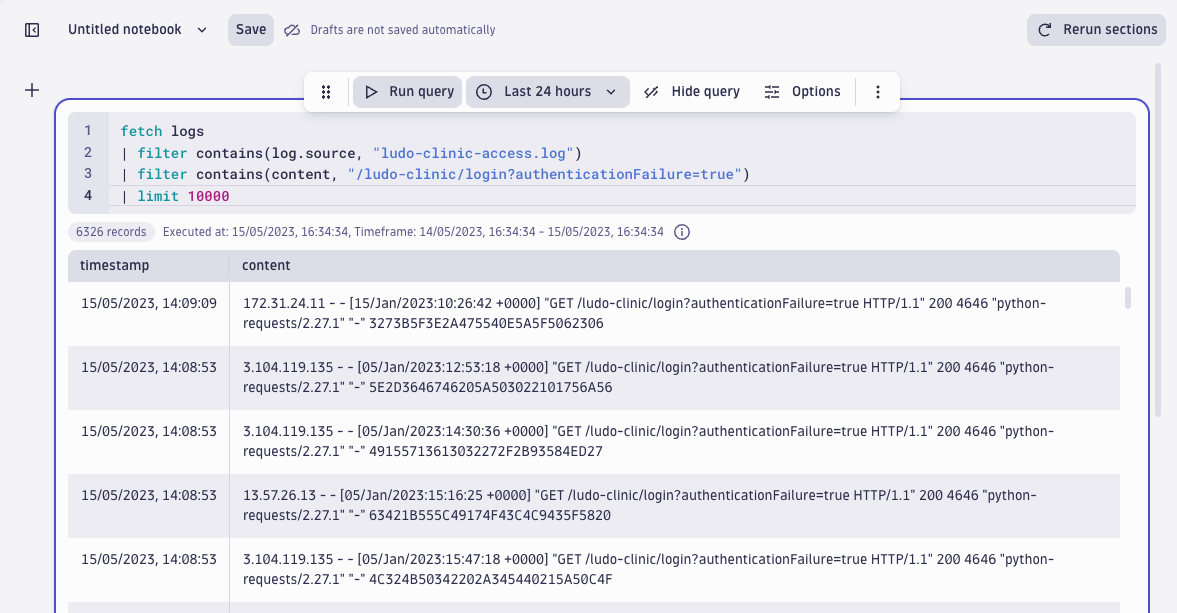
/ludo-clinic/login?authenticationFailure=trueSo, let’s see if and how often this URL appears in the logs by adding the following filter to the query.
| filter contains(content, "/ludo-clinic/login?authenticationFailure=true")
| limit 10000
Indeed, the query gives us 6531 records containing a failed login URL:
Making sense of the access log
For the next stage of our investigation, let’s make more sense of these ~6,300 records and find out how many unique IP addresses were the origin of failed login attempts. The hypothesis is: some of the IP addresses stand out when it comes to the number of login failures. This means we first need to extract the IP address to run this aggregation.
We can utilize the schema-on-read functionality, that is, extract only the fields we need for a specific query. Taking a closer look at the content field of the access log, we can see a traditional HTTP access log: clientIP, timestamp, requestURL, HTTP response code, and so on.
Notice that the timestamp field (the ingest timestamp) is similar for all log records (15/05/2023 14:09:48). This is because Ludo ingested the historical log records in bulk. To analyze the event time, we need to extract the timestamp from the content field as event time. To count IP addresses, we also need the IP address.
Quick ad-hoc parsing to aggregate login failures
To parse out data (timestamp and IP) from the content field, we’ll select the content field and select Extract fields to open the DPL Architect. To retrieve the timestamp and clientIP, we’ll replace the default DPL pattern with the following:
IPADDR:client_ip LD HTTPDATE:event_time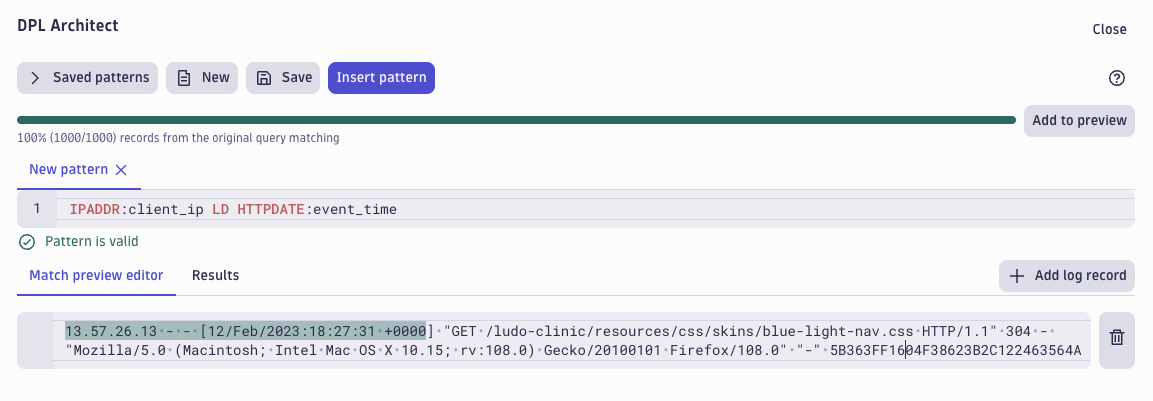
This matches and extracts the timestamp and the IP address from the content field and gives them a name (event_data and client_ip) and leaves the rest of the pattern unmatched, as we don’t need it for the following query. Clicking Insert pattern brings us back to the query view, adding a parse command to the newly created pattern.
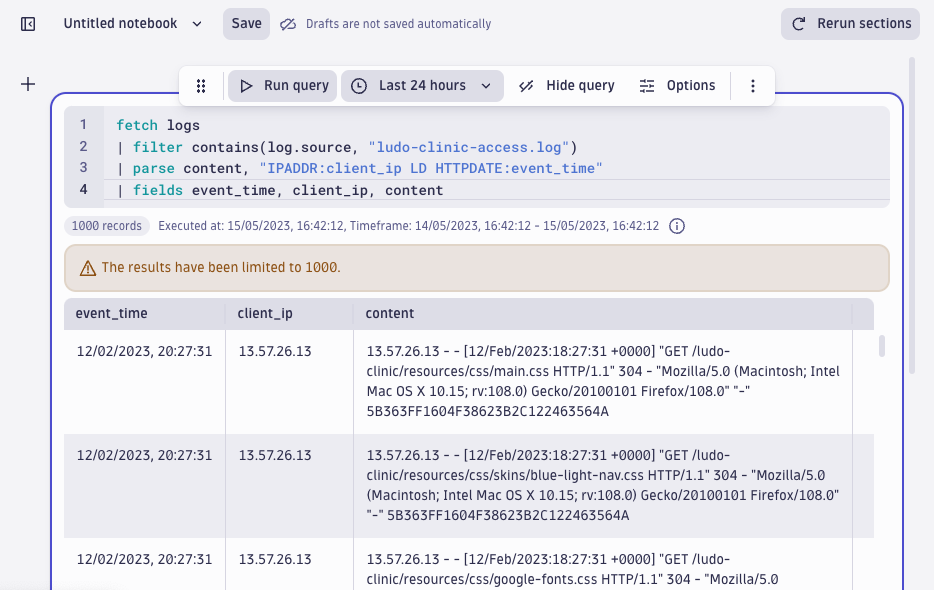
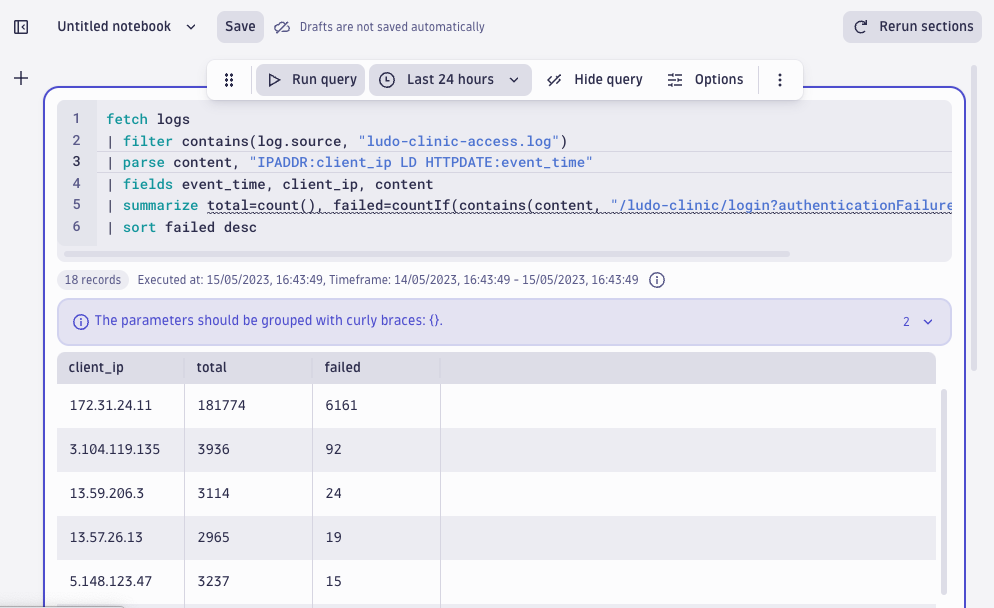
Now with the extracted IP address, we can proceed with queries and use the summarize command to count the number of failed logins per unique IP address to see if there were any failed logins originating from a specific IP. Sorting the result set based on the number of failed logins in descending order gives us the largest outliers.
fetch logs
| filter contains(log.source, "ludo-clinic-access.log")
| parse content, "IPADDR:client_ip LD HTTPDATE:event_time"
| fields event_time, client_ip, content
| summarize total=count(), failed=countIf(contains(content, "/ludo-clinic/login?authenticationFailure=true")), by:client_ip
| sort failed desc
This pays off! The results reveal that a significant portion of logins (181,774) and failed logins (6161) originate from the IP address: 172.31.24.11. This seems interesting and is worth taking a closer look.
Timing of login failures
Next in our log forensics journey, let’s see when these failed logins from that particular IP address occurred to get more information on the potential reconnaissance activity. Did the requests all occur within a short period or regularly across a longer period?
Because we’re interested in the behavior of a specific IP and investigating the reasons behind failed logins, let’s also extract the session ID from the log line. As the session ID is the only field that occurs both in the access and application weblogs, it will be also useful later when we need to join the two for investigating affected users.
We already extracted the IP and included the timestamp (HTTPDATE). We will now extend the pattern and skip the part of the record we don’t need by not naming the three double-quoted strings (DQS). Finally, we’re extracting the last field that contains the session ID.
IPADDR:client_ip LD HTTPDATE:event_time LD DQS LD DQS LD DQS SPACE LD:session_id
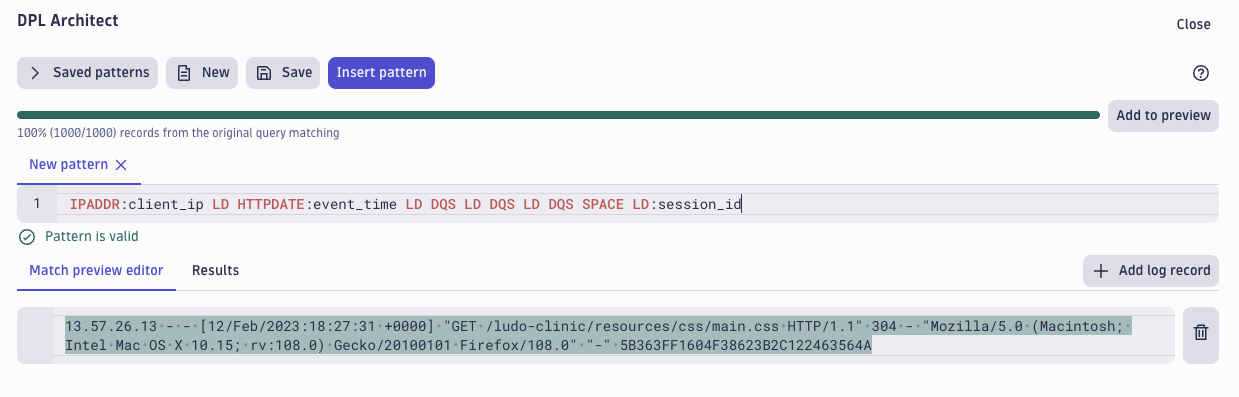
When we select Insert pattern, we again get a parse command populated with the DPL pattern we just created.
Focusing on the suspicious IP
Next, let’s select only the fields we’re interested in and then aggregate fields. These actions reveal more about the extended activity that involves the suspicious IP address responsible for many of the failed logins.
| fields time, client_ip, session_id, content
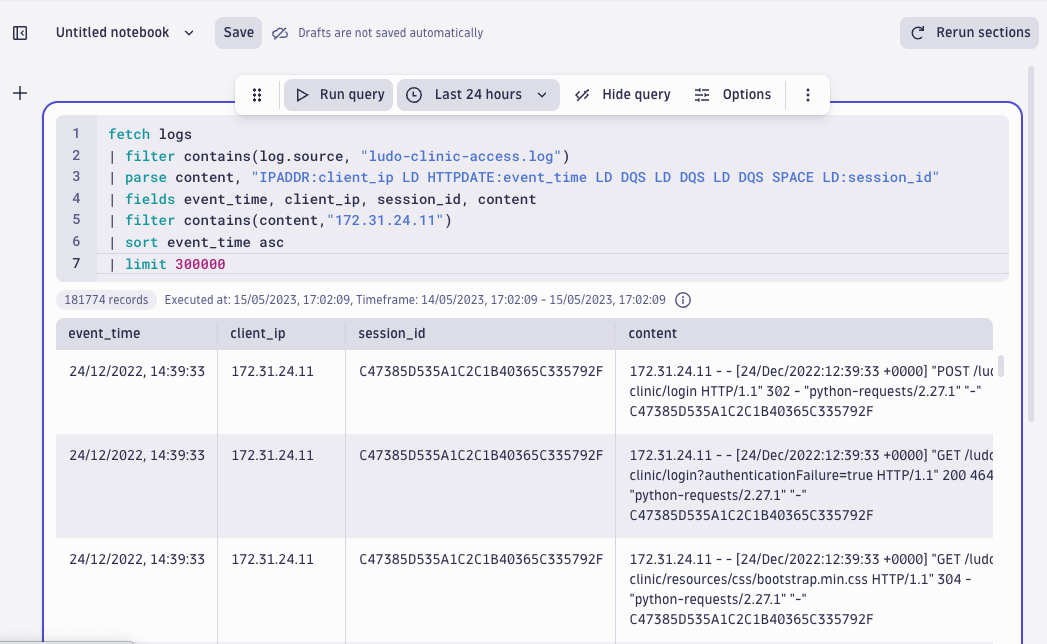
Filtering the attacker IP and sorting the fields based on the timestamp we just parsed out, it appears this IP address was first seen on 24 December 2022. We now know the start of the suspicious activity. For malicious actors, it is quite common to act during the holiday period.
fetch logs
| filter contains(log.source, "ludo-clinic-access.log")
| parse content, " IPADDR:client_ip LD HTTPDATE:event_time LD DQS LD DQS LD DQS SPACE LD:session_id"
| fields event_time, client_ip, session_id, content
| filter contains(content,"172.31.24.11")
| sort event_time asc
| limit 300000
Find the suspicious activity pattern across time
To see the activity pattern of this suspicious IP across time, let’s count the number of failed logins in one-hour time intervals.
fetch logs
| filter contains(log.source, "ludo-clinic-access.log")
| parse content, "IPADDR:ip LD HTTPDATE:time LD DQS LD DQS LD DQS SPACE LD:sessionID EOS"
| fields time, ip, sessionID, content
| filter contains(content,"172.31.24.11")
| summarize failed=countIf(contains(content, "/ludo-clinic/login?authenticationFailure=true")), by:bin(time, 1h)
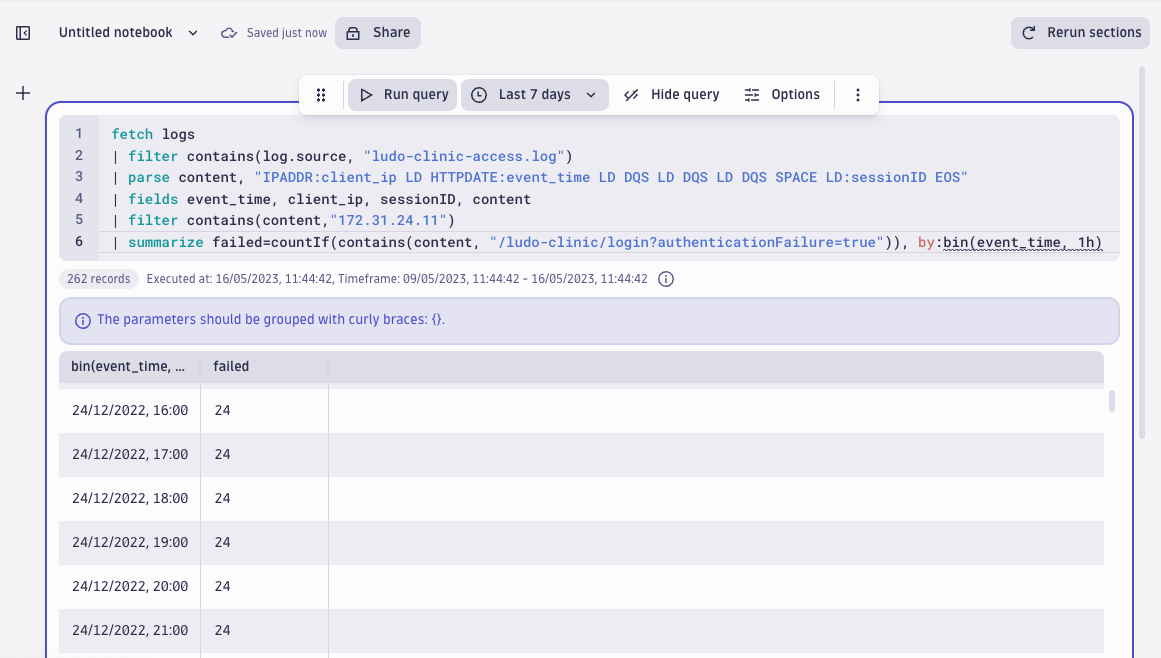
It appears as though failed logins from this IP appear to follow a very regular pattern: 24 failed attempts every hour. Looks like this activity is automated and most probably refers to a dictionary attack: regular (automated) attempts from the attacker to try out different usernames and passwords, mostly with failed results.
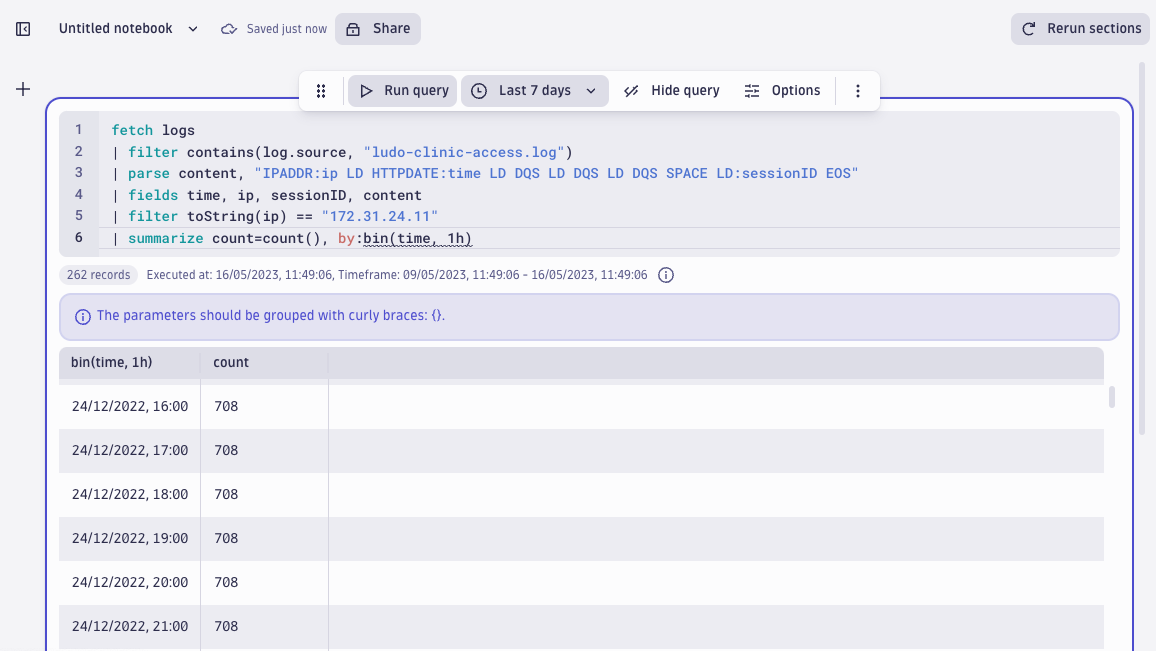
But to escape the clinic’s countermeasures (failed login attempts velocity check), the attacker also conducts a successful login every now and then. If we count all activity from that IP address (not just the failed logins but successful attempts as well), the results are again very symmetrical:
fetch logs
| filter contains(log.source, "ludo-clinic-access.log")
| parse content, "IPADDR:ip LD HTTPDATE:time LD DQS LD DQS LD DQS SPACE LD:sessionID EOS"
| fields time, ip, sessionID, content
| filter toString(ip) == "172.31.24.11"
| summarize count=count(), by:bin(time, 1h)
Identify targeted users
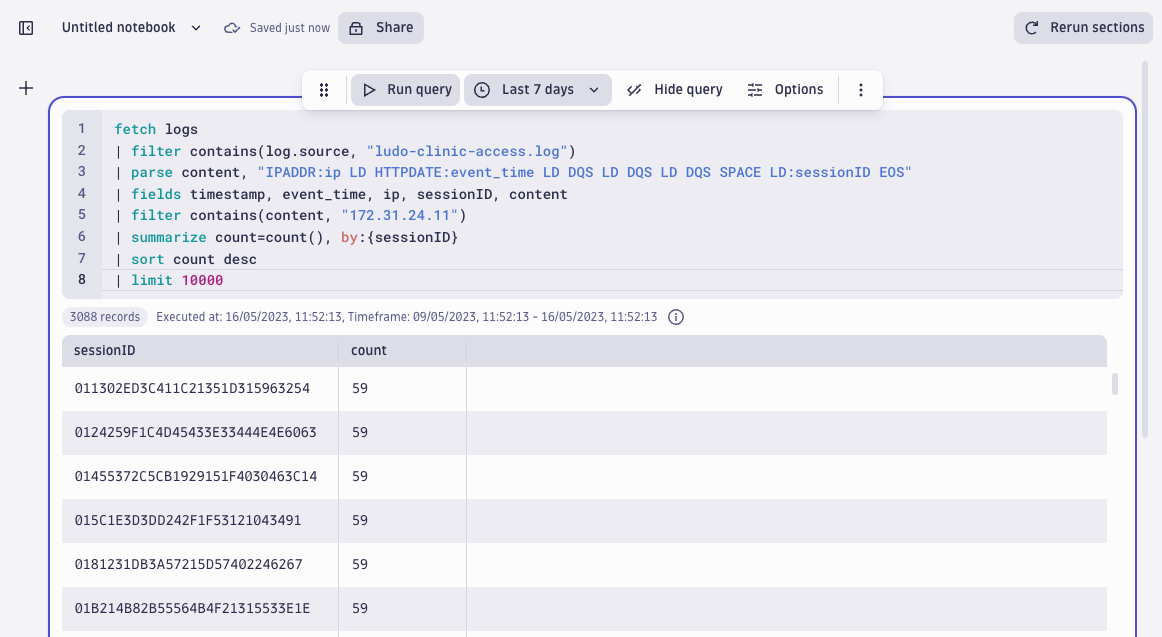
Next, it would be useful to know which users the attacker has targeted and whether any attempts have been successful. Let’s aggregate the activity from this IP using sessionIDs:
fetch logs
| filter contains(log.source, "ludo-clinic-access.log")
| parse content, "IPADDR:ip LD HTTPDATE:event_time LD DQS LD DQS LD DQS SPACE LD:sessionID EOS"
| fields timestamp, event_time, ip, sessionID, content
| filter contains(content, "172.31.24.11")
| summarize count=count(),
            by:{sessionID
               }
| sort count desc
| limit 10000
The result is again peculiar, suggesting automated activity: 59 log lines per session.
Next log forensics dataset: The web application log
Next, let’s see what was happening based on the web application log, using data from what was going on during those sessions that originated from the suspicious IP address we discovered from the access log dataset.
First, to familiarize ourselves with the content of the webapp log, let’s run a basic query to see what the content field of the web application log looks like:
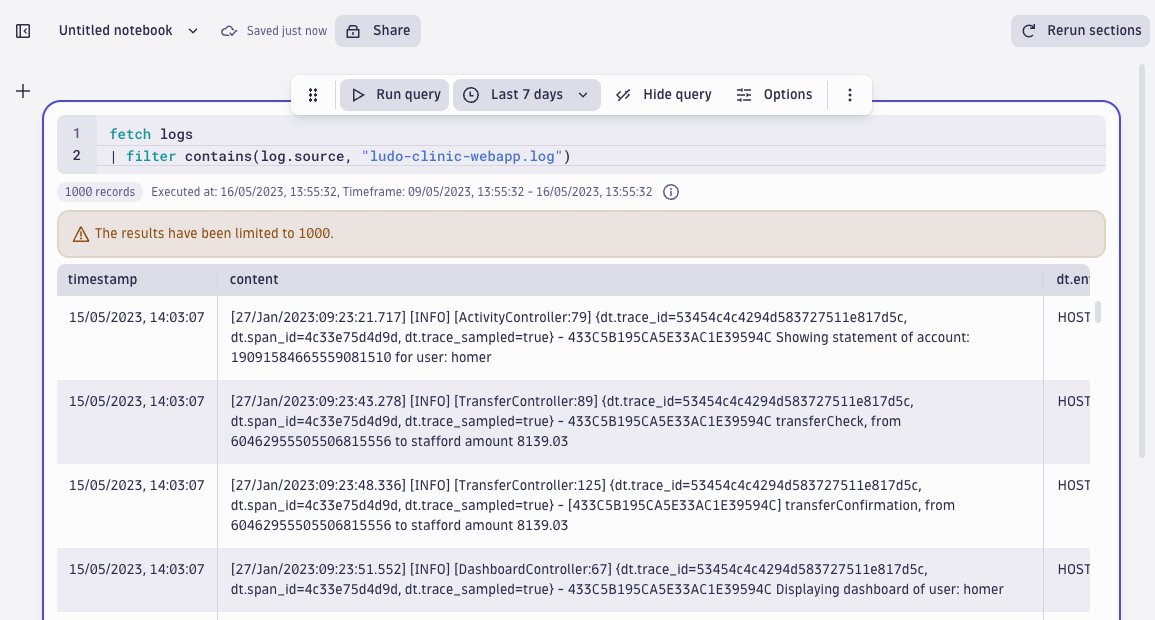
We can see a timestamp, log severity, traces and spans, a session ID, result, and username. There are plenty of interesting fields to play with, so the next step is to parse the content into fields that are ready for querying. We can extract the fields using the DPL Architect. The following DPL pattern extracts the event time session ID, result, and username from the webapp log.
'[' TIMESTAMP('dd/MMM/yyyy:HH:mm:ss.S'):event_time LD ' - ' LD:sessionIdApp ' ' LD:result_text ': ' LD:username (';' | EOS)
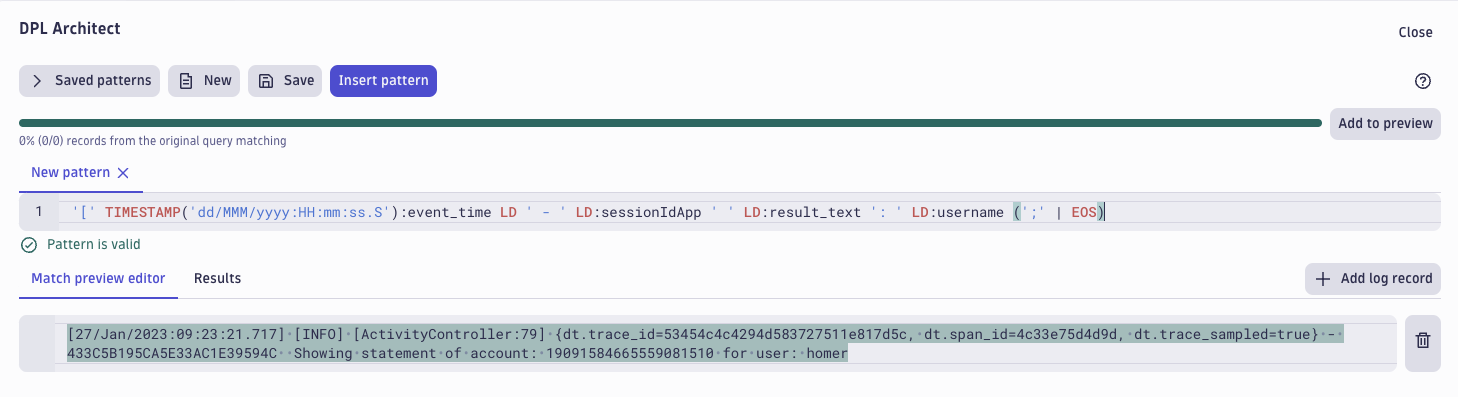
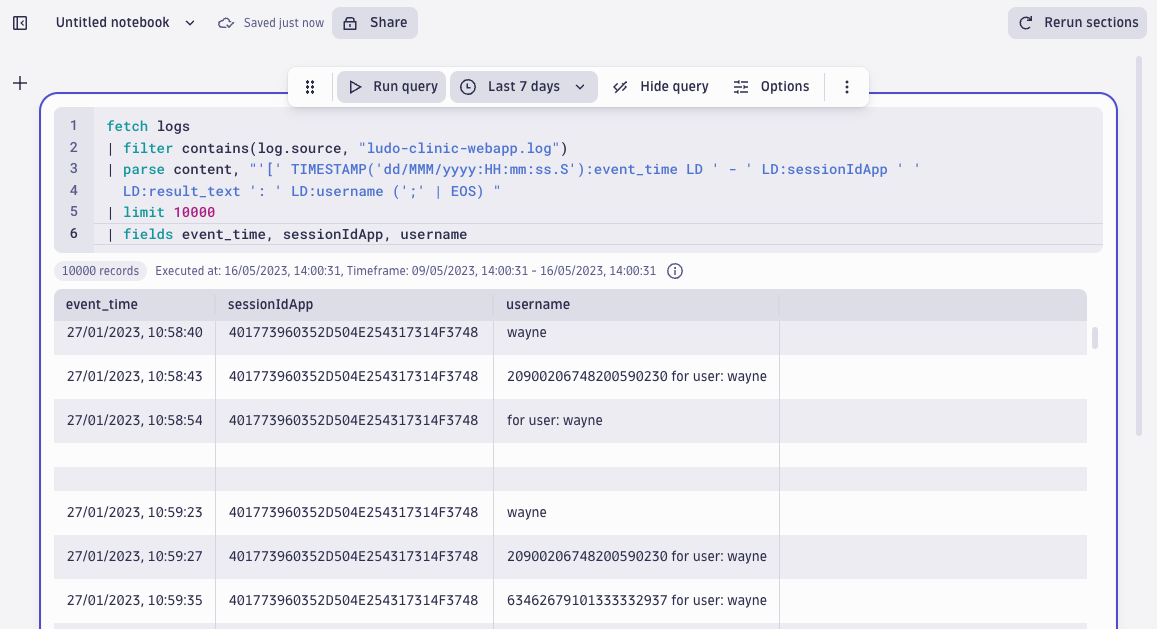
Inserting the pattern, this is what the query looks like when parsing out session IDs and usernames from the web application log.
fetch logs, from:-300d
| filter contains(log.source, "ludo-clinic-webapp.log")
| parse content, "'[' TIMESTAMP('dd/MMM/yyyy:HH:mm:ss.S'):event_time LD ' - ' LD:sessionIdApp ' ' LD:result_text ': ' LD:username (';' | EOS) "
| limit 10000
| fields event_time, sessionIdApp, result_text, username
Filter out records from the authentication provider
To see which users were targeted and how successful the attacker was, we will continue working with only those web application records that contain authentication responses. First, we filter out the records that originate from the authentication provider, then we skip the responses we’re not interested in:
| filter contains(content, "CustomAuthenticationProvider")
  AND NOT contains(content, "Starting findUsersByUsernameAndPassword") // we want to see only auth response log records
  AND NOT contains(content, "retrieved matching list")
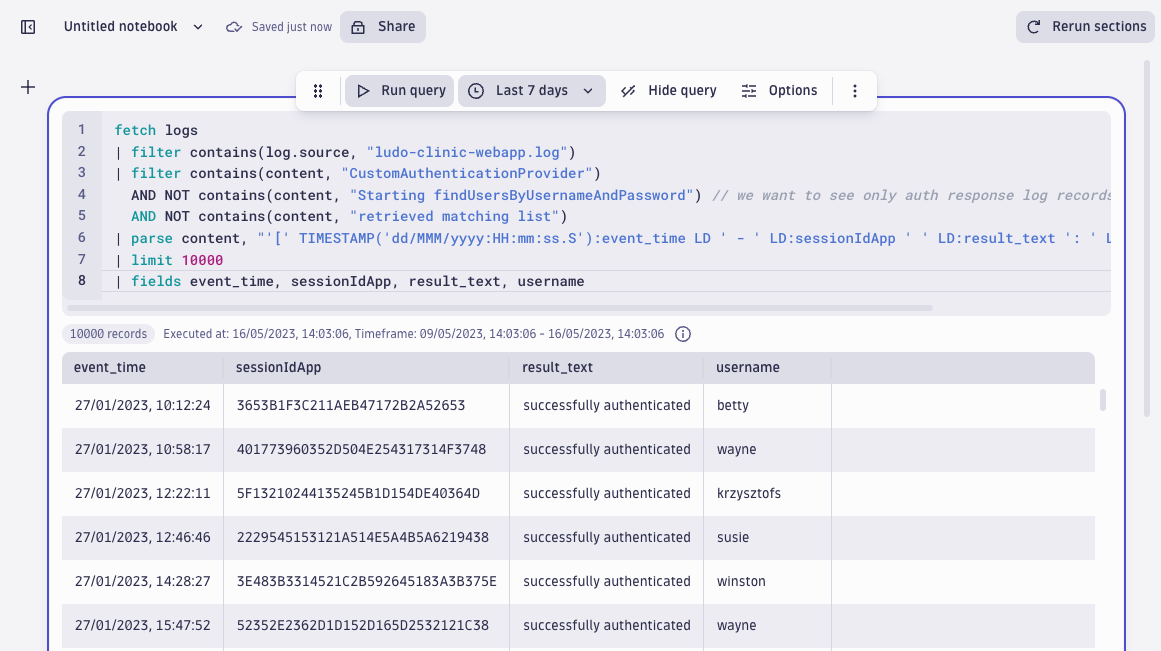
The full query now looks like this and returns the following results:
fetch logs
| filter contains(log.source, "ludo-clinic-webapp.log")
| filter contains(content, "CustomAuthenticationProvider")
  AND NOT contains(content, "Starting findUsersByUsernameAndPassword") // we want to see only auth response log records
  AND NOT contains(content, "retrieved matching list")
| parse content, "'[' TIMESTAMP('dd/MMM/yyyy:HH:mm:ss.S'):event_time LD ' - ' LD:sessionIdApp ' ' LD:result_text ': ' LD:username (';' | EOS) "
| limit 10000
| fields event_time, sessionIdApp, result_text, username
Review the user sessions that originate from the attacker
Next, to see which user sessions in the webapp log originated from the attacker’s activity, we use a lookup query to join aggregated sessions from the attacker IP address we discovered in the access log with sessions in the webapp log. In short, we will see what was happening during the suspicious sessions according to the webapp log.
fetch logs
| filter contains(log.source, "ludo-clinic-webapp.log")
| fields content
| filter contains(content, "CustomAuthenticationProvider")
  AND NOT contains(content, "Starting findUsersByUsernameAndPassword") // we want to see only auth response log records
  AND NOT contains(content, "retrieved matching list")

| limit 10000
| parse content, "'[' TIMESTAMP('dd/MMM/yyyy:HH:mm:ss.S'):event_time LD ' - ' LD:sessionIdApp ' ' LD:result_text ': ' LD:username (';' | EOS) "
| lookup [fetch logs, from:-300d
                | filter contains(log.source, "ludo-clinic-access.log")
                | filter contains(content,"172.31.24.11")
                | parse content, "IPADDR:ip LD HTTPDATE:time LD DQS LD DQS LD DQS SPACE LD:sessionID EOS"
                | filter isNotNull(sessionID)
                | limit 100000
                | summarize accesscount=count(), by:{sessionID}
                | fields sessionID], sourceField:sessionIdApp, lookupField:sessionID

| fieldsRemove content
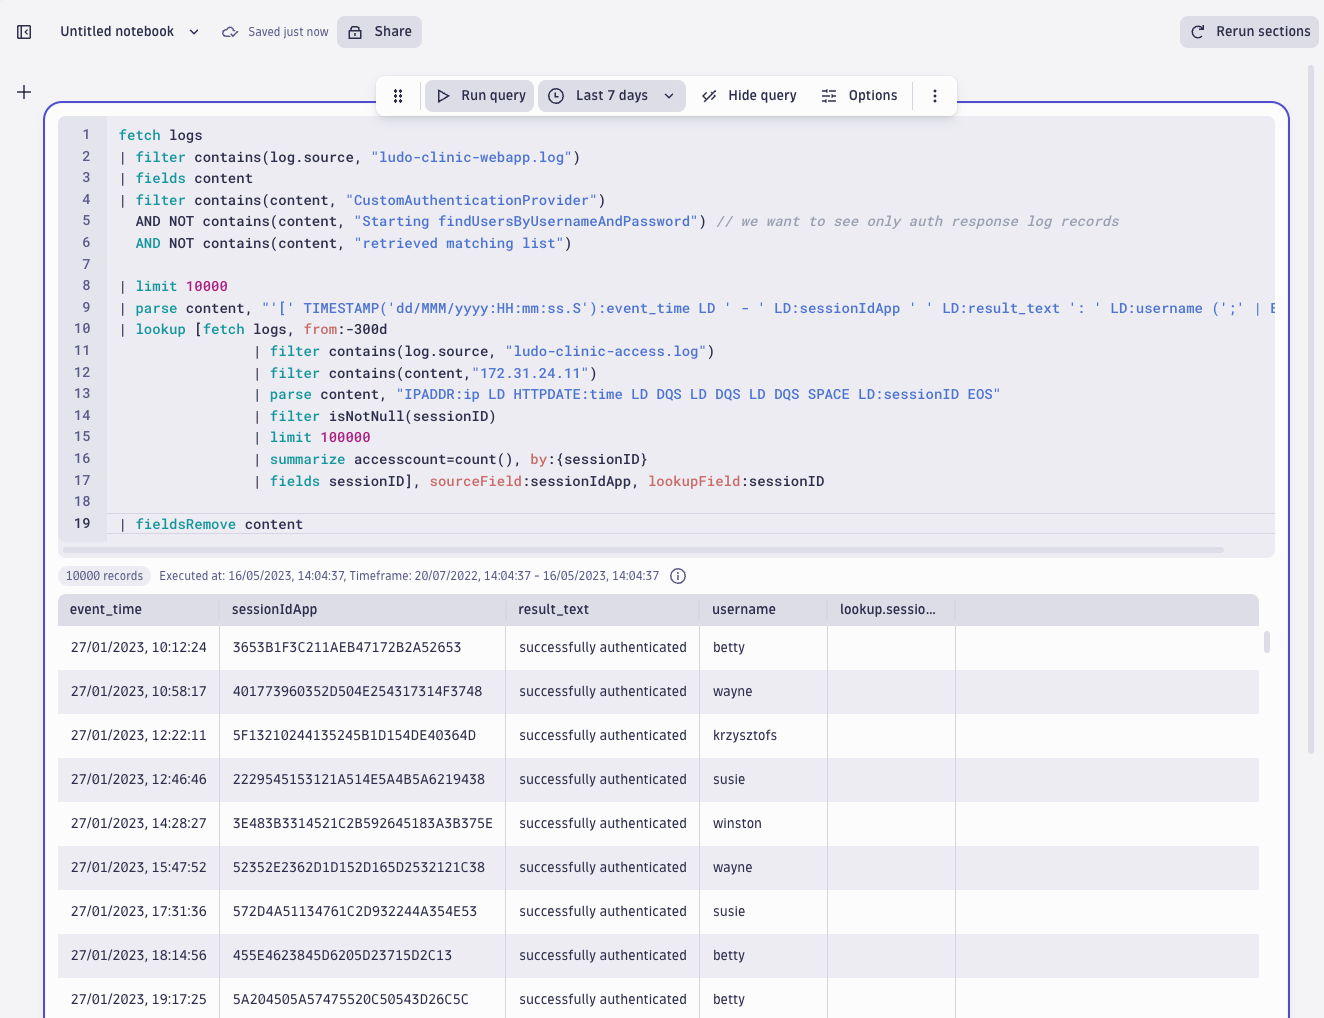
The result shows the attacker has achieved both successful authentications as well as failed authentications. Finally, we see which usernames the attack targeted the most by looking for the response “No users found requested username.” The system returns this value when it receives a non-existent user or a wrong password. By aggregating the result based on unique usernames, we get a list of the most (unsuccessfully) targeted users.
| filter result_text == "No users found requested username"
| summarize count(), by:{username}
| sort `count()`desc
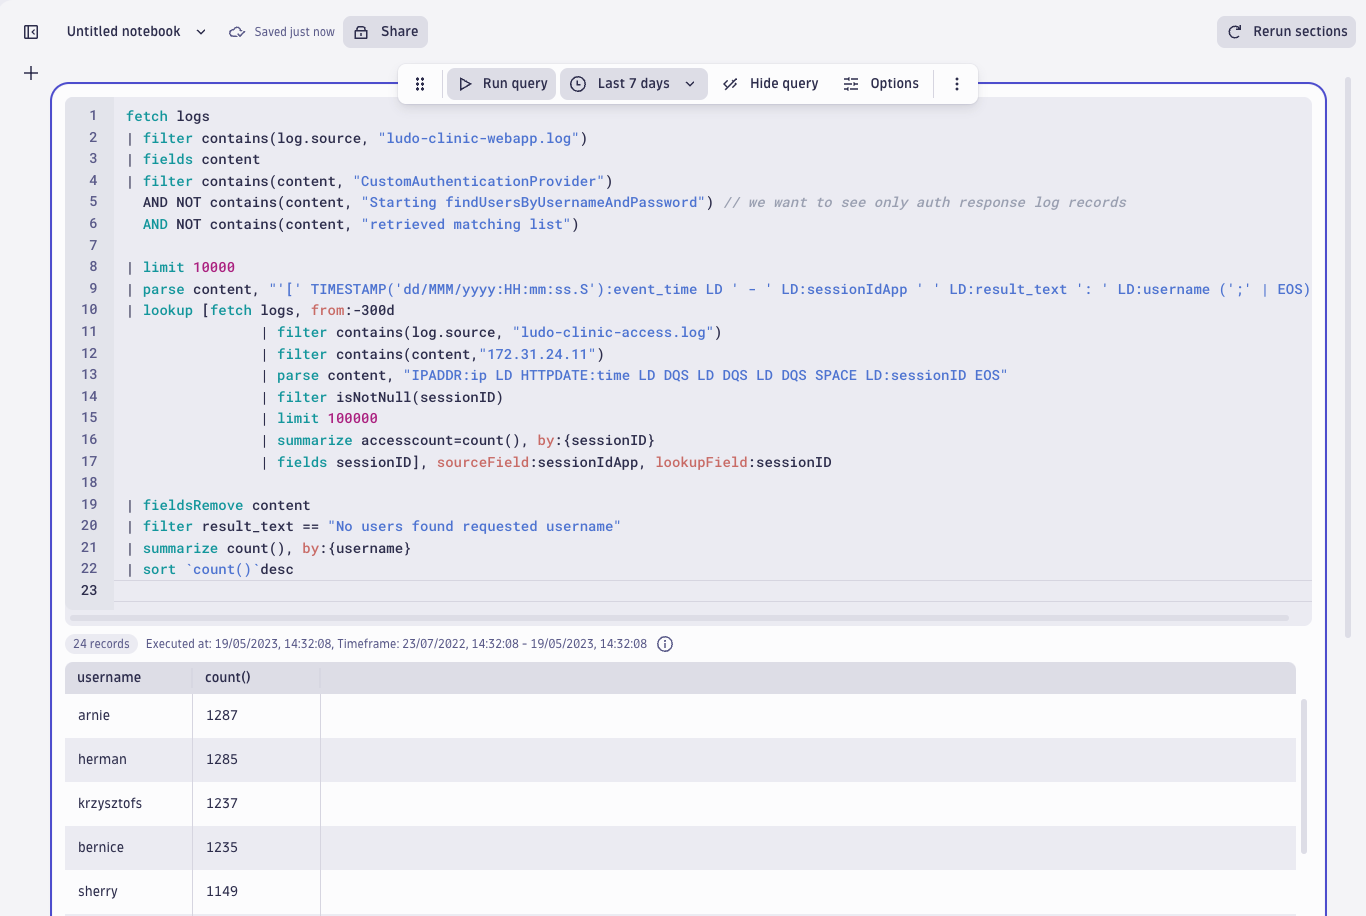
These results are fascinating – we can see five usernames that the attacker continuously entered and received failed authentication results. We can also see SQL commands instead of regular usernames.
Determine successfully targeted users
Next question: Did they achieve anything besides ‘No users found’ when targeting these users? Let’s have a look by excluding the “No users found requested username” response and concentrating on those five users from the last query result, and adding the following line to the query:
| filter not matchesPhrase (result_text, "No users found requested username") and in (username, "arnie", "herman", "krzysztofs", "bernice", "sherry")
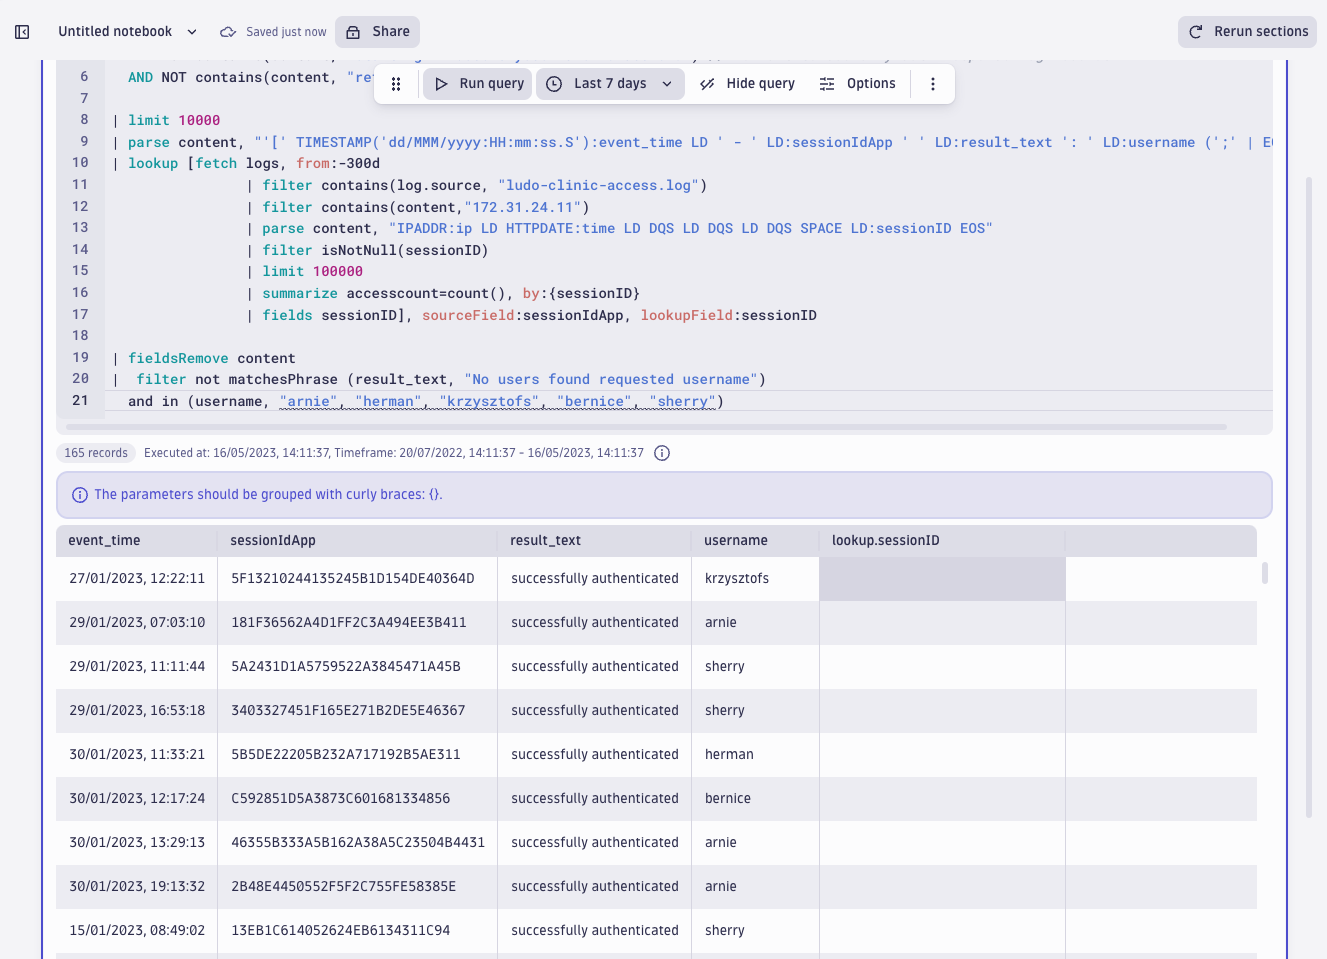
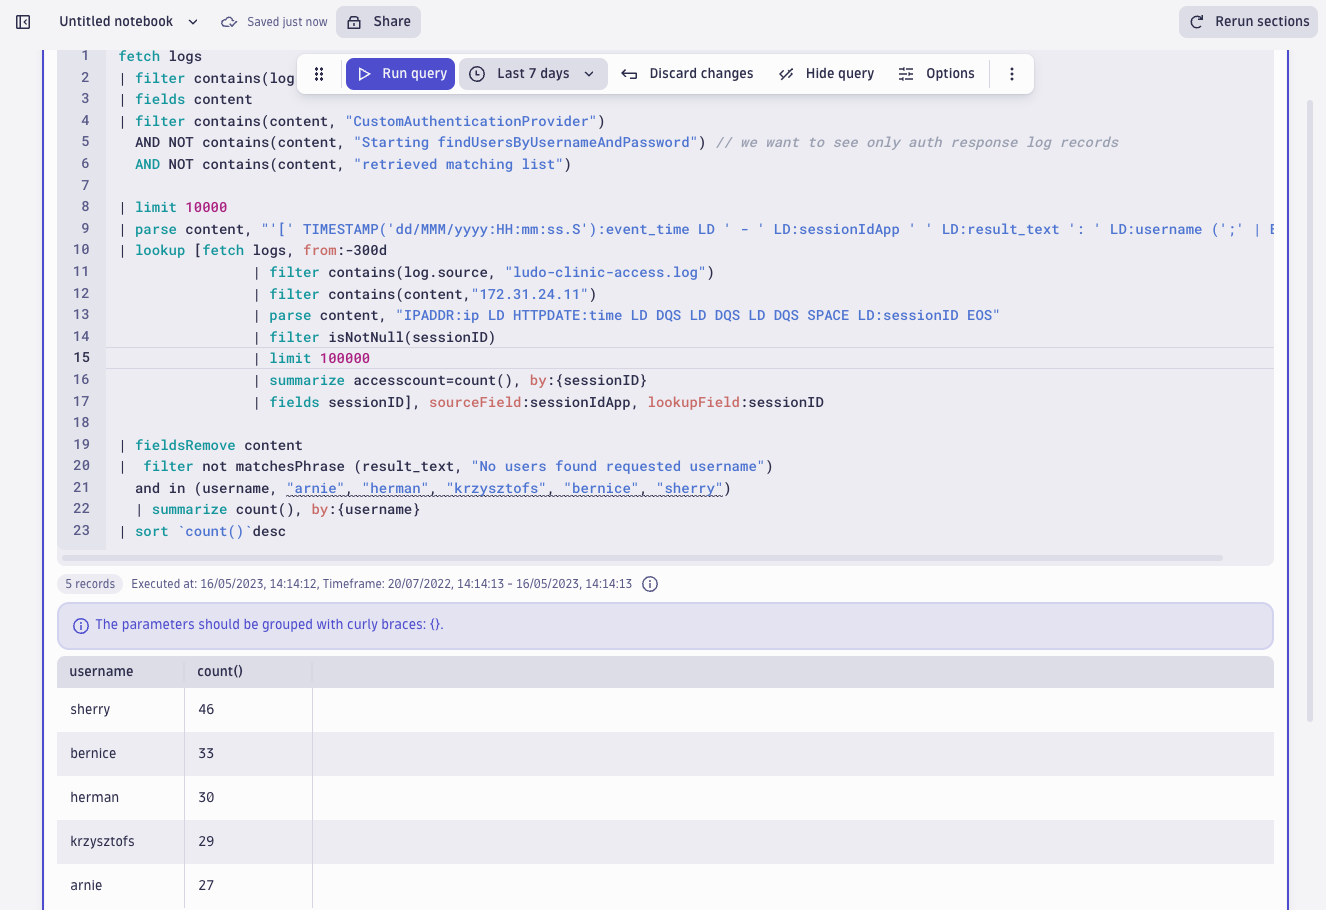
Indeed, we see a lot of “successfully authenticated” responses in the result text field. This confirms the attackers were successfully conducting a dictionary attack: trying out several usernames and passwords to authenticate as real users of Ludo Clinic. When counting the number of successful authentications per these five users, the results are quite similar:
|  filter not matchesPhrase (result_text, "No users found requested username") and in (username, "arnie", "herman", "krzysztofs", "bernice", "sherry")
| summarize count(), by:{username}
| sort `count()`desc
Investigation results from log forensics and metrics with Dynatrace
As a result of Dynatrace detecting a SQL vulnerability, anomalies in metrics, and subsequently running forensic queries on three months of logs prior to the attack, we’ve been able to construct the following timeline:
- As Ludo Clinic started using Dynatrace, they were able to observe a spike in metrics capturing failed logins on 8 February
- The system detected and blocked a SQL injection attack on 10 Feb (Fri)
- There was no other activity from that IP in the access logs (the logs reach back three months)
- When aggregating failed login activity, we discovered the following details: the IP address
172.31.24.11stands out from the rest, counting to 6161 failed logins based on the access log during the past three months - This IP was first seen in the logs on 24 December 2022 (the earliest timestamp for this set of logs is 20 November 2022)
- The sessions contain identical activities during identical timeframes, which suggests the attacker was using automated tools
- Joining sessions from the access log to the application log reveal almost ten thousand records originating from the suspicious IP
172.31.24.11 - It looks like the attackers were attempting a dictionary attack because it targeted several users at regular intervals, resulting in failed as well as successful authentications.
- Users
stafford,ray,orrel,dougandjobywere targeted to discover their passwords. The attacker successfully authenticated 35-37 times per user. - The attackers also entered SQL statements instead of usernames attempting SQL injection attacks.
The DQL and DPL advantage
For such investigations, DQL and DPL make it convenient to quickly investigate and query logs for security analytics use cases that require drawing broad conclusions from the data one minute and then zooming into the activities of a specific session the next. An interesting find inspires the analyst to parse out yet another field and run aggregations on this data. As historical data is always ready for querying, all hypotheses can be quickly verified or dismissed. A curious mind and the right log forensics tools (DQL and DPL) make a great combination for fighting evil.
To see more of Grail in action for log forensics and exploratory analytics, join us for the Observability Clinic: The Practitioner’s Guide to Analytics without Boundaries with Dynatrace.


Looking for answers?
Start a new discussion or ask for help in our Q&A forum.
Go to forum