
The need for precision telemetry has given rise to observability engineering, with Prometheus an essential tool in the kit. Here’s how to fine tune Prometheus metrics to gain full ETL functionality for telemetry data using the OpenTelemetry Collector and Dynatrace through the lens of Kepler on Kubernetes as a use case.
For busy site reliability engineers, ensuring system reliability, scalability, and overall health is an imperative that’s getting harder to achieve in ever-expanding, cloud-native, container-based environments. This challenge has given rise to the discipline of observability engineering, which concentrates on the details of telemetry data to fine-tune observability use cases. To get a more granular look into telemetry data, many analysts rely on custom metrics using Prometheus. Named after the Greek god who brought fire down from Mount Olympus, Prometheus metrics have been transforming observability since the project’s inception in 2012.
According to the 2023 Kubernetes in the Wild report, 65% of organizations use Prometheus. Another source reported a 43% overall increase in Prometheus adoption for the last six months of 2021. As the two first graduates of the open source project incubator, the Cloud Native Computing Foundation (CNCF), Kubernetes and Prometheus are usually deployed together. But end-to-end observability of the full stack at scale and in context is only achievable with a comprehensive AI-based observability platform, such as Dynatrace.
In this article, we take a closer look at Prometheus metrics and how we can ingest this data into Dynatrace. To make it real, we also discuss a concrete use case with Kepler on Kubernetes.
To set the stage, let’s have a quick recap of what Prometheus is and what it does.
What is Prometheus? An essential observability engineering tool
Prometheus is an open-source telemetry database service that records and stores custom software metrics and provides a standardized interface to pull (in Prometheus terms, “scrape”) data using HTTP requests. Because of its adaptability, Prometheus has become an essential tool for observability engineering. Prometheus metrics can be any measurable value you’re interested in, ranging from system parameters (such as disk space, system memory, CPU load, and so on) to application-specific values (such as concurrent users, visit durations, and so on).
Once you have recorded and collected the desired metrics, you can visualize them in the Dynatrace backend and use that for further behavior and pattern analysis and application management.
Kepler on Kubernetes as use case
When we use OneAgent or, with Kubernetes, Dynatrace Operator, we actually get full-stack observability of our system out-of-the-box already. This covers the infrastructure, processes, and the application stack, including tracing, profiling, and logs.
But often, we use additional services and solutions within our environment for backups, storage, networking, and more. These technologies don’t always act as part of the full-stack environment but typically expose metrics in Prometheus format. As part of our observability engineering strategy, we want that data as well and to make sure it gets sent to Dynatrace.
Kubernetes-based efficient power level exporter (Kepler) is a Prometheus exporter that uses ML models to estimate the energy consumption of Kubernetes pods. In our case, we wanted to highlight the value of using Kepler to provide the energy consumption of our Kubernetes workload. One great feature of Kepler is that it provides us with the necessary granularity to understand the energy usage per namespace, pod, or even processes within a pod.
You can ingest Prometheus metrics into Dynatrace in the following two ways:
We discussed the first approach in an article a while ago. As for the Collector, this will be the choice of tool for our implementation and this article.
The Collector and Prometheus
The next step on our observability engineering journey with Prometheus metrics is the OpenTelemetry Collector.
The OpenTelemetry Collector is a network service application that provides extract, transform, load (ETL)-like proxy functionality for managing and transforming OpenTelemetry signals (traces, metrics, and logs) into a format that an observability platform can easily ingest for detailed analysis. The Collector’s principal developer is the OpenTelemetry team, but it also sees contributions of custom components by third parties (for example, Dynatrace).
The Collector’s primary focus is to receive telemetry data from different sources and in a variety of formats, provide the ability to manipulate and transform that data, and eventually forward things as OTLP to the desired upstream service (for example, the Dynatrace backend).
For this purpose, the Collector consists of different components, including receivers, which are the entry point for data into the world of the Collector. In the context of Prometheus, the Prometheus receiver takes the central role, as it’s the core component that enables the Collector to scrape data from Prometheus.
Configuring the Collector
Like most Collector components, we can (and should) configure and customize the Prometheus receiver. With our use case, we made the following basic configurations:
- Drop irrelevant labels
- Drop unnecessary metrics and incompatible metric types
- Convert metrics with cumulative aggregation to their delta counterparts
When we decided to ingest Prometheus metrics, we first looked at the set of emitted metrics and which would be most relevant for us. Our goal was to filter for metrics that deliver the data we need while minimizing storage costs.
Now, you may wonder why storing more metrics could significantly hike increase our monthly expenses, and the answer is fairly simple: labels and dimensions.
The cost of a metric highly depends on the number of labels and dimensions you associate with it. A metric that has only two labels will set you back less than one with eight or more dimensions.
Finding relevant metrics
The metrics generated by Kepler enabled us to tell which metrics were relevant to our use case.
For Kubernetes, it’s a good idea to configure port-forwarding to facilitate database debugging, which enables us to load the metrics overview in our browser.
kubectl port-forward svc/kepler 9102:9102 -n kepler
With this setup, we can now view our metrics in the browser at http://localhost:9102/metrics. This should give us something like the following:
kepler_container_kubelet_memory_bytes_total{command="monitor",container_id="69a2b5497c29386d2dd3e215ce9cfe6321191149a3505fa4d157f2a30a7f931c",container_name="prometheus-to-sd-exporter",container_namespace="kube-system",pod_name="event-exporter-gke-7bf6c99dcb-dddlv"} 1.0428416e+07

kepler_container_kubelet_memory_bytes_total{command="monitor",container_id="f6ce9c94dc86fc24b50d19f04397a36aa67a475cb02bf8fc0c4ce42cb815429e",container_name="prometheus-to-sd",container_namespace="kube-system",pod_name="kube-dns-5bfd847c64-ml5fl"} 7.94624e+06

kepler_container_kubelet_memory_bytes_total{command="operator",container_id="254be6ac810af01c0f31a5c6c72db42ffb7e8b3c35449b9547a3d50453bfd51c",container_name="operator",container_namespace="gmp-system",pod_name="gmp-operator-78b6dc9bfc-mlcjf"} 2.1192704e+07

kepler_container_kubelet_memory_bytes_total{command="otelcol-co",container_id="8ce1ccd10d9743cd75ec557fe778b86eb817d78eabc61ed5818e48d07189bff9",container_name="otc-container",container_namespace="default",pod_name="oteld-collector-dn6hb"} 5.2711424e+07

, revision, branch, and goversion from which kepler_exporter was built.

# TYPE kepler_exporter_build_info gauge

kepler_exporter_build_info{branch="",goversion="go1.18.1",revision="",version=""} 1

# HELP kepler_node_core_joules_total Aggregated RAPL value in core in joules

# TYPE kepler_node_core_joules_total counter

kepler_node_core_joules_total{instance="gke-isitobservable-kumam-default-pool-5e8517a3-7l1x",mode="dynamic",package="0",source="rapl"} 1.728450986e+06

# HELP kepler_node_dram_joules_total Aggregated RAPL value in dram in joules

# TYPE kepler_node_dram_joules_total counter

kepler_node_dram_joules_total{instance="gke-isitobservable-kumam-default-pool-5e8517a3-7l1x",mode="dynamic",package="0",source="rapl"} 416835.916

# HELP kepler_node_info Labeled node information

# TYPE kepler_node_info counter

kepler_node_info{cpu_architecture="Broadwell"} 1

# HELP kepler_node_other_joules_total Aggregated RAPL value in other components (platform - package - dram) in joules

# TYPE kepler_node_other_joules_total counter

kepler_node_other_joules_total{instance="gke-isitobservable-kumam-default-pool-5e8517a3-7l1x",mode="dynamic"} 0

# HELP kepler_node_package_joules_total Aggregated RAPL value in package (socket) in joules

# TYPE kepler_node_package_joules_total counter

kepler_node_package_joules_total{instance="gke-isitobservable-kumam-default-pool-5e8517a3-7l1x",mode="dynamic",package="0",source="rapl"} 461518.058

# HELP kepler_node_platform_joules_total Aggregated RAPL value in platform (entire node) in joules

# TYPE kepler_node_platform_joules_total counter

kepler_node_platform_joules_total{instance="gke-isitobservable-kumam-default-pool-5e8517a3-7l1x",mode="dynamic",source="acpi"} 1660.582

# HELP kepler_node_uncore_joules_total Aggregated RAPL value in uncore in joules

# TYPE kepler_node_uncore_joules_total counter

kepler_node_uncore_joules_total{instance="gke-isitobservable-kumam-default-pool-5e8517a3-7l1x",mode="dynamic",package="0",source="rapl"} 0

# HELP kepler_process_bpf_block_irq_total Aggregated block irq value obtained from BPF

# TYPE kepler_process_bpf_block_irq_total counter

kepler_process_bpf_block_irq_total{command="bash",pid="2448"} 0

kepler_process_bpf_block_irq_total{command="bash",pid="44110"} 0

kepler_process_bpf_block_irq_total{command="bash",pid="44111"} 0

kepler_process_bpf_block_irq_total{command="bash",pid="44112"} 0

kepler_process_bpf_block_irq_total{command="containerd",pid="10377"} 0

kepler_process_bpf_block_irq_total{command="containerd",pid="10555"} 0

kepler_process_bpf_block_irq_total{command="containerd",pid="10667"} 10

kepler_process_bpf_block_irq_total{command="containerd",pid="10673"} 0

kepler_process_bpf_block_irq_total{command="containerd",pid="10674"} 0

kepler_process_bpf_block_irq_total{command="containerd",pid="10691"} 0

kepler_process_bpf_block_irq_total{command="containerd",pid="10975"} 3

...
Identifying which metrics and labels we don’t need
With this list, we can already establish two key areas of metrics and labels to drop:
- Metrics we don’t need. There are quite a few metrics we won’t immediately need for our use case of energy usage. For example, the metrics with the
go_prefix or thekepler_process_uncore_joules_totalmetric. - Labels we don’t need. Many of the metrics come with labels we will not use for filtering or aggregation. For example, the process ID (PID) or the container ID won’t assist us in identifying how much energy we used and would only drive up storage costs.
With the scrape configuration of the Prometheus receiver, we can easily drop these metrics and labels. If you’ve never done that before, it all may seem very technical, but no worries, there really are just a few things to learn and consider.
First, let’s focus on the “kepler” job (see job_name) in our demo YAML configuration of the Prometheus receiver:
prometheus:
  config:
    scrape_configs:
    - job_name: opentelemetry-collector
      scrape_interval: 5s
      static_configs:
      - targets:
        - ${MY_POD_IP}:8888
    - job_name: kepler
      scrape_interval: 5s
      static_configs:
      - targets:
        - kepler.kepler.svc.cluster.local:9102
      relabel_configs:
      - source_labels: [__name__]
        regex: 'kepler_process_uncore_joules'
        action: drop
      - source_labels: [__name__]
        regex: 'go_*'
        action: drop
      - action: labeldrop
        regex: container_id
      - action: labeldrop
        regex: pid
The “kepler” job configures the Prometheus receiver to scrape the target host kepler.kepler.svc.cluster.local for new metrics every five seconds.
However, the actual label magic happens under relabel_configs. There, we can define a set of rules that the receiver will apply after scraping the data and before sending it to Dynatrace. That’s the perfect place to filter the labels.
As we want to filter by name for two metrics, we use source_labels to configure a regular expression and define drop as the action.
- source_labels: [__name__]
  regex: 'kepler_process_uncore_joules'
  action: drop
- source_labels: [__name__]
  regex: 'go_*'
  action: drop
In addition to drop, the Prometheus receiver also offers the following action types:
replacelowercaseuppercasekeepdroplabelkeeplabeldrop
The action drop drops the metric entirely, whereas labeldrop keeps the metric but filters the associated labels. This is exactly what we did in the second part of the configuration, limiting the number of labels/dimensions of our metrics.
- action: labeldrop
  regex: container_id
- action: labeldrop
 regex: pid
Here, we drop the labels for the process and container ID from our metric.
Jolly good! So far, we have managed to trim down our metrics to exactly the set of data we need for our use case. But for our observability engineering mission, we still need to take a few more things into consideration before we can send data to Dynatrace. One of them is dropping unsupported metric types.
Drop incompatible metric types
For now, Dynatrace does not support OpenTelemetry histograms yet. For that reason, we had to make sure that the metrics we send to Dynatrace do not contain histograms.
The best approach is to ensure this at the source already and not record histograms in the first place. But as that is not always possible (for example, you need histograms for export to a third party), we can also use the Filter processor to specifically drop histogram metrics on the Collector side.
processors:
  filter:
    error_mode: ignore
    metrics:
      metric:
        - 'type == METRIC_DATA_TYPE_HISTOGRAM'
Processors are software components located between the receiver and exporter that can manipulate and transform data.
After adding the label drop configurations above to your file, make sure to reference the processor in your pipeline as well. This means adding a “processors” entry to the service pipeline definition and adding the filter processor, as shown in the following example:
service:
  pipelines:
    metrics:
      receivers: [RECEIVERS-HERE]
      processors: [filter, OTHER-PROCESSORS-HERE]
      exporters: [EXPORTERS-HERE]
To see how the full configuration would look, see the section “The full configuration” later in this article.
Cumulative vs. delta metric aggregation methods
Another thing to keep in mind is the aggregation type of metric values. There are two distinct types available in the observability engineering world of telemetry:
- relative (delta) values as used by StatsD
- absolute (cumulative) values as used by Prometheus
When using relative (delta) values, OpenTelemetry only publishes the difference to the last recorded value, whereas absolute (cumulative) always publishes the fully aggregated sum for that interval.
For example, imagine your system had 10 gigabytes of free memory at the last reporting iteration and now only has 8 gigabytes. With delta values, OpenTelemetry would not report those 8 gigabytes, but rather -2 gigabytes, as that’s the difference from the previously reported 10 gigabytes.
The following two images illustrate how delta and cumulative aggregation work.
Delta aggregation:
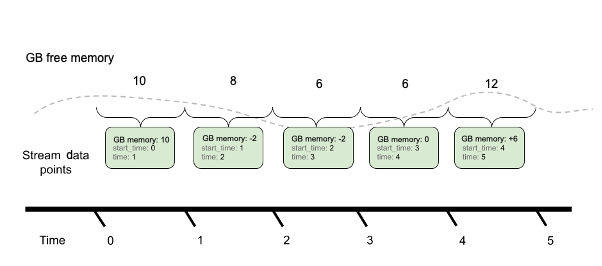
Cumulative aggregation:
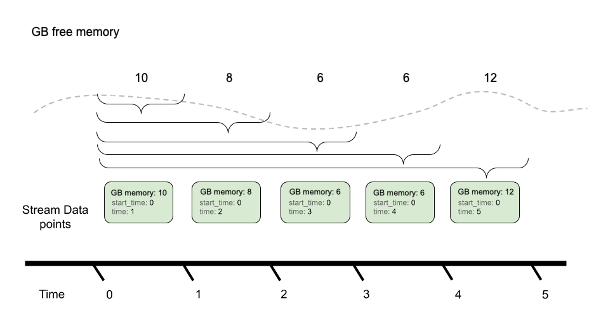
Dynatrace works with delta values, but Prometheus records cumulative data, so we first need to convert that. This is one more time where a Collector processor can come to the rescue: the Cumulative-to-Delta processor.
processors:
  cumulativetodelta:
While this processor also comes with quite a few configuration options, it is typically sufficient to use its default settings and only declare the processor as an active component under “processors.” Just like with our filter processor, make sure to reference it in your pipeline as well (in the following example, we assume you also configured the filter processor).
service:
  pipelines:
    metrics:
      processors: [filter, cumulativetodelta, OTHER-PROCESSORS-HERE]
The full configuration
With all these snippets, we can now fully assemble our complete Collector configuration:
receiver:
  prometheus:
    config:
      scrape_configs:
      - job_name: opentelemetry-collector
        scrape_interval: 5s
        static_configs:
        - targets:
          - ${MY_POD_IP}:8888
      - job_name: kepler
        scrape_interval: 5s
        static_configs:
        - targets:
          - kepler.kepler.svc.cluster.local:9102
        relabel_configs:
        - source_labels: [__name__]
          regex: 'kepler_process_uncore_joules'
          action: drop
        - source_labels: [__name__]
          regex: 'go_*'
          action: drop
        - action: labeldrop
          regex: container_id
        - action: labeldrop
          regex: pid

processors:
  batch:
    send_batch_max_size: 1000
    timeout: 30s
    send_batch_size : 800

  cumulativetodelta:

  filter:
    error_mode: ignore
    metrics:
      metric:
        - 'type == METRIC_DATA_TYPE_HISTOGRAM'

  memory_limiter:
    check_interval: 1s
    limit_percentage: 70
    spike_limit_percentage: 30

exporters:
  logging:
    verbosity: detailed
  otlphttp:
    endpoint: $DT_ENDPOINT/api/v2/otlp
    headers:
      Authorization: "Api-Token $DT_API_TOKEN"

service:
  pipelines:
     metrics/prom:
      receivers: [prometheus]
      processors: [memory_limiter,filter,cumulativetodelta,batch]
      exporters: [otlphttp]
In addition to our Prometheus receiver, the histogram filter, and the delta converter, we also configured the following components:
- The memory limiter processor, to manage memory allocation and usage of our Collector instance.
- The batch processor, to improve performance by batching requests.
- The OTLP/HTTP exporter, to perform the data export to Dynatrace.
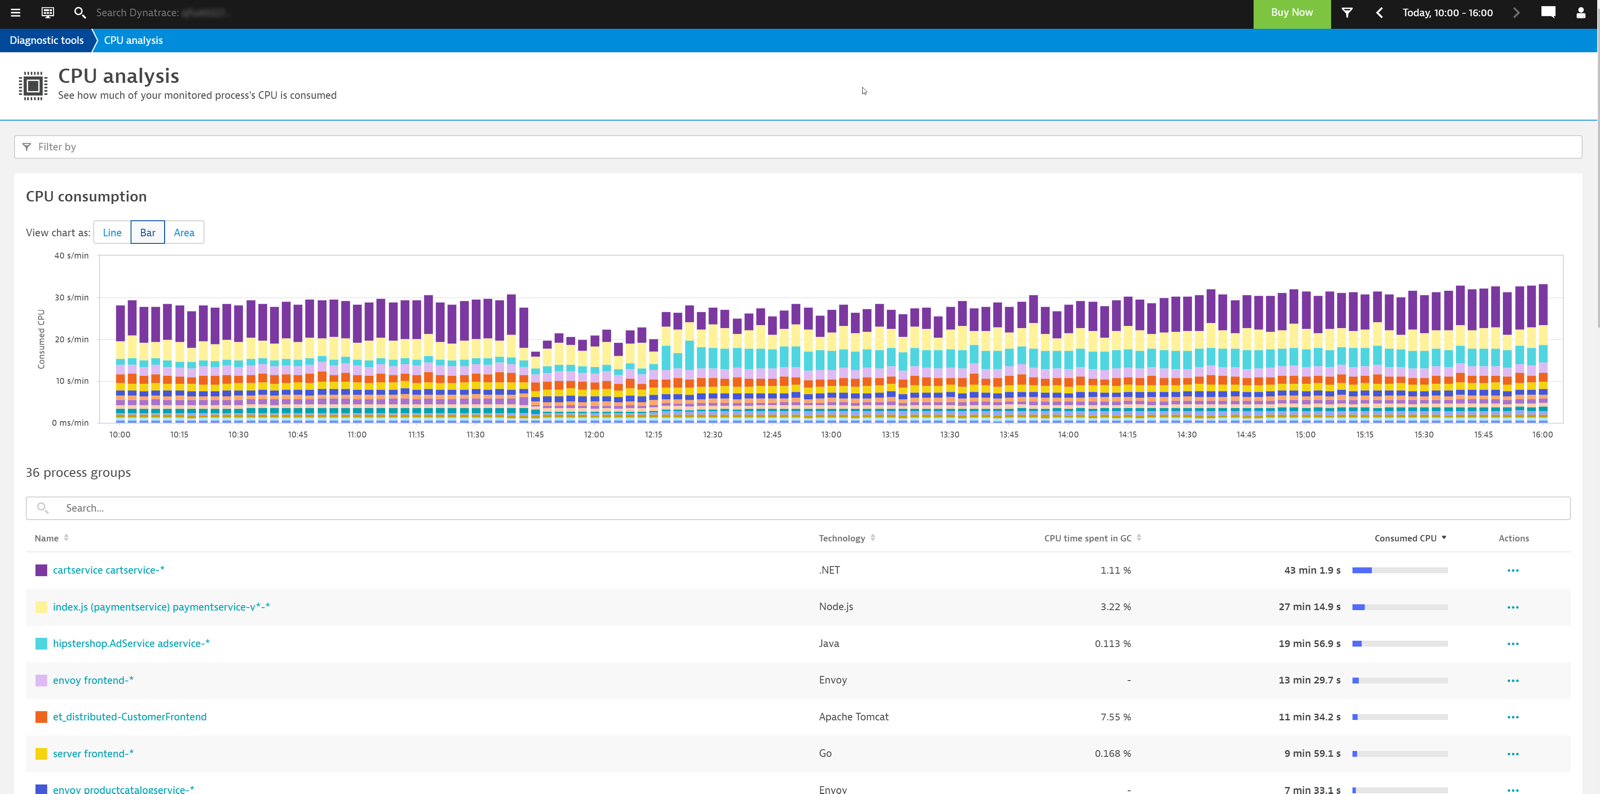
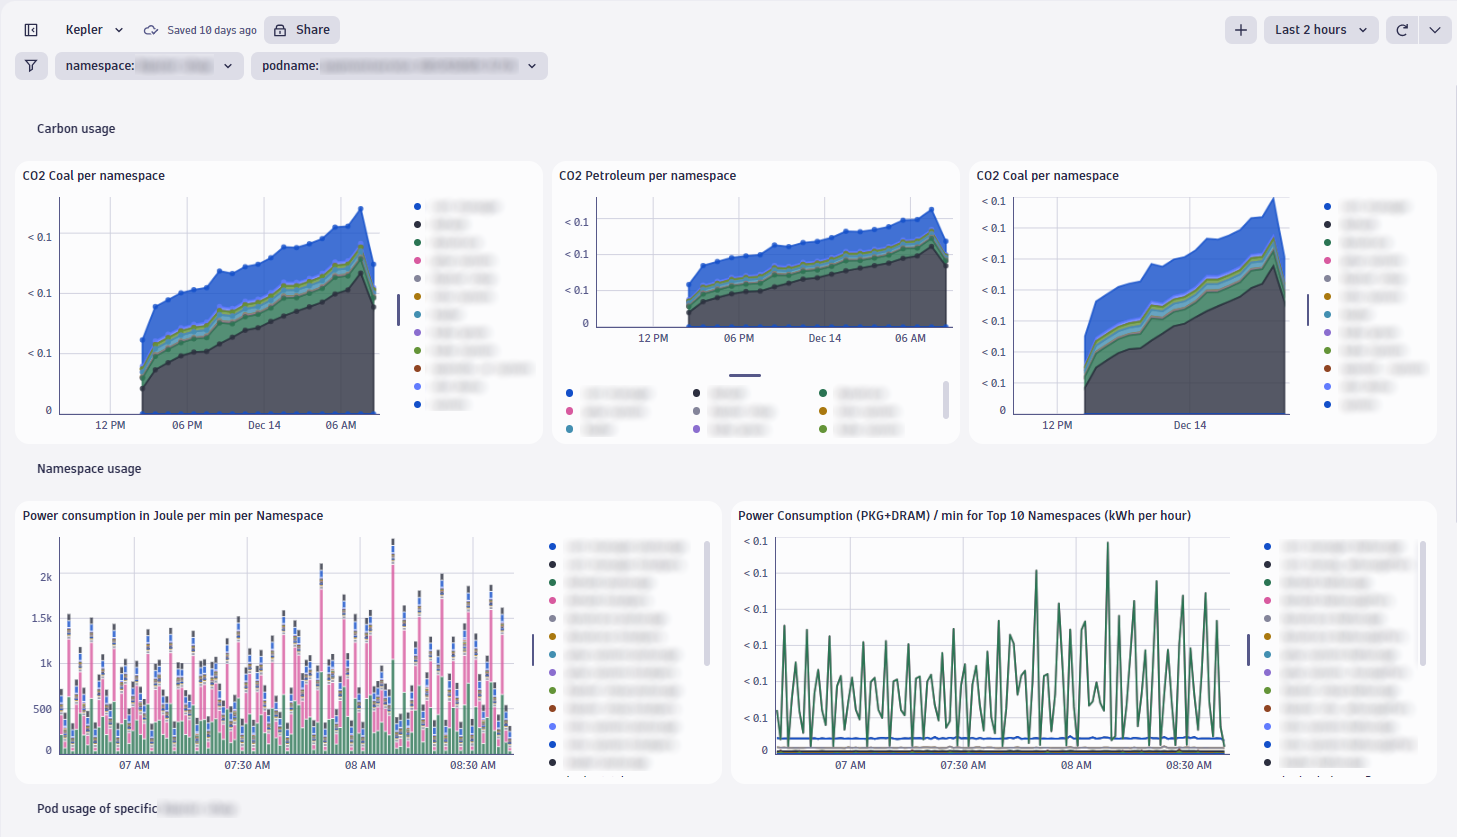
With this setup, we can successfully send Kepler Prometheus metrics to Dynatrace and get a great Kepler dashboard, providing us with the desired insights. Observability engineering success!
Fine-tuning telemetry data to achieve ETL functionality
For our observability engineering use case, the Collector is the ideal solution to achieve ETL functionality that manages and transforms OpenTelemetry logs, metrics, and traces. Using the Collector, we can natively scrape metrics from the Prometheus instance and, at the same time, run all the filters and conversions necessary for Dynatrace to ingest the data successfully for granular data analysis.
The Collector is a highly flexible platform and provides many more types of processors and receivers than we would possibly demo here. For example, there are receivers for data from IIS, Cloudflare’s logs, Google’s GCP, Kafka, Zipkin, and many more. You have a similar selection of processors, which allow you to redact data, enrich with Kubernetes attributes, apply sampling logic, and lots more.
In short, the Collector unlocks an entire array of conversion and management features, which enables us to ingest telemetry data from a variety of sources and apply adjustments according to our ingestion requirements.
Like other open observability tools and agents, the Collector can serve as a true digital Swiss Army knife that enables you to control and modify the data before sending it to Dynatrace. You can use it to adjust data cardinality, obfuscate personal identifiable information (PII), batch data to improve performance, and more. It really is an indispensable tool if you work with OpenTelemetry.
It’s also important to know that all the observability components (OpenTelemetry, Prometheus, Dynatrace) cooperate flawlessly, and you get the insight and information you’re after. If you’re curious about this topic and would like to learn more, please subscribe to our blog, as we will soon be back with another blog post on how to monitor and observe your Collector instances. Please stay tuned!


Looking for answers?
Start a new discussion or ask for help in our Q&A forum.
Go to forum