I tend to launch most programs on my Windows 10 laptop by typing the <Win> key, then a few letters of the program name, and then hitting enter. On my powerful laptop (SSD and 32 GB of RAM) this process usually takes as long as it takes me to type these characters, just a fraction of a second.
Usually.
Sometimes, however, it takes longer. A lot longer. As in, tens of seconds. The slowdowns are unpredictable but recently I was able to record an Event Tracing for Windows (ETW) trace of one of these delays. With a bit of help from people on twitter I was able to analyze the trace and understand why it took about a minute to launch notepad.
Before I get in to the analysis I have two warnings/disclaimers: 1) I have a good understanding of the problem, but I do not have a solution and 2) if you are seeing identical symptoms that doesn’t mean that your root cause is the same as mine, but I will give some hints on how to see if it is.
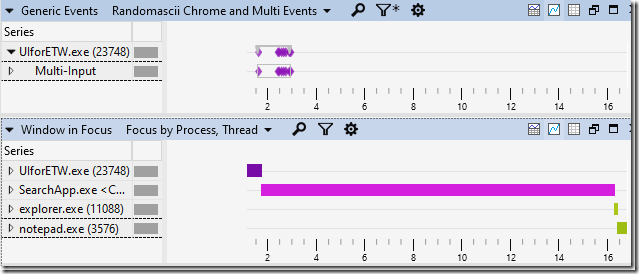
My analysis of the trace (trace is here, installer for the analysis tools is here, analysis tutorials are here, feel free to follow along) started with my looking at the input events and Window in Focus graph in Windows Performance Analyzer (WPA), both shown below (zoomed in a bit for maximum detail):
The first diamond in the Multi-Input row shows when I pressed the Windows key, with subsequent key presses (including pressing enter) clumped together shortly afterwards. The units on the x-axis are seconds so we can see that all of the typing took about 3/4 of a second.
The input events are injected into the trace by my UIforETW trace-recording tool. These input events are one of the reasons I prefer UIforETW over Microsoft’s trace-recording tools. I’ve hidden the table-view but it lists which keys were pressed, while anonymizing letters and numbers to prevent UIforETW from being a key logger. Input events can be a critical tool in helping know where/when to look in traces to understand what is happening.
The input events help establish context, but the Window in Focus events really tell the tale. We can see that the SearchApp (start menu?) gains focus as soon as I press the <Win> key but then nothing else happens for more than thirteen seconds. That’s the problem, visualized.
But why?
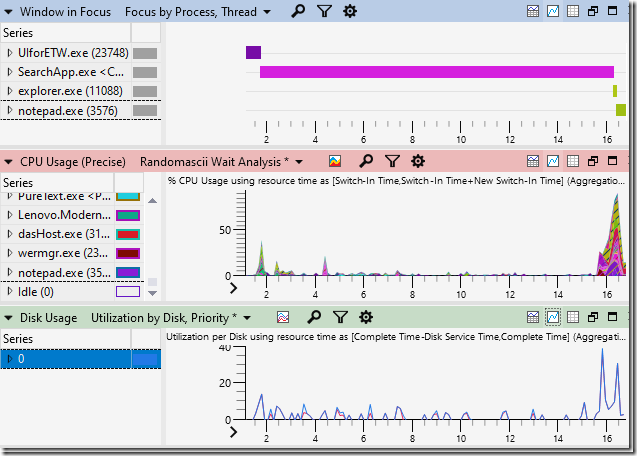
The next step is to see what is causing the delay. A quick glance at the CPU Usage (Precise) and Disk Usage graphs showed that the CPU and disk were almost 100% idle, so the start menu must be waiting on something else:
When a process is idle for a while when you wish that it was doing work then the challenge is to figure out what it was waiting on. I looked at the context-switch events in CPU Usage (Precise). Some of the SearchApp threads were named (yay!) but not all of them were and I couldn’t find the main thread to see what it was waiting on, so I had to poke around and hope something became obvious. I zoomed in on the burst of CPU activity just before notepad launched and I noticed that WerFault.exe and wermgr.exe both started getting busy. Correlation is not causation, but it sure is suspicious.
Note that WER stands for Windows Error Reporting – the system that sends crash dumps back to Microsoft for analysis so that software reliability can be improved
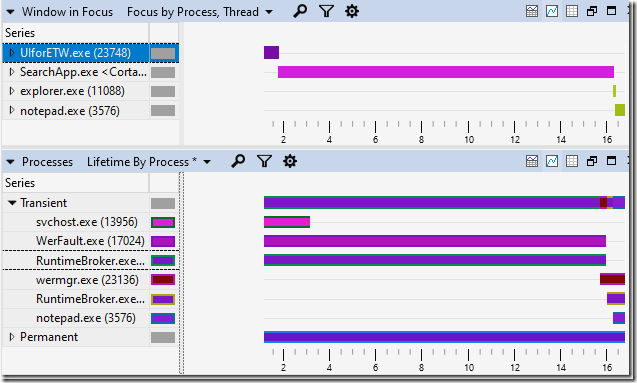
Looking at the Processes table showed me that the command line for WerFault.exe was “C:\WINDOWS\system32\WerFault.exe -u -p 17804 -s 2124”. That suggests that Windows Error Reporting was being asked to record information for crashed process 17804, and when I looked in the Processes table for that Process ID (PID) I found “RuntimeBroker.exe <Microsoft.Windows.Search> (17804)”. Well now. Doesn’t that name look relevant?
A look at all of the “Transient” processes (those that started or ended during the trace timeline) was quite revealing:
WerFault.exe and RuntimeBroker.exe (17804) (the top of the two RuntimeBroker.exe processes) were both running when I started recording the trace and both ended at about the same time, and WerFault.exe was handling a crash in RuntimeBroker.exe. Notice also that a new copy of RuntimeBroker.exe starts running when the old copy goes away. Now we’re starting to have an explanation:
- RuntimeBroker.exe crashes
- WerFault.exe deals with the crash, keeping the RuntimeBroker.exe process open
- Then a new RuntimeBroker.exe launches and provides whatever it is that SearchApp.exe needed
Now we have a new question: why is WerFault.exe sitting idle for so long?
I looked at the CPU Usage (Precise) data and saw that WerFault.exe has at least thirteen threads, none of them named (come on Microsoft – thread names are really helpful!) but the main thread was easily identifiable as the one using the most CPU time. I then sorted by Time Since Last and noticed that at one point the main thread had been waiting to run for 15.572 s. In fact it was probably waiting even longer, but the start of its wait was before the start of the trace and therefore unknowable. You can find more details on how to do idle-analysis here.
The stack where the main WerFault.exe thread was waiting for 15.572 s is shown below:
The summary would be that it was waiting in UploadReport.
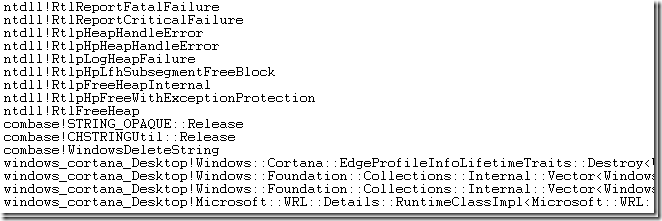
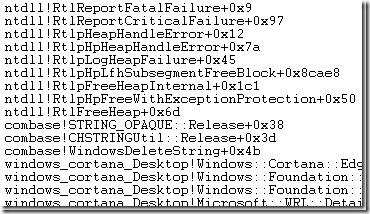 So now we understand the problem. RuntimeBroker.exe crashed (due to heap corruption, according to the call stack in the RuntimeBroker.exe crash dump, shown to the right) and it took more than 15 seconds to upload the crash dump, presumably due to my flaky hotel WiFi. During this time my start menu was inoperable.
This deserves reiterating. My start menu was hung due to the combination of heap corruption and WerFault.exe deciding that it needed to upload the crash dump before releasing the old process so that a new one could be started.
It took two bugs (the heap corruption and the upload-before-restarting) to make this hang happen, but happen it did.
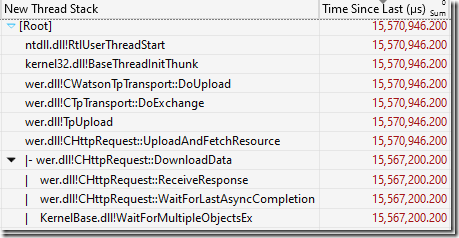 We can even go deeper. The UploadReport function was blocked for 15.567 s and the Readying Process/Readying Thread Id shows us who ultimately unblocked the function. That turned out to be another WerFault.exe thread which was blocked in some CHttpRequest functions, as show above. That doesn’t add significantly to the understanding of the problem, but does demonstrate nicely how you can trace a hang backwards through multiple processes and threads.
Watching for this problem
In general if you want to understand why your computer is performing badly you need to record and analyze a trace. However if you want to see if you are hitting this particular problem then there are easier steps that you can follow.
The first step is to configure the local recording of crash dumps. This is a good idea in general because it lets you monitor the stability of your computer over your time.
Then, with crash dumps being recorded if you see a Start Menu hang you can just look in %localappdata%\crashdumps and see if there is a recent RuntimeBroker.exe crash. If so then you are presumably seeing this bug.
Waiting on upload
Raymond Chen gives several reasons for why Windows Error Reporting doesn’t restart crashed processes before uploading the report (circa 2012) but I don’t find those reasons entirely compelling, especially in the start-menu case. As long as you kill the old process before starting the new one – and answer the DLL-version questions from a crash dump – most of the problems he points out are avoidable. Exponential backoff on process restarts can address the rest. And, the consequences of waiting can, as we have seen, be arbitrarily long start-menu hangs, with no indication that a crash is the problem. There is also some confusion about the behavior – maybe the design has changed in the last ten years.
Fixing the crash
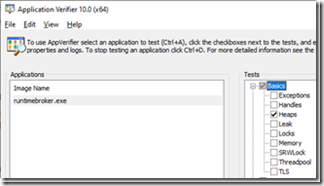 Heap corruption bugs can be extremely difficult to find and fix, but this one seems like it might be easy. I turned on pageheap on RuntimeBroker.exe, killed the relevant version to get it to restart and apply the pageheap settings and it started crashing every time I opened the start menu. I configured WER to save full crash dumps and soon had a half-dozen crash dumps with full details of what was happening.
The crashes normally happen on this call stack:
With pageheap enabled the crash happens on a very similar call stack, but slightly earlier. The crash happens earlier (and more reliably) because with page heap when you free memory it is unmapped, so dereferencing it reliably causes a crash, instead of reading from the freed memory:
The crash happens when dereferencing [rcx] so I ran its value through the the !heap command (see my pageheap blogpost for details) and got this call stack:
The only complication is that this doesn’t happen on all Windows 10 machines. There seems to be some required state that makes it happen or not and I don’t know what is. I will say that I’m happy to share the crash dumps with anyone at Microsoft who wants to investigate.
I don’t know the code and don’t understand what is happening but I’ve dealt with enough use-after-free bugs to say that this is probably straightforward to investigate and fix using the crash dumps. Although, I got a couple of different crash call stacks so there might be multiple bugs.
Conclusions
I ended my initial twitter thread by saying that these hangs were making me cranky and had me wondering if Windows 10 was abandonware. Since then I’ve been told that people seem to be seeing start-menu hangs on Windows 11, but that is not necessarily the same problem.
To be clear, Microsoft has the technology to record traces on start menu hangs on customer machines. These traces would show roughly the same thing as my trace. They also receive crash dumps from customer machines. They might even have a way of correlating them (if not then they should hook that up). And they created pageheap which makes use-after-free crashes easy to investigate.
So, why hasn’t this been addressed? On my laptop I see that RuntimeBroker.exe has crashed, on average, every second day this year. That is too many start-menu hangs for my tastes. I don’t know how long it has been happening so maybe a fix is on the way – if so that would be great to hear. If not then I will continue to be cranky and I hope that this serves as a good reminder of the importance of using all that fancy telemetry to address issues like this.
Or, maybe I’m just unlucky and I’m one of the few people (not the only person) who is hitting this crash.
In short, I am really pleased with the tools that Microsoft has created and released to let me analyze performance issues such as these. However I wish that I didn’t have to use them so often on Windows itself.




Funny – after reading I went to check my CrashDumps folder and I had 10 RuntimeBroker.exe dmp files with roughly the same call stack and all starting on 1/14 2023 with the most recent one from today at 11:06 PM (1/17 2023)
That’s a pretty high crash rate. The reason you only have ten is because that is the default maximum that WER retains locally. Windows 10?
Crashdumps shows RuntimBroker.exe.dmp from 2 days ago & 8 days ago. Always helps the crankyness to better understand the issue so kudos!
Microsoft has a huge problem with anything related to search. Windows Search is unusable, but I’ve counted on the ability to quickly launch apps via win+r… for nothing. It’s hard to believe that a quick text search is so hard and one need to use Everything or some 3rd party launchers.
I have just-in-time debugger enabled on my main machine. I don’t like when something is crashing in the background without my knowledge. I would rather fix or disable offending party.
That said I’ve seen this RuntimeBroker.exe crash, but only few times, definitely nothing reproducible enough to care about. I’ve seen also WindowsSearch.exe crash some time ago, but this doesn’t happened anymore.
Nice writeup, always getting to the bottom of things 🙂
Thank you for looking at this!
I use Win-Key+typing in GNOME on Linux to launch everything, but I’ve always found this really painful on windows for some reason – I can’t pin it down but it feels very janky.
I had similar issues. Windows search also does too much phoning home in my opinion.
My solutions was to use their Power Toys version of Run. It’s much faster and more configurable.
I’ve observed similar crashes on Win11, where, after some VPN/ISP issues, dns requests were timeouting (& whole internet was not working on that machine for ~60sec) – that also caused start menu to be unusable, because apparently searching the web first is more important for their business, than just showing “cmd” as App to the user, and as result it showed nothing at all.
No idea was it related to the issue You found, as I didn’t check the dumps (it was 3-4 weeks back), and since that was my first contact with Win11, it certainly did increase my inner hate toward “MS/new UI fancy things/breaking basic stuff with pointless features I will not use”.
Thanks Bruce for being vocal about it, You’re the hero we don’t deserve!
I’d love to see if the Windows 11 crash dumps show the same issue, so do share if you still have any
I had some of the same issues – just with start menu being too slow. I disabled web search for start menu, and it works, is fast, only finds apps (and other local stuff; documents, folder, settings – but only when you navigate to that specified search target).
Bottomline – turning off web search in start menu = speed
regedit/use at own discretion:
HKCU\Software\Policies\Microsoft\Windows\Explorer
“DisableSearchBoxSuggestions”=dword:00000001
Just here to say thanks for the tip.
Hey Bruce!
I just became aware of this post. I’ll check the trace to see if there’s anything unexpected with regard to the WER behavior, but in general, as Raymond noted, we hold the crashing process during our initial exchange with Watson to see if there are any additional (secondary) requests for data that need the original process still alive to satisfy. That initial exchange has a timeout value of 15 seconds for HTTP connect and two minutes for HTTP response. For certain processes (e.g., the shell proper, DWM) we have a much smaller timeout, as we know those processes are crucial to user responsiveness. This case is interesting because it’s a RunTimeBroker.exe processes servicing the shell. We’ll look into this to see if we can detect and improve that case.
Ordinarily, once that initial exchange with Watson is complete, we release the crashing process and dump from the cloned process. One exception to that is when the user has configured local dumps. 🙂
Wait – so configuring local dumps might be making the hang worse? I don’t understand the logic behind that.
For small-ish processes it would be more efficient to do a full memory dump and then satisfy _all_ questions from that, rather than making the user wait. At least in this case. I know, it’s complicated.
What about the crash, however? I haven’t heard anything back on whether this crash was known, is fixed, will be fixed, etc. I’m hopeful that nobody has asked for my crash dumps because the bug is already fixed, but nobody has actually said that.
And, I think I saw at least two different crash call stacks when I enabled pageheap, so I suspect that there are actually two bugs.
Thanks for the information. Let me know if you need anything more information.
I shall now ask for your crash dumps. 🙂 Will send you an email.
Thanks for researching that, Bruce. It’s been quite a while since my start menu was that bad (or even non-functional). I landed on Keypirinha as my configurable third-party launcher of choice and it provides a much better experience for most things. Once in a while I’ll want some control panel (Settings) page that it refuses to find and I go back to the start menu for that. But having it index things like RDP machine names and Putty sessions saves time.
I had also long start menu popup times because I had once connected with an business account. Since then every start menu popup would check if my machine is part of an Active Directory. It kept trying until I deleted the cached credentials.
Could I get your ETW Trace to check if ETWAnalyzer could help to make similar analysis easier?
ETWAnalyzer -extract All -fd xxx.etl -symserver MS
cd Extract
ETWAnalyzer -dump process -crash -timefmt s
ETWAnalyzer -dump CPU -processName WerFault;RuntimeBroker -methods * -MinMaxWaitMs 1000 -FirstLastDuration s s
That should give you good insights. It also supports to resolve symbols from Json files which are much smaller and quicker to transfer (https://github.com/Siemens-Healthineers/ETWAnalyzer/releases/tag/2.5.4.0)
The trace is available here:
https://drive.google.com/file/d/16x2xRKKiYTA2JaEO60dTUUILfK0-p3Sc/view
I’d be interested to see what ETWAnalyzer says about it.
EtwAnalyzer -extract all -fd “D:\Media\Blog\BruceDawsonStartMenuHang\2023-01-12_07-58-22 slow start menu.etl” -allcpu -SymbolServer ms
Since not much CPU is used I extract all CPU with -allCPU which extracts data also for methods with etwanalyzer %f% -dump process -crash
12.01.2023 15:58:01 2023-01-12_07-58-22 slow start menu
PID: 17024 Start: Stop: 2023-01-12 07:58:17.585 Duration: RCode: 0 Parent: 17804 WerFault.exe -u -p 17804 -s 2124
PID: 17804 Start: Stop: 2023-01-12 07:58:17.596 Duration: RCode: HEAP_CORRUPTION Parent: 1152 RuntimeBroker.exe -Embedding
which shows Heap corruption right there.
The HTTP upload is more tricky since it is async. The last seen time would be relevant here
D:\>etwanalyzer %f% -dump cpu -pn wermgr;runtimebroker -methods *upload* -fld s s
CPU ms Wait ms Ready ms Last-First First(s) Last(s) Method
12.01.2023 15:58:01 2023-01-12_07-58-22 slow start menu
wermgr.exe(23136) + -upload
1 ms 0 ms 0 ms 0,000 s 16.803 16.803 CHttpRequest::UploadData
9 ms 934 ms 0 ms 0,945 s 15.858 16.803 TpUpload
9 ms 934 ms 0 ms 0,945 s 15.858 16.803 CHttpRequest::UploadAndFetchResource
10 ms 46 ms 0 ms 0,057 s 15.784 15.841 CReportManager::UploadReport
24 ms 934 ms 1 ms 0,962 s 15.841 16.803 CWatsonTpTransport::DoUpload
60 ms 56 ms 2 ms 0,126 s 15.715 15.841 DoCoreUpload
When you know that RuntimeBrokder with PID 17804 did crash you can query for the methods just before the wer method was called
This uses -zt (ZeroTime) feature to dump the last seen methods 1s before WerpWaitForCrashReporting was called of the crashed process. That can be handy to see what did happen:
D:\>EtwAnalyzer %f% -dump CPU -pn 17804 -methods * -zt Last WerpWaitForCrashReporting -fld s s -MinMaxLast -1 0 -SortBy Last -TopNMethods 40
CPU ms Wait ms Ready ms Last-First First(s*) Last(s*) Method
12.01.2023 15:58:01 2023-01-12_07-58-22 slow start menu
RuntimeBroker.exe(17804) – -Embedding
5 ms 187 ms 0 ms 0,013 s -0.013 -0.000 ThreadInvokeWorker
5 ms 187 ms 0 ms 0,013 s -0.013 -0.000 RPC_INTERFACE::DispatchToStubWithObject
5 ms 187 ms 0 ms 0,013 s -0.013 -0.000 DispatchToStubInCNoAvrf
5 ms 187 ms 0 ms 0,013 s -0.013 -0.000 RPC_INTERFACE::DispatchToStubWorker
1 ms 185 ms 0 ms 0,013 s -0.013 -0.000 RtlFreeHeap
0 ms 185 ms 0 ms 0,013 s -0.013 -0.000 Windows::Foundation::Collections::Internal::SimpleVectorView<Windows::Cortana::EdgeProfileInfo,Windows::Foundation::Collections::Internal::Vector<Windows::Cortana::EdgeProfileInfo,Windows::Cortana::EdgeProfileInfoEqualPredicate,Windows::Cortana::EdgeProfileInfoLifetimeTraits,Windows::Foundation::Collections::Internal::VectorOptions >,Windows::Cortana::EdgeProfileInfoLifetimeTraits,XWinRT::IntVersionTag,1>::`scalar deleting destructor’
0 ms 185 ms 0 ms 0,013 s -0.013 -0.000 Microsoft::WRL::Details::RuntimeClassImpl<Microsoft::WRL::RuntimeClassFlags,1,1,0,Windows::Foundation::Collections::IVectorView,Windows::Foundation::Collections::IIterable,Microsoft::WRL::FtmBase>::Release
0 ms 185 ms 0 ms 0,013 s -0.013 -0.000 ::operator
0 ms 185 ms 0 ms 0,013 s -0.013 -0.000 ObjectMethodExceptionHandlingAction< >
0 ms 185 ms 0 ms 0,013 s -0.013 -0.000 CStdIdentity::ReleaseCtrlUnk
0 ms 185 ms 0 ms 0,013 s -0.013 -0.000 CStdMarshal::DisconnectWorker_ReleasesLock
0 ms 185 ms 0 ms 0,013 s -0.013 -0.000 CStdMarshal::Disconnect
0 ms 185 ms 0 ms 0,013 s -0.013 -0.000 CRemoteUnknown::RemReleaseWorker
0 ms 185 ms 0 ms 0,013 s -0.013 -0.000 Microsoft::WRL::Details::RuntimeClassImpl<Microsoft::WRL::RuntimeClassFlags,1,1,0,Windows::Foundation::Collections::IVector,Windows::Foundation::Collections::IIterable,Microsoft::WRL::FtmBase>::Release
0 ms 185 ms 0 ms 0,013 s -0.013 -0.000 Windows::Foundation::Collections::Internal::Vector<Windows::Cortana::EdgeProfileInfo,Windows::Cortana::EdgeProfileInfoEqualPredicate,Windows::Cortana::EdgeProfileInfoLifetimeTraits,Windows::Foundation::Collections::Internal::VectorOptions >::`scalar deleting destructor’
0 ms 185 ms 0 ms 0,013 s -0.013 -0.000 Windows::Cortana::EdgeProfileInfoLifetimeTraits::Destroy
0 ms 188 ms 0 ms 0,013 s -0.013 -0.000 ZwWaitForMultipleObjects
0 ms 185 ms 0 ms 0,013 s -0.013 -0.000 WerpWaitForCrashReporting
0 ms 185 ms 0 ms 0,013 s -0.013 -0.000 RtlReportExceptionHelper
0 ms 185 ms 0 ms 0,013 s -0.013 -0.000 RtlReportException
0 ms 185 ms 0 ms 0,013 s -0.013 -0.000 RtlReportFatalFailure$filt$0
0 ms 185 ms 0 ms 0,013 s -0.013 -0.000 __C_specific_handler
0 ms 185 ms 0 ms 0,013 s -0.013 -0.000 RtlpExecuteHandlerForException
That’s interesting that the process return code is in the trace – I didn’t know that.
Getting RuntimeBroker CPU activity before it crashed will work poorly because it crashed before the trace recording started. That said, you did seem to catch something interesting. Is that from context switches or sampling? It’s a bit hard to read – it feels like some stack entries need some template goop elided for better readability. Plus, I’m not sure what the time-stamp/function-name lines actually mean. It looks like a call stack, but why is the (mostly unchanging) time listed on each line?
Interesting stuff
The process event contains Return Code and User SID which both can be shown by ETWAnalyzer. When you extract on the same machine the SID is converted to the actual user account name. With -dump process -showUser you get also the user name, or the SID remains if it cannot be converted. When a process crashes the NTSTATUS code which can be an exception is converted to the string representation if possible. That can give interesting insights like Ctrl-C aborted processes as well.
The displayed CPU data contains the method inclusive times from Context Switch (wait and ready time) and the CPU time from CPU sampling data (if available). The data is summed across all threads for each process. Since it sums the costs for all threads the wait and ready times would be for many threads very high and not useful. Instead the non overlapping thread times are counted for wait and ready times. Stacktags on the other hand still contain the plain sum.
You can get something similar like a stacktrace with -sortby stackdepth, because for each method the average stack depth (executing method starts at depth zero, parent is 1, …) is used to print CPU hotspots deepest in the stack. Since it is a sum across all threads I use the stack depth with some CPU*exp(-Depth) attenuation factor to be able to sort by method costs which for true CPU hotspots looks like the actual stacktrace without the huge space overhead to store all stacktraces.
This is all documented at https://github.com/Siemens-Healthineers/ETWAnalyzer/tree/main/ETWAnalyzer/Documentation
https://github.com/Siemens-Healthineers/ETWAnalyzer/blob/main/ETWAnalyzer/Documentation/DumpCPUCommand.md
https://github.com/Siemens-Healthineers/ETWAnalyzer/blob/main/ETWAnalyzer/Documentation/DumpProcessCommand.md
and in greater detail at my blog. The aggregation approach is described here:
Why don’t you use Everything Toolbar 1.0 ?
https://github.com/stnkl/EverythingToolbar/releases/latest
I could use some third-party software instead of the start menu, but I think this question misses the point which is that the start menu should work well. Windows has a billion or so users and they deserve a start menu that works without having to find and install custom code.
I was having this issue with Win 11, but it seems that the latest cumulative preview update has fixed it.
Never mind, the problem is still there.
Hey Bruce,
May you share your captured ETL trace you analyzed in this post?
sorry, see you have shared the drive here https://drive.google.com/file/d/16x2xRKKiYTA2JaEO60dTUUILfK0-p3Sc/view?usp=share_link
I use windows 7 but if I used 10, I would open the Windows Error Reporting binary and just NOP out that UploadReport function. As usual, finding out what causes the problem is 99% of the effort…
You can disable the customer experience improvement program which will disable uploading of crash dumps. However since that prevents Microsoft from seeing your crashes it also means that Microsoft will have less reason to fix the crashes that you are seeing – you will be counting on others to report those crashes.
Note that Windows 7 also has WER built in. And, of course, Windows 7 is now unsupported and insecure. Be careful.