Last week I wrote about the performance consequences of inadvertently loading gdi32.dll into processes that are created and destroyed at very high rates. This week I want to share some techniques for digging deeper into this behavior, and the odd things that I found when trying to use them.
When I first wrote UIforETW I noticed that an inordinate amount of the size of the traces it recorded was coming from the Microsoft-Windows-Win32k provider. This provider records useful information about UI hangs and which window is active, but some less useful events were filling the trace buffers and crowding out the interesting ones. The most verbose events were the ExclusiveUserCrit, ReleaseUserCrit, and SharedUserCrit events and they were routinely generating 75% of the Microsoft-Windows-Win32k event traffic. So I stopped recording those events and forgot about them until quite recently. And that’s funny because those events record exactly the information that is needed for investigating all of these UI hangs – theoretically.
In practice the results from looking at these events are… mixed.
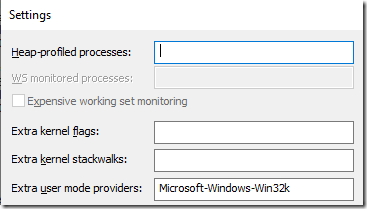 Once I remembered the existence of these events I added Microsoft-Windows-Win32k to the extra user mode providers in the UIforETW Settings dialog, with no flags-filter specified so that all of the UserCrit events would be captured. I then recorded an ETW trace of ProcessCreateTests running with and without the -user32 option, on my four-core/eight-thread laptop.
Odd evidence in the new trace
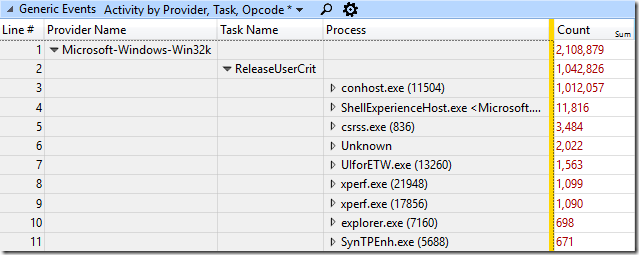
The first thing I noticed was that the global UserCrit (user32.dll critical section) lock was really hot. Check out the count of ReleaseUserCrit events by process from the two runs of ProcessCreateTests:
The conhost.exe process acquired and released it over 500,000 times per test! It did most of this activity during the process creation phase and usually held the lock for a very brief time so that no hangs were observed. But, acquiring a critical system lock a few hundred thousand times per second seems dangerous at best.
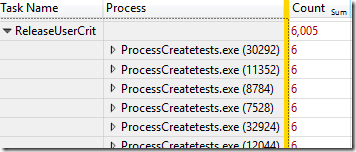 When CreateProcessTests was launched normally the lock was never touched by the child processes, but, in the -user32 case the lock was acquired six times per process during the process creation phase. This is the first sign of the performance problems that will happen during process destruction.
Unpossible!
At first the tracing data seemed to show that the UserCrit was never acquired by the test child processes during process destruction. That was quite surprising considering that the UserCrit was the reason for the hangs. 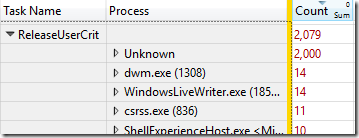 It turns out that the UserCrit activity during shutdown of my test processes was entirely attributed to the Unknown process. This seems like an odd ETW tracing defect, which certainly complicated this analysis. Once I understood what was going on (confirmed by matching thread IDs) I could see that the UserCrit is acquired twice per CreateProcessTests child process during process destruction.
Lock acquire counts do not correlate
At this point I could see the problematic UserCrit lock was acquired over 500,000 times during process creation and only 6,000 times during process destruction, and yet, the only time that hangs are observed is during process destruction. So I continued down the rabbit hole…
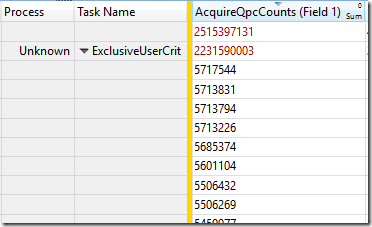 Lock contention is a factor both of how often a lock is acquired, and how long it is held. The ExclusiveUserCrit and SharedUserCrit events (acquiring the lock) and the ReleaseUserCrit event have fields labeled AcquireQpcCounts and HoldQPCCounts which appear to record how long the thread waited to acquire the lock, and then how long it held the lock. The time is presumably measured in QueryPerformanceCounter units, and thank you to the anonymous Microsoft developer who labeled these fields clearly. My QPC clock runs at 10 MHz (odd…) so each unit represents 0.1 microseconds.
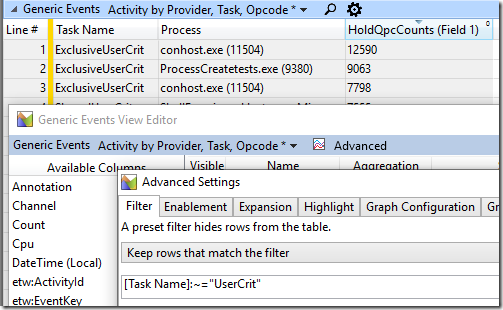
I wanted to be able to easily summarize this data by process name and event type (and I hadn’t found the process-name column) so I made a custom profile for the GenericEvents data which applied a filter so that only events with a Task Name containing UserCrit would be displayed:
Then I used that together with wpaexporter to export the UserCrit data from specific time ranges to a .csv file for analysis:
wpaexporter -i “2018-11-30_08-02-17 usercrit processcreatetests.etl” -range 4.4s 6.7s -profile UserCritEvents.wpaProfile
I then used a crude Python script to summarize the data for the processes of interest (and totals for all processes in the system) and got these results for the two segments of the run with -user32 specified. “Held time” is how long ReleaseUserCrit says the lock was held for, and “Wait time” is how long ExclusiveUserCrit and SharedUserCrit say the thread waited before it could acquire the lock:
Process creation (~2.0 s duration):
Process ProcessCreatetests.exe:
Held time: 0.151 s, 6110 events
Wait time: 0.359 s, 6110 events
Process conhost.exe:
Held time: 0.388 s, 505516 events
Wait time: 0.533 s, 505516 events
Totals from all processes:
Held time: 0.597 s, 517946 events
Wait time: 1.370 s, 517946 events
Process destruction (2.3 s duration):
Process ProcessCreatetests.exe:
Held time: 0.000 s, 33 events
Wait time: 1.689 s, 33 events
Process Unknown (aka ProcessCreateTests.exe):
Held time: 0.115 s, 2004 events
Wait time: 223.160 s, 2004 events
Process conhost.exe:
Held time: 0.021 s, 1262 events
Wait time: 1.289 s, 1262 events
Totals from all processes:
Held time: 0.172 s, 5938 events
Wait time: 251.664 s, 5938 events
So, according to these ETW events the UserCrit was held about 30% of the time during process creation (no hangs observed, ever) and about 7.5% of the time during process destruction (lots of hangs observed, always). Put another way, the “Wait time” total of 251 s over a 2.3 s period implies that on average there were over a hundred threads waiting to acquire the lock, but the “Held time” of 0.172 s implies that there was rarely anybody stopping them from acquiring the lock. Well that doesn’t make sense.
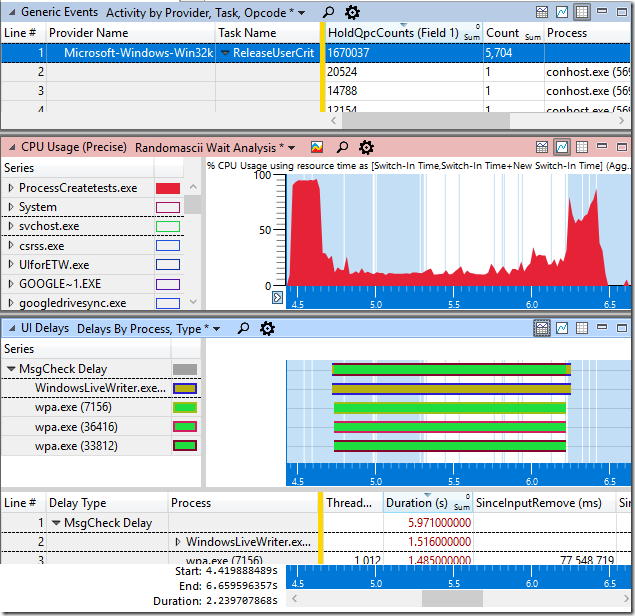
This WPA screenshot gives us another view that shows that something is fishy. The trace is zoomed in on the process destruction phase and the ReleaseUserCrit events are selected so that all of the times the UserCrit is released are highlighted as vertical blue lines, and we can clearly see large segments where the lock is not released for long periods of time. And yet, despite that lack of activity (and no sign of the lock ever being held for long) we can see that multiple processes were hung (MsgCheck Delay) for about 1.5 seconds, and analysis shows that they were hung because they couldn’t grab the UserCrit lock.
We can also see that the ReleaseUserCrit events, sorted by HoldQpcCounts, imply that the longest duration the UserCrit was ever held for was just 20,524 QPC intervals, or 2.05 ms. And yet, we can see that there is a period of over 200 ms where there are no ReleaseUserCrit events, and yet no other applications can get the lock.
Finally, the top line of the HoldQpcCounts column shows a sum of 1,670,037 units, or just 167 ms, over the 2.239 s period shown.
This makes no sense
We have one piece of evidence (the Microsoft-Windows-Win32k events) saying that the UserCrit is available more than 90% of the time during process destruction, and other pieces of evidence (the MsgCheckDelay) events saying it isn’t. Given that I can see the mouse hangs with my own eyes I know which I believe, but what is going on? Unfortunately I can’t tell.
Either the ReleaseUserCrit events are incorrectly recording how long the lock was held, or some ReleaseUserCrit events are not being emitted at all. Or perhaps some events are being emitted but then somehow lost – perhaps due tracing problems during process destruction. Given the number of context switches occurring on call stacks that look like they are related to the UserCrit I think that that some UserCrit events are being missed, for some reason.
For whatever reason, the UserCrit events appear to be unreliable and thus mostly useless, whereas the GUIProcess events (which UIforETW records by default) do have some modest value.
Other observations
In addition to contention on the UserCrit the process destruction (and to some extent process creation) phase is sometimes serialized on a different lock/resource, presumably called the HmgrSemaphore. based on how much time is spent waiting on GreAcquireHmgrSemaphore. So, if the lock contention on the UserCrit is improved then the next serializing lock is already waiting in the wings – Microsoft really doesn’t want you to create a lot of processes.
While poking around I found that there are GUIThread and GUIProcess events that trigger during process creation and process destruction when gdi32.dll is loaded. These events are recorded by UIforETW by default so they serve as the simplest indicator of GUI/GDI processes being destroyed or created. If you see a lot of these events then that probably means you are having a bad day.
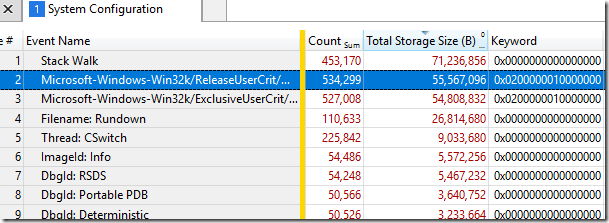
When I turned off filtering of Microsoft-Windows-Win32k events the ReleaseUserCrit and ExclusiveUserCrit showed up as the second and third biggest contributors to trace size, which nicely justifies my default behavior of filtering them. This isn’t entirely fair because ProcessCreateTests stresses these events so heavily, but it’s not totally unfair either.
Note that you can see the keyword mask which is what I used to disable the events years ago.
Mysteries and things for Microsoft to investigate
- First lie – why are all the UserCrit ETW events attributed to Unknown during process destruction?
- Second lie -why are so many UserCrit events apparently missing? Is this perhaps related to the previous question?
Why doesn’t the Generic Events table have an option to group by Process Name, unlike most other tables. I really needed that option to let me investigate the 1,001 ProcessCreateTests processes– as was pointed out in a comment, it does. You have to go to the View Editor to find it, but it is there- Why is QueryPerformanceCounter running at 10 MHz on my Lenovo P51 laptop? That means that it isn’t using rdtsc directly which means that it is ~25x more expensive, and less precise.
- Is this the last question in this blog post?
Lock contention posts
I’ve been writing about locks lately. I’ve fought with the UserCrit enough to have written one, two, three times before this about the hangs it causes. I also fought with the lock that protects VirtualAlloc – a story in two parts.
References
- Original post was A Not-Called Function Can Cause a 5X Slowdown
- ProcessCreateTests.exe, SummarizeUserCrit.py, UserCritEvents.wpaProfile, and export.bat can all be found here
- The ETW trace of ProcessCreateTests -user32 referenced by export. bat is here
- You can find out more about UIforETW here
- The change that stopped UIforETW from recording UserCrit events is here
- You can for information about wpaexporter at Exporting Arbitrary Data from xperf ETL files
- When I’m not looking at ETW traces I’m trying to use forty different ways to commute to work
Hacker news discussion is here

Check if the UserCrit events come after the ProcessEnd events. The process end events are logged before the process is completely torn down, and any events that are logged after the end event (commonly heap events) get associated with the Unknown. And if WPA tried to guess which process they really should be associated with you’d have half a dozen more posts about lies and confusion on your hands, so it plays it safe and shows Unknown rather than a potential lie.
My copy of WPA (from the Microsoft Store), does have a Process Name column in Generic Events, in the View Editor. More useful than that, I find, is that you can select the Process column in the middle pane of the View Editor and then select in the right pane whether or not you want to see the Process Name, PID, or both (default). One adjustable column instead of multiple columns (and you can add the column to the table multiple times, of course).
By ProcessEnd events I assume you mean “Process: Terminate”? I found those and they do indeed come before the UserCrit events. However the kernel events (CPU Usage (Precise) for instance) continue to have process names and PIDs after “Process: Terminate”, so I guess it is only user-mode events that get assigned to unknown? That then makes me wonder why the kernel-mode events can be attributed to the correct process but not the user-mode events.
That also still leaves the greater mystery of why some UserCrit events seemed to be dropped completely. Them being tagged as Unknown was a brief roadblock, but some of them being (apparently) missing entirely renders them useless during process shutdown, which is generally the only time that I need them!
You are indeed correct that there is a Process Name column available – I forgot to look in the View Editor. I’ll update the post. That other trick looks useful also.
Whether or not an event is associated with a terminated process is unfortunately decided on a table-by-table basis in WPA. Generic Events requires that the event fall between the process start and end (terminate) events; CSwitch searches for the processes with the same PID in the past/future for the previous/next thread respectively. Presumably (read: this is just an educated guess) it does this because it’s common to get a context switch event for a process that is being created before the create event gets a chance to be logged (and the same for the last context switch when the process is finished being torn down).
Figuring out where your missing UserCrit events went is simply too complicated for a comment, sorry. If WPA isn’t warning you about lost events or buffers, and the missing events aren’t going to a circular buffering mode trace that’s overwriting them with new events (doesn’t look like it from your screenshots), then it’ll require an in-depth investigation. Maybe if you reach out to the WPA team with a simple repro they can convince the right people to take a look.
Okay, thanks for the feedback. I’ll consider doing that.
Re: 10 MHz, it’s probably because Hyper-V is enabled, possibly because your IT department enabled DeviceGuard or CredentialGuard which use Virtualization Based Security. The QPC MSDN page has a small comment noting it’s virtualized to 10 MHz.
Good theory although the 10 MHz is on my home laptop, so no IT department. I guess Hyper-V might still be enabled.
Hyper-V is off on my laptop, at least according to the “Turn Windows features on or off” GUI. But maybe my OS is running virtualized in… something.
Check msinfo32 for a line on the summary page saying whether or not a hypervisor has been detected (last line).
Good idea. I guess that’s a yes?
Installed Physical Memory (RAM) 32.0 GB
Total Physical Memory 31.8 GB
Available Physical Memory 16.9 GB
Total Virtual Memory 36.6 GB
Available Virtual Memory 17.6 GB
Page File Space 4.75 GB
Page File C:\pagefile.sys
Kernel DMA Protection Off
Virtualization-based security Not enabled
Device Encryption Support Elevation Required to View
Hyper-V – VM Monitor Mode Extensions Yes
Hyper-V – Second Level Address Translation Extensions Yes
Hyper-V – Virtualization Enabled in Firmware No
Hyper-V – Data Execution Protection Yes
That looks like a no. It looks like it’s listing the available features for Hyper-V, which according to my machine wouldn’t be displayed if Hyper-V were enabled.
Virtualization-based security Running
Virtualization-based security Required Security Properties
Virtualization-based security Available Security Properties Base Virtualization Support
Virtualization-based security Services Configured Hypervisor enforced Code Integrity
Virtualization-based security Services Running Hypervisor enforced Code Integrity
A hypervisor has been detected. Features required for Hyper-V will not be displayed.
Wouldn’t it be easier if you use Context Switch events to detect any blocking things? The Microsoft-Windows-Win32k provider makes little sense to me. I have tried several times to get useful things out of it when the UI was acting strangely but apart from red herings it was mostly a waste of time. When desktop composition issues happen the dwm traces are more useful although whithout beeing a DWM developer it is often not clear if the event ordering is correct or something got distorted along the way.
Context switch events are what I originally used to find the issues, and they worked, and they are reliable, and the UserCrit events are not. So I guess the answer is “yes”.
But, the UserCrit events *could* make the investigation so much easier. The context switch events are harder to interpret and required some leaps of faith because from them you can only infer what lock is being acquired and for how long.
But, ultimately, the UserCrit events are currently too unreliable.