Use the tool, Synthetics, for easy website health monitoring
New Relic is a company that offers many different tools, perhaps best known for its application performance monitoring (APM). At least that’s what I know it best for since we often use this tool when we do performance tests at Abstracta to get useful information about how our infrastructure behaves under tests. Besides the APM, it has another tool that I want to cover in this post, New Relic Synthetics, which you can use with a free or paid New Relic account. It’s useful for adding monitors for services or websites (anything accessible by an http URL) and setting up email notifications for when said monitors fail.
How to Set Up Your Monitor in New Relic Synthetics
After creating an account in New Relic, one has access to the different tools that it provides, in particular, we will look at how to get started with Synthetics. First, we must create a monitor, taking us to this page:
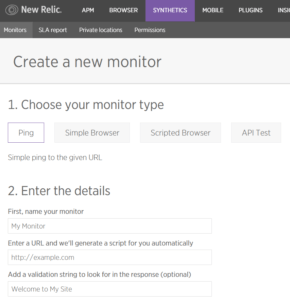
There are several different types of monitors available. For example, there is one called ping, which tries to access the given URL and makes a validation of some text in the response. You can also implement an automated test that is a little more complex, but for that one, you’ll need a paid account.
Here there is documentation from the New Relic site, but to create the monitor all you need to do is put a name, the URL for what you want to validate, and some text that you want to check that appears in the response page. You’ll also have to enter your email to receive notifications, the places in the world from where you want it to access your URL and how often. In the following image you can see one of the monitors that I have created recently:

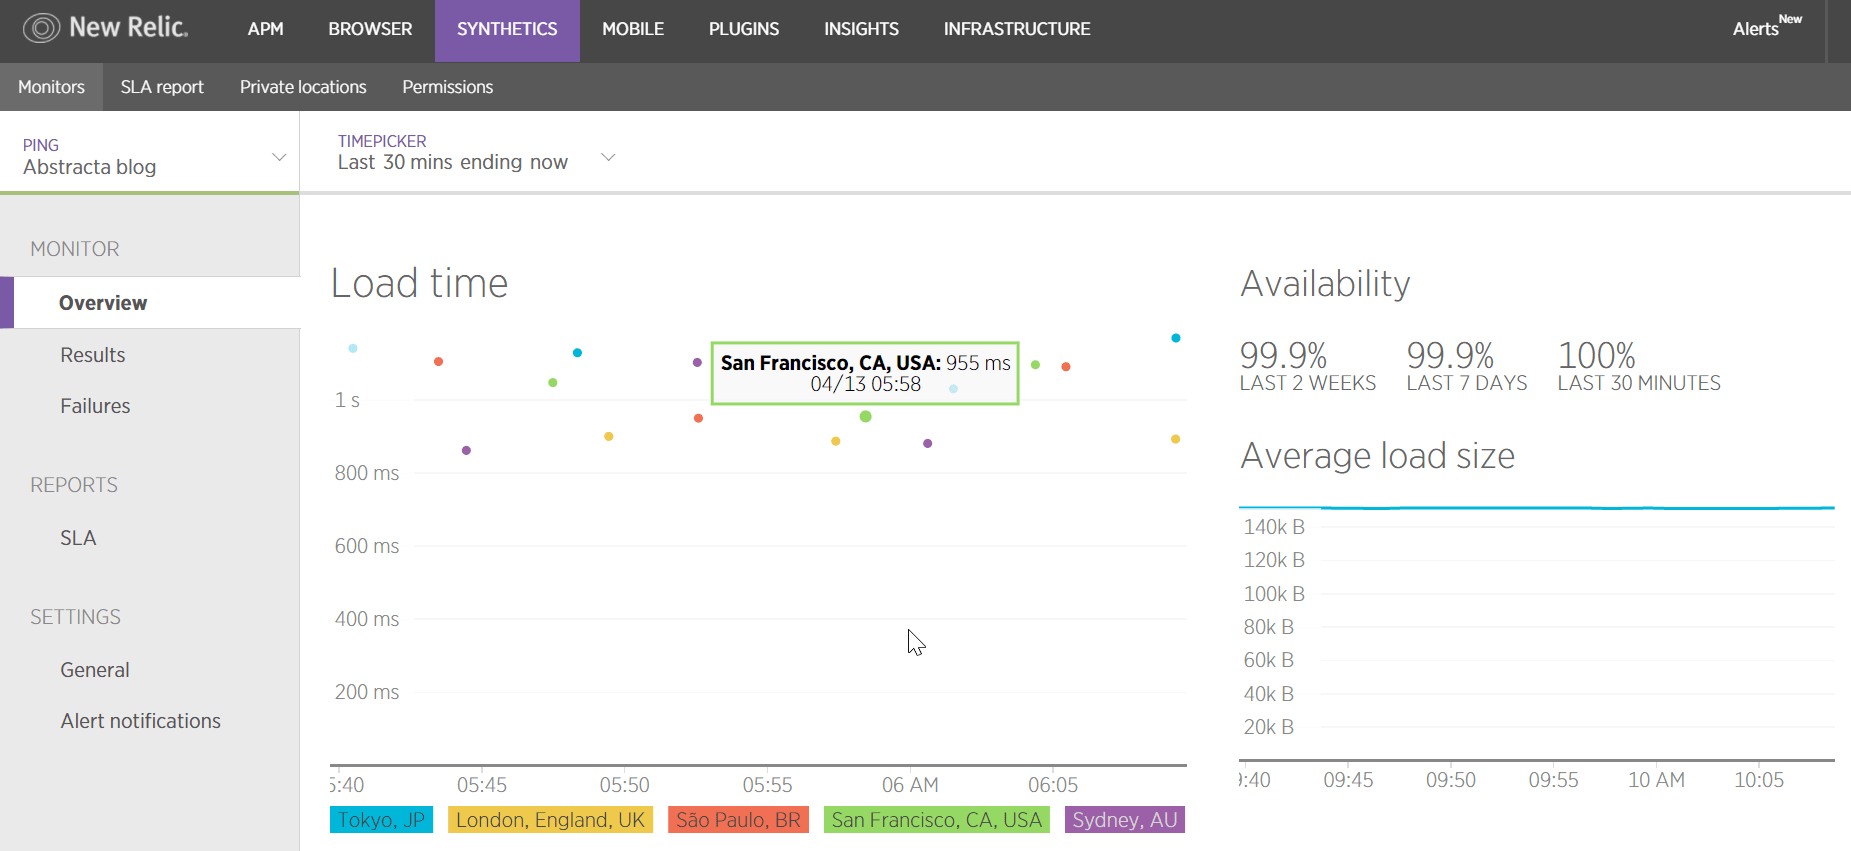
So, with this setup, I have it so that it will try to access the URL (this very blog) every 10 minutes, from 5 different places in the world, and if there is a failure, I’ll get a notification by email.
Benefits of New Relic Synthetics
Besides the email notifications, all results and response times are recorded, so I will be able to access historical information later (in the free version it is saved for a week), as shown in the following image:
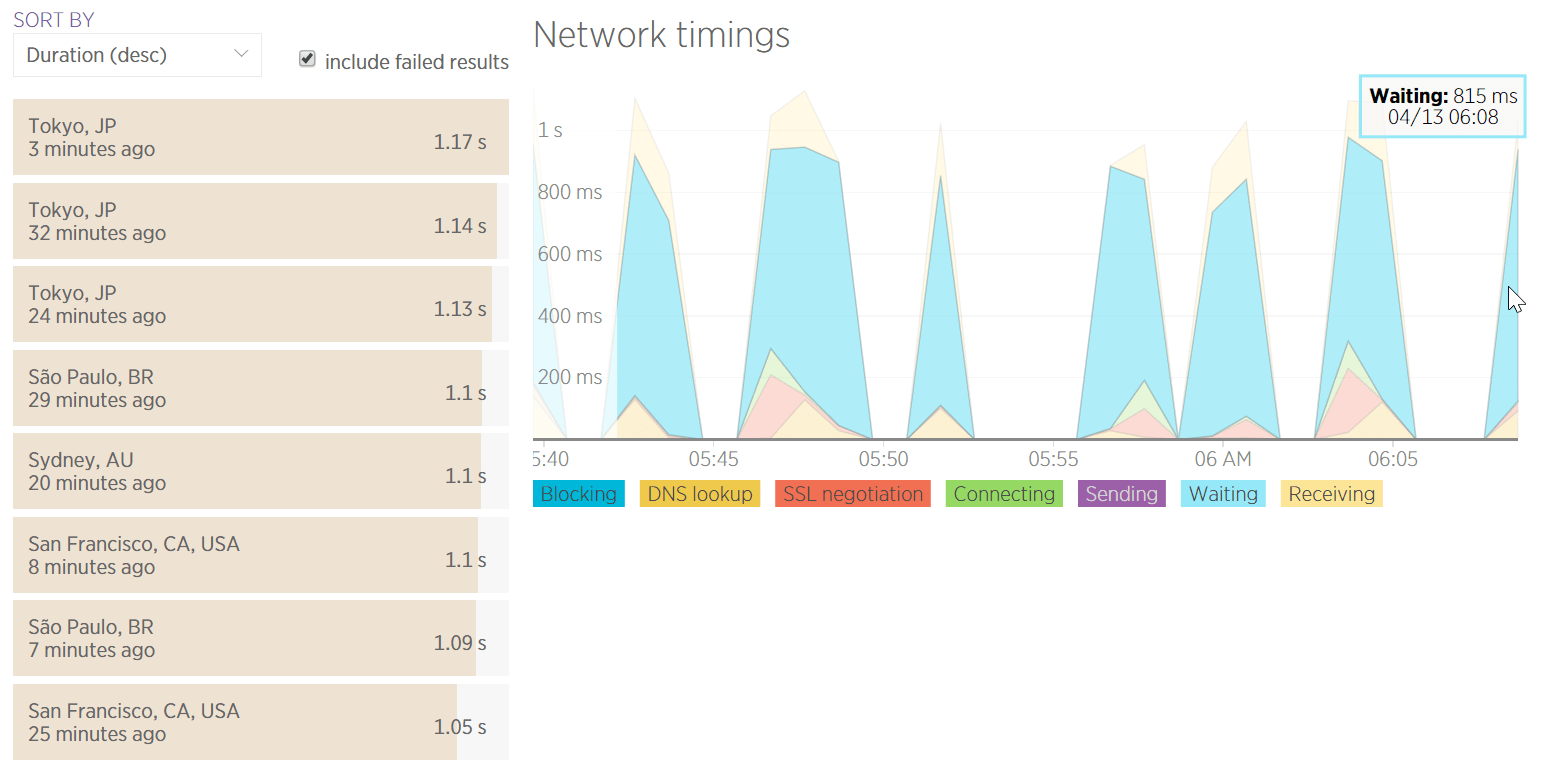
In addition, I have historical information about the failures, can list the worst response times by location in the world, and I can do a little deeper analysis of how the network behaves in each case:
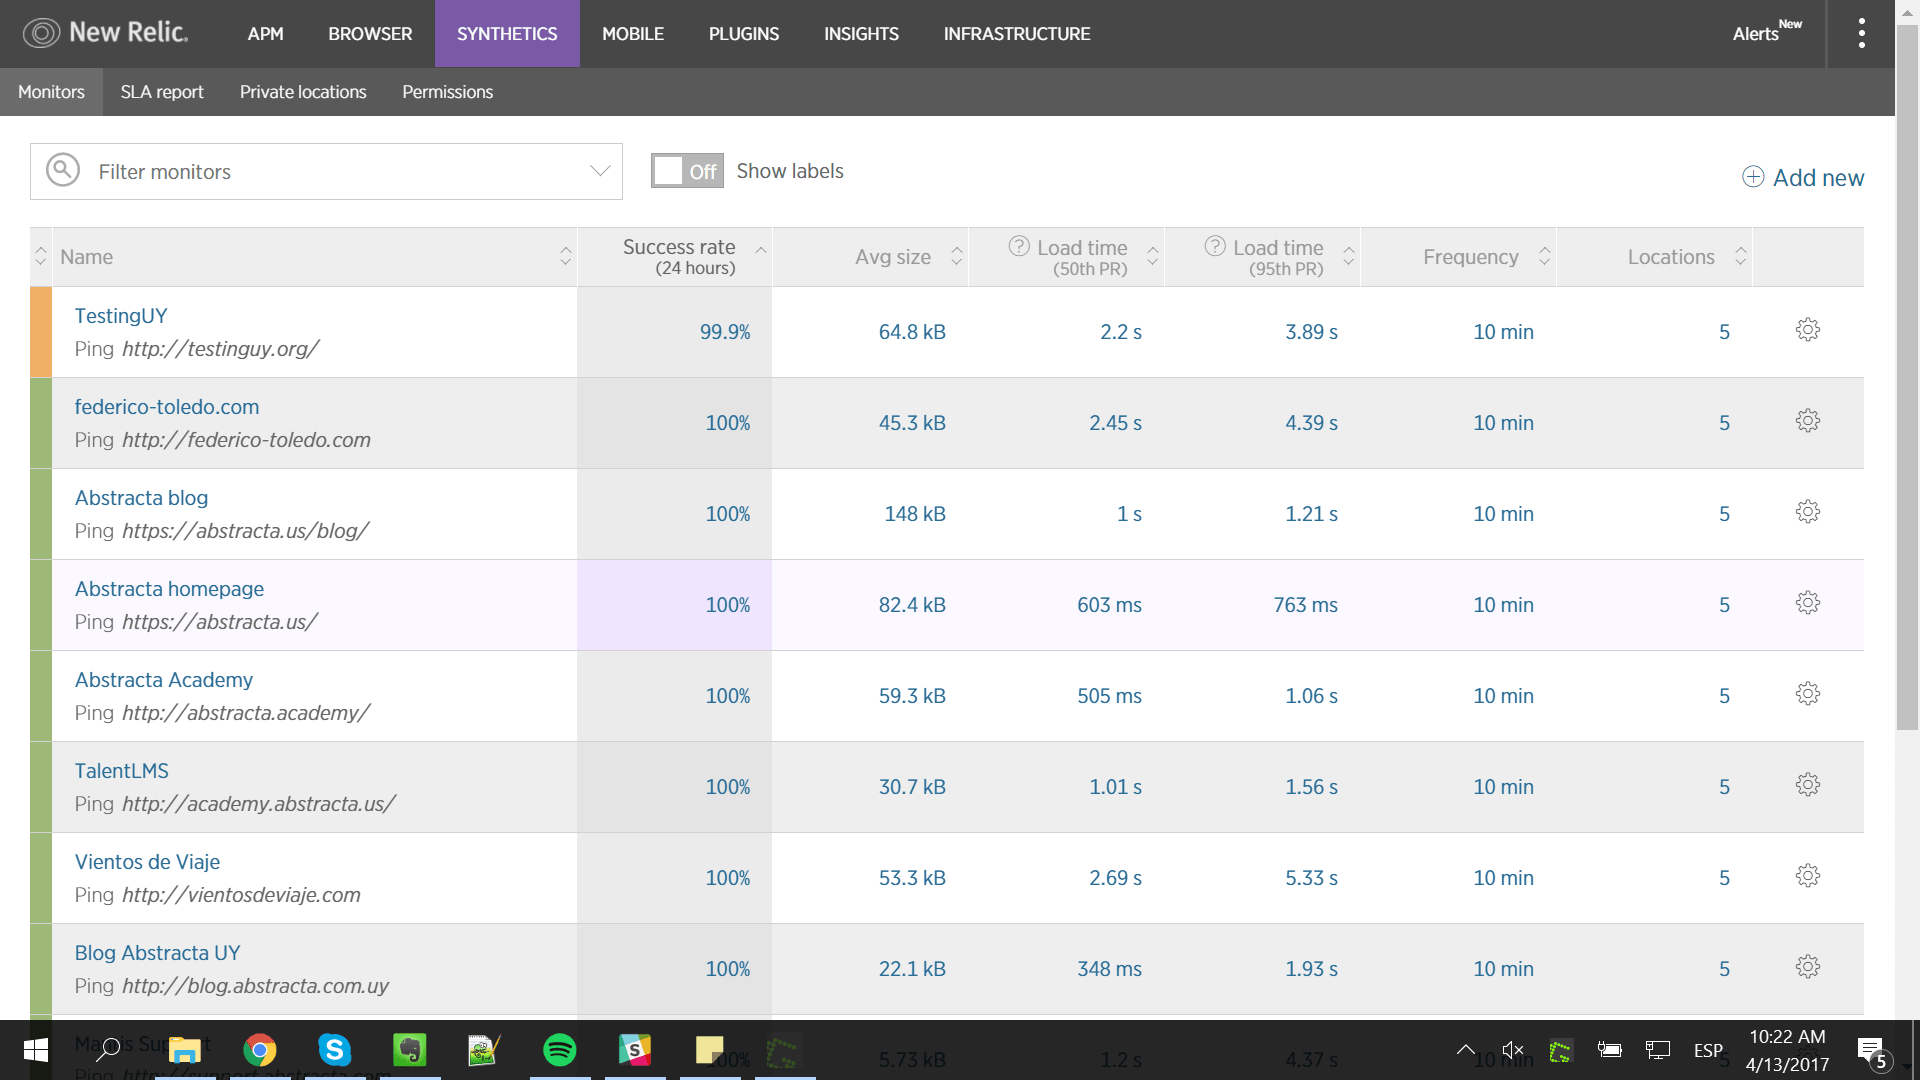
You can see the list of monitors and some relevant information from the home page of Synthetics:
When there is a problem somewhere that is of interest to me, I know that I will find out about it 10 minutes after it occurs, max! In addition, I have historical information on response times from different parts of the world. All this can be done for free, which is why I recommend anyone who is responsible for, or interested in the health of a particular service, to add these monitors and rest assured that you will find out when there is a problem.
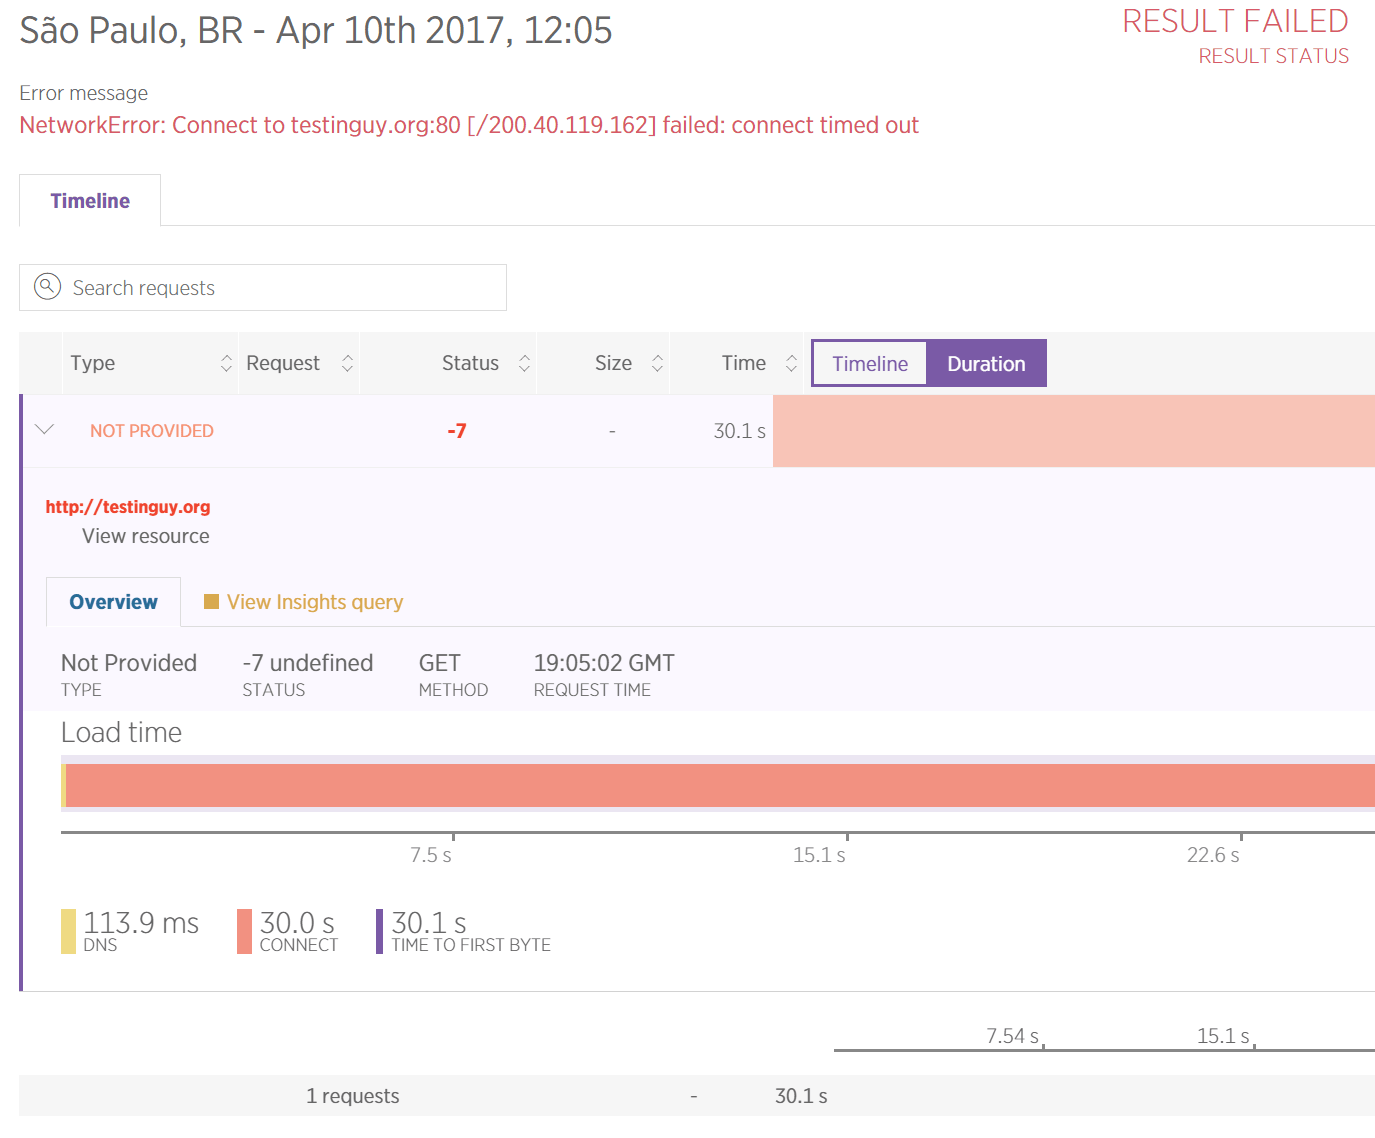
To show you even more of the reporting, here is another example of some crashes that the TestingUy site saw over the last week that New Relic notified me of. This is how Synthetics presented the information regarding that failure:

And the details about one of those crashes:
At Abstracta we have a partnership with New Relic, so for any question about the tool you may have, we are at your service!
Have you used it? How do you like it?
Recommended for You
Introduction to Taurus: An Alternative to JMeter
Gatling vs. JMeter: Our Findings
Low-Code Test Automation: The Day After TestProject
TestProject has been instrumental in automating the testing of large technology developments over the past few years. Tricentis announced that this free low-code test automation platform will no longer be available. How can companies make the transition successful? Sofia Palamarchuk, CEO of Apptim and Director…

What is Throughput in Performance Testing?
Performance testing aims to enhance software application’s effectiveness and readiness. At the heart of this process is a metric called ‘throughput’. Let’s delve deeper into the nuances of throughput and its undeniable importance. In the vast realm of performance testing, if there’s one metric that…
