
Dynatrace is the only observability solution that combines high-fidelity distributed tracing, code-level visibility, and advanced diagnostics across the most advanced cloud-native architectures. With the seamless integration of OpenTelemetry Go data into PurePath 4, organizations can analyze observability data emitted by OpenTelemetry Go instrumentation at enterprise scale.
Organizations that want a high-performance language with a great ecosystem for their applications often use Golang, an open-source programming language. OpenTelemetry for Go provides developers with an observability framework for cloud-native software, allowing them to instrument, generate, collect, and export telemetry data for relevant services.
An observability framework alone is not enough
For today’s highly dynamic and exceedingly complex production environments, performance problems that are evident at the service level (for example, slow response times or failed requests) are often the result of underlying (cloud) infrastructure issues. To effectively address such warning signs, organizations need to focus on putting observability data into context—mapping and visualizing relationships and dependencies within all collected telemetry data—not only traces, metrics, and logs. Such additional telemetry data includes user-behavior analytics, code-level visibility, and metadata (including open-source data). Such monitoring data is critical to providing satisfying digital experiences and services to customers.
Unlock extended end-to-end traceability for OpenTelemetry-instrumented Go applications
Further expanding our support for OpenTelemetry metrics as well as out-of-the-box OpenTracing Java instrumentation, Dynatrace is happy to announce OneAgent support for the capture of OpenTelemetry trace data for Go.
The seamless integration of OpenTelemetry span data into PurePath 4 enables enrichment of your OpenTelemetry traces with insights from Dynatrace OneAgent. This unlocks extended end-to-end traceability for OpenTelemetry pre- and custom-instrumented Go applications and helps organizations in eliminating blind spots across hybrid cloud environments.
When to use OpenTelemetry vs. OneAgent for data capture
OpenTelemetry and OneAgent work together in concert. However, as OneAgent captures more observability data in a more fully automated fashion within ever-changing applications and configurations, here are some things to keep in mind:
OneAgent serves as the foundation for your monitoring in Dynatrace. OneAgent takes care of auto-instrumentation and creation of the Smartscape model, which enables the Davis AI causation engine.
OpenTelemetry complements OneAgent by enabling you to:
- Enrich local monitoring data with project-specific additions (for example, using custom instrumentation to add business data or capture developer-specific diagnostics points).
- Pre-instrument reusable libraries and frameworks at neuralgic interfaces to add out-of-the-box and vendor-neutral observability.
PurePath 4 integrates OpenTelemetry Go data for enterprise-grade collection and contextual AI analytics
Dynatrace supports OpenTelemetry out of the box, making it easy and flexible for developers, SREs, and IT Ops to quickly collect and make sense of all observability data that’s seamlessly integrated into PurePath 4.
Dynatrace OneAgent enables organizations to automate their OpenTelemetry for Go data collection, enrich it with full-stack context, and analyze telemetry data at enterprise scale to optimize applications and drive cloud automation. OneAgent puts OpenTelemetry data for Go into context, providing topology information to related infrastructure components. For instance, you can easily investigate the infrastructure component or instance that is running your software service and you’ll be notified of any related problems by our Davis AI causation engine, which enables teams to address problems proactively.
Dynatrace OneAgent also collects additional metadata, including span attributes, while ensuring the protection of sensitive data. You can easily control the visibility of personal data with Dynatrace data masking capabilities.
With Dynatrace OneAgent you also benefit from support for traffic routing and traffic control. OneAgent implements network zones to create traffic routing rules and limit cross-data-center traffic. Dynatrace OneAgent also has built-in Adaptive Traffic Management to ensure high-fidelity data capture while keeping network traffic low.
Enrich OpenTelemetry instrumentation with high-fidelity data provided by OneAgent
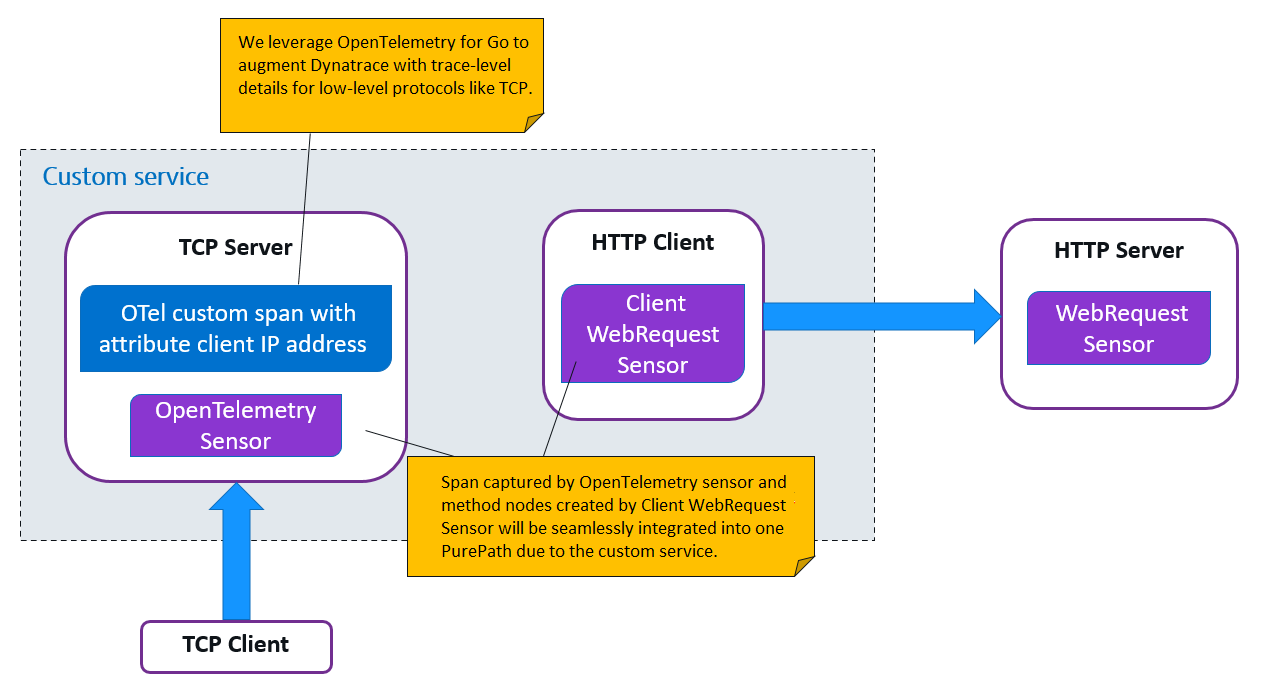
To demonstrate the benefits and seamless integration of OpenTelemetry data for Go with PurePath 4, we’ve prepared a sample application using a custom protocol instrumented with OpenTelemetry for Go. As the server in this example is implemented in a low-level protocol that cannot be monitored automatically at the transactional level, OpenTelemetry can be leveraged to add important context information like the client IP to a trace.
The image below provides an overview of our sample application’s architecture: An incoming client request to the server implementation leads to an outgoing HTTP request. OpenTelemetry instrumentation adds telemetry metadata (in this case, the client address) to the TCP connection established between the client and server.
TCP Server
  // Start TCP server
listener, _ := net.Listen("tcp", ":1234")
conn, _ := listener.Accept()
defer conn.Close()
conn.Write([]byte("Hello from TCP server")) // Create custom Span that represent accepted TCP connection
_, connSpan := tracer.Start(context.Background(), "Incoming TCP connection")
defer connSpan.End()     // Set client IP address as Span attribute
connSpan.SetAttributes(label.KeyValue{
Key:   "Client address",
Value: label.StringValue(conn.LocalAddr().String()),
})
HTTP Client
      // Do HTTP request
      resp, _ := http.Get("http://127.0.0.1:8080/")
      body, _ := ioutil.ReadAll(resp.Body)
      fmt.Println(string(body))
HTTP Server
      http.HandleFunc("/", func(w http.ResponseWriter, r *http.Request) {
            fmt.Fprintf(w, "Hello from HTTP Server")
      })    http.ListenAndServe(":8080", nil)
Once OneAgent OpenTelemetry support for Go is enabled (go to Settings > Server-side service monitoring > Deep monitoring > New OneAgent features > OpenTelemetry(Go), Dynatrace OneAgent instruments the public API of the OpenTelemetry Go SDK and starts capturing span data, including span attributes created by the OpenTelemetry SDK tracer.
You’ll find the OpenTelemetry span data (including span attributes) seamlessly integrated into PurePath. The entry point shown in the PurePath view represents a custom service that we created for the sample application.
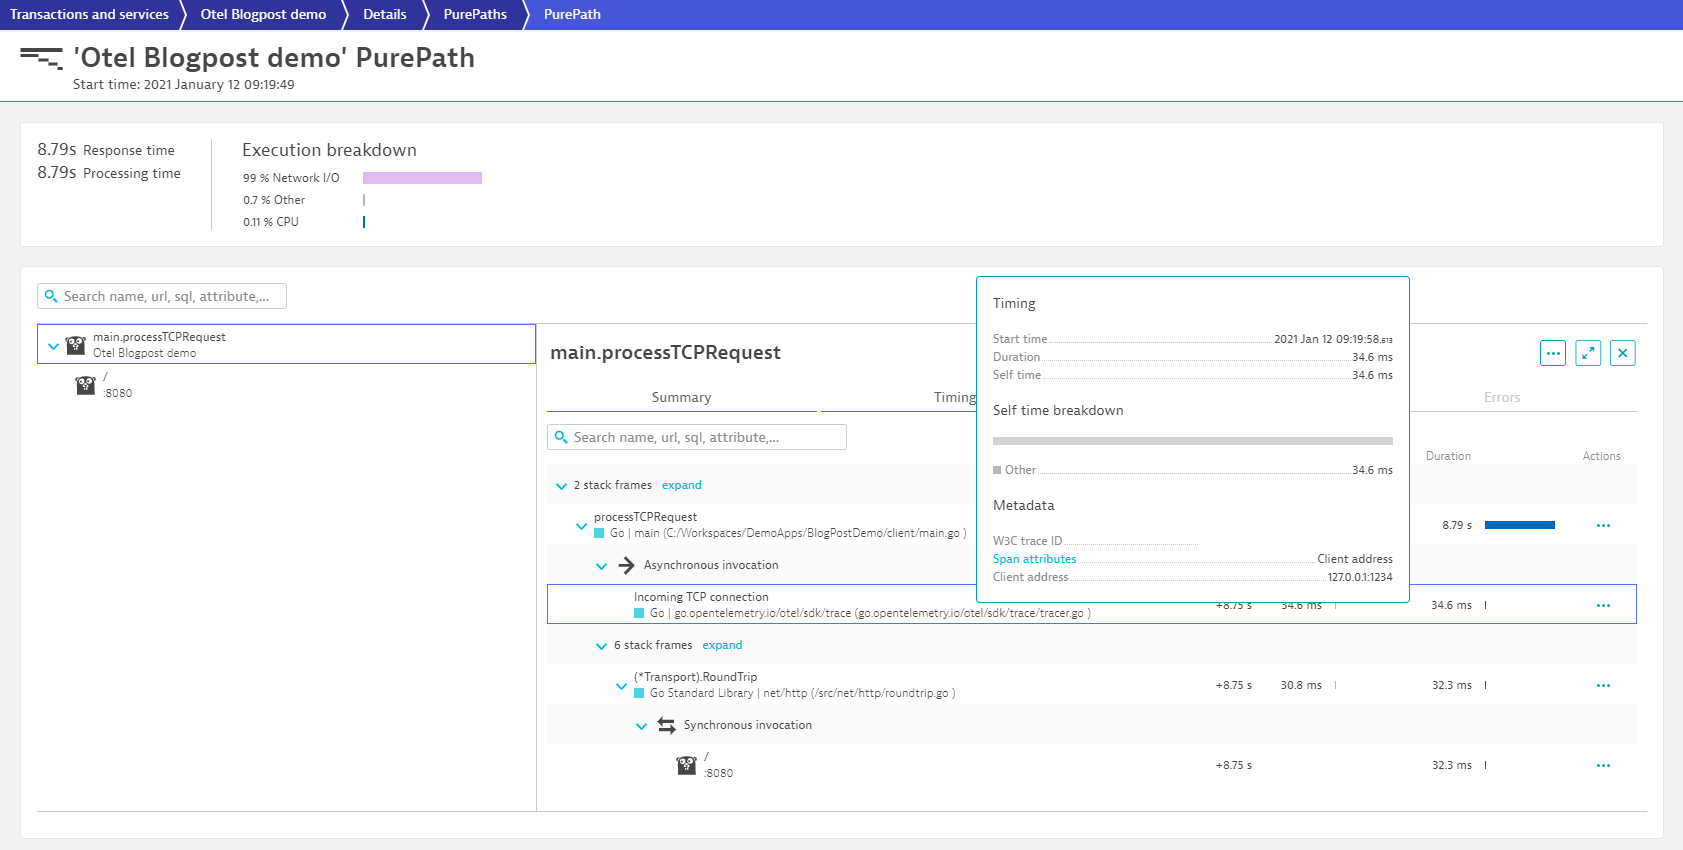
The automatically captured span attribute client address shown above is explicitly specified (at Settings > Server-side service monitoring > Span attributes). This mechanism enables you to remain compliant with your data privacy policies. Some attributes are captured by default for common protocols like HTTP or gRPC (for example, the http.status_code or http.url attributes). These span attributes captured by default can be found (and disabled) at Settings > Server-side service monitoring > Default span attributes.
Furthermore, OneAgent continuously provides topology information to cloud instances or infrastructure components that run software services, thus placing OpenTelemetry data for Go into context.
Note: This Early Adopter feature is limited to OpenTelemetry Go version 0.13.0 and requires OneAgent version 1.207 and Dynatrace version 1.208.
“We want every platform and library to be pre-instrumented with OpenTelemetry and we’re committed to making this as easy as possible.”
– Sergey Kanzhelev (Google)
A key goal of the OpenTelemetry community is to ensure that built-in observability for cloud-native software becomes a “must-have” feature. As we want to lead by example when it comes to pre-instrumentation of open-source frameworks, we’ve started to equip Keptn, an open source CNCF project that provides an event-based control plane for continuous delivery and automated operations for cloud-native applications, with OpenTelemetry pre-instrumentation. As a first step, we’ve leveraged the OpenTelemetry metric exporter for Go as well as the OpenTelemetry Go helper for pre-instrumenting of the Keptn statistics service. The resulting usage statistics are ingested into the Dynatrace platform for further analysis, as shown in our recent blog series.
Our next goal is to add OpenTelemetry pre-instrumentation to the helm service, thereby ensuring insights into data such as response times and errors to ensure observability for occasionally failing delivery use cases. We’ve created a Keptn enhancement proposal and are now working with the community to introduce OpenTelemetry pre-instrumentation to Keptn.
Thanks to initiatives and standards such as OpenTracing and OpenTelemetry, built-in observability is becoming a “must-have” feature for cloud-native software. Dynatrace drives and embraces open standards and is actively contributing and providing leadership in the OpenTelemetry community. Although Dynatrace covers a wide range of technologies, by supporting open standards, we can broaden our technology coverage even further. We also recently announced our partnership with AWS to provide observability for custom OpenTelemetry metrics from AWS.
Try it out today and share your feedback with us!
Are you new to Dynatrace? Start your free trial today—tame blind spots and visibility gaps with end-to-end observability with seamless integration of OpenTelemetry for Go span data.
Already a Dynatrace customer? You can start benefiting from the seamless integration today!
With our latest extensions to PurePath 4, including the seamless integration of OpenTracing data, we’ve set up a feedback channel at Dynatrace Community. Please use this channel to share your thoughts about the OpenTelemetry for Go capability. Your feedback is highly appreciated.
What’s next
Our OneAgent OpenTelemetry for Go integration currently focuses on capturing and enrichment of in-process spans. The team is now working on broadening our support to also allow for representation of inter-process communication of OpenTelemetry-instrumented server-client code.
Please note that the OpenTelemetry community is working hard on providing an OpenTelemetry Go Release Candidate, which means that APIs might change from release to release. This is also why our OneAgent OpenTelemetry for Go support is currently limited to release 0.13.0. However, we’re committed to addressing the OpenTelemetry API changes that occur beyond the supported release version 0.13.0 to ensure that OneAgent continues to support the latest OpenTelemetry Go releases into the future.


Looking for answers?
Start a new discussion or ask for help in our Q&A forum.
Go to forum