
Dynatrace JMX extensions give you instant visibility into database connection pools for top application servers such as Apache Tomcat, Oracle WebLogic, RedHat JBoss, IBM WebSphere Application Server, and IBM WebSphere Liberty.
Most applications communicate with databases to, for example, pull a catalog entry or submit a new record when an order is placed. To achieve this, there must be a healthy connection between the application and the database. Application servers use connection pools to maintain connections with the databases that they communicate with. Connection pools are great because they reduce the overhead associated with opening multiple connections. Connection pools are also a great way to improve performance.
However, if connection pools aren’t implemented correctly, they can cause issues of their own. For example, what happens if there is a bug that prevents an app from letting go of a database connection once a transaction is completed? This can cause other requests to slow down or even fail while waiting for a connection.
This is why we’re excited to unveil a list of new Dynatrace JMX extensions that give you instant visibility into database connection pools for top application servers such as Apache Tomcat, Oracle WebLogic, RedHat JBoss, IBM WebSphere Application Server, and IBM WebSphere Liberty.
New extensions enable AI-powered monitoring of connection pool performance
The new extensions come with full Davis® AI support, meaning you get AI-powered anomaly detection, alerting, and analysis of connection leaks and pool configuration issues that impact your end users. Furthermore, with this update you can:
- Get insights into connection pool metrics in context with the applications and services that use them
- Automatically identify connection leaks in your application code
- Automatically detect undersized connection pools
- Have the Davis AI identify pool-related issues that impact end users
Get insights into connection pool metrics in context with the applications and services that use them
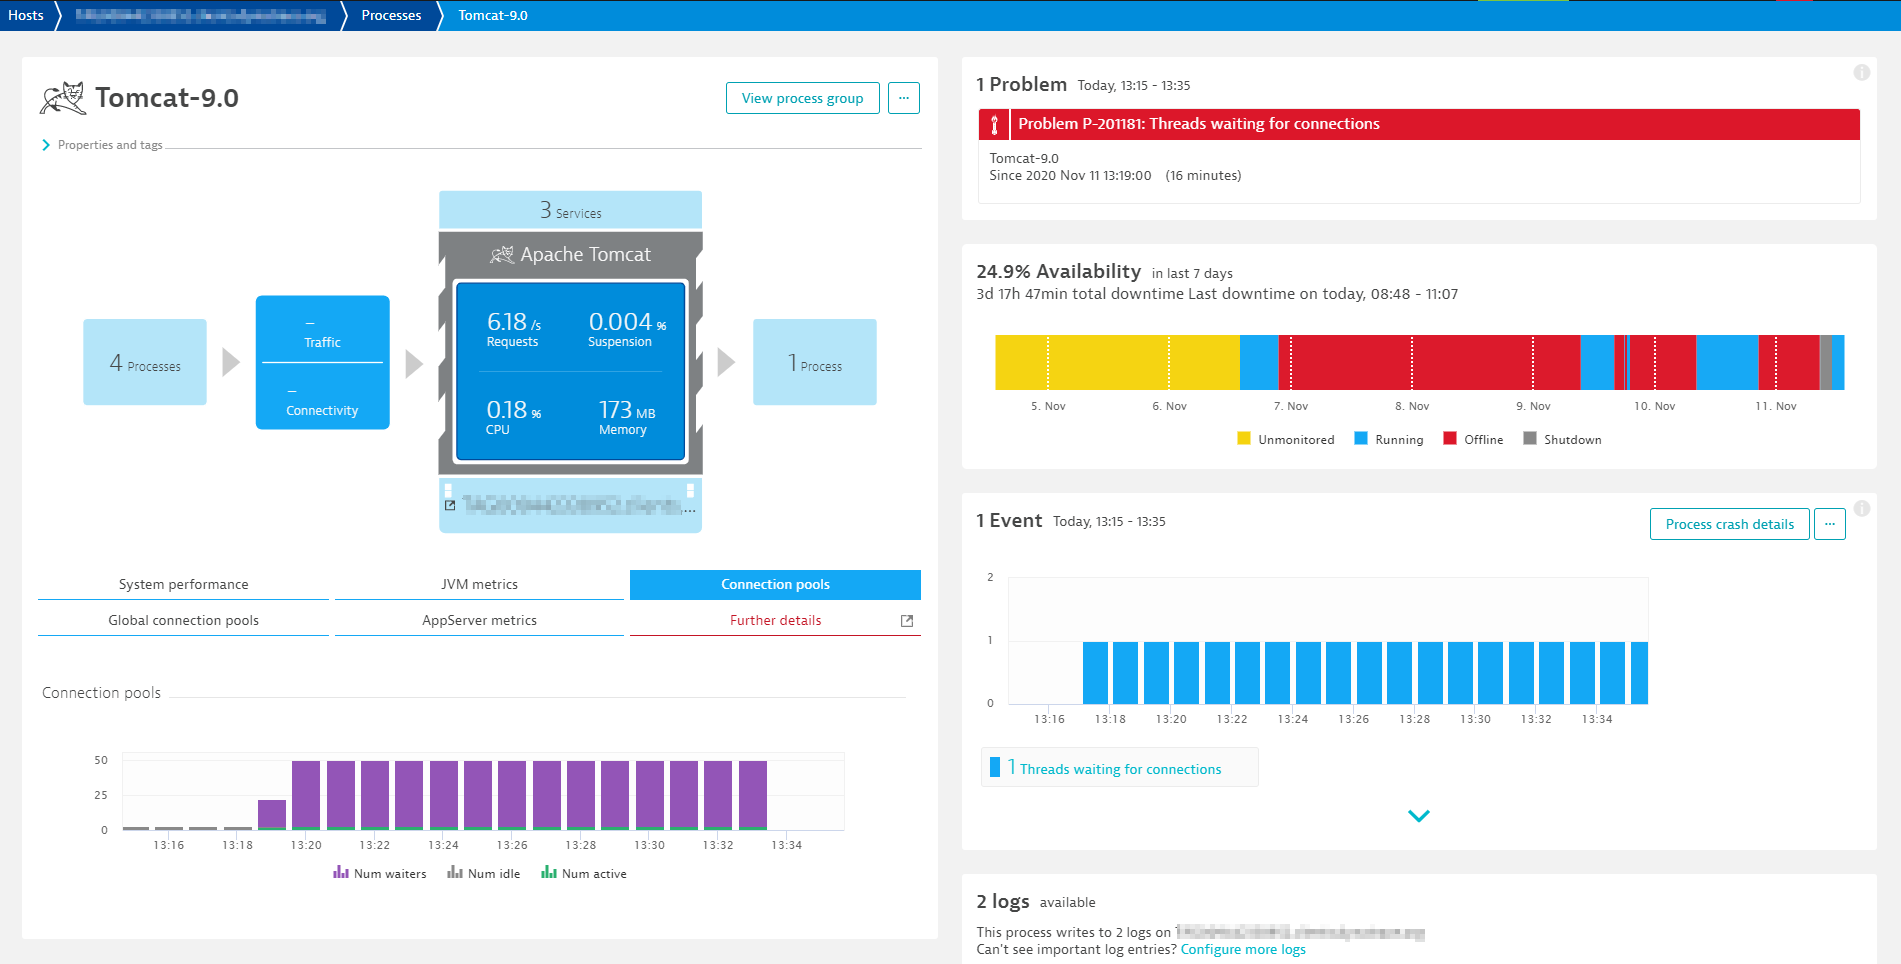
In addition to being available as metrics in custom charts, you can view these metrics at the process group instance level in the Dynatrace web UI. On the overview page you’ll find the metrics aggregated across all detected pools.
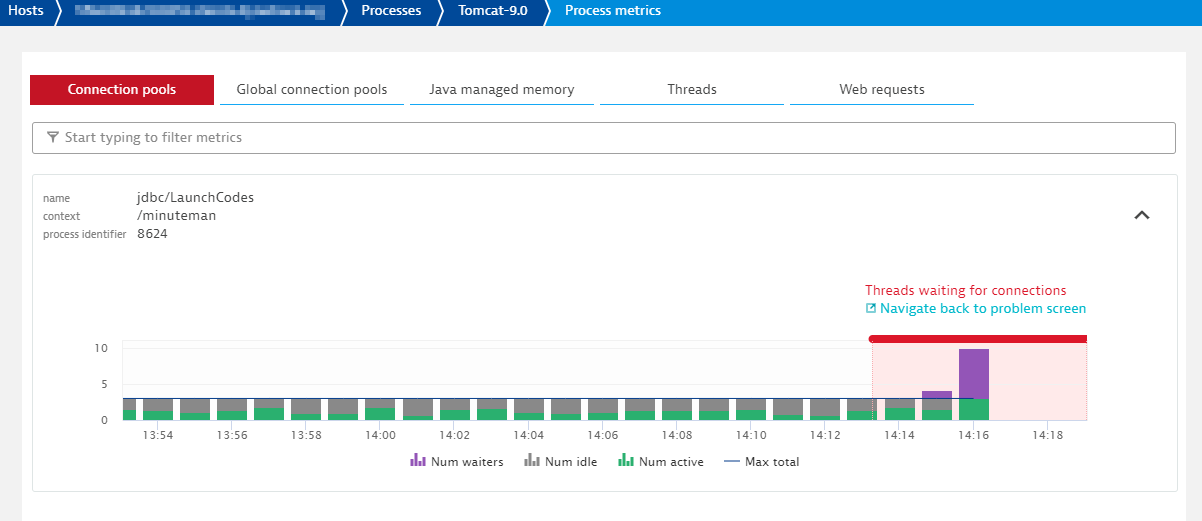
Select further details to see a breakdown of the metrics by connection pool:
Automatically identify connection leaks in your application code
Any new deployment of your application can introduce a connection leak. A connection leak occurs when a connection isn’t released by an app once a transaction is complete, which gradually drains the connection pool.
Since Dynatrace watches for new deployments, it automatically detects connection leaks. You can even integrate Dynatrace into your CI/CD pipeline using the Events API. This allows you to create a deployment event that contains all important details each time a new version is released. Davis then watches for any new problems that might be related and associates them with the deployment event.
Automatically detect undersized connection pools
A traffic spike can be another root cause (for example, if a new marketing promotion drives lots of new customer traffic to your site).
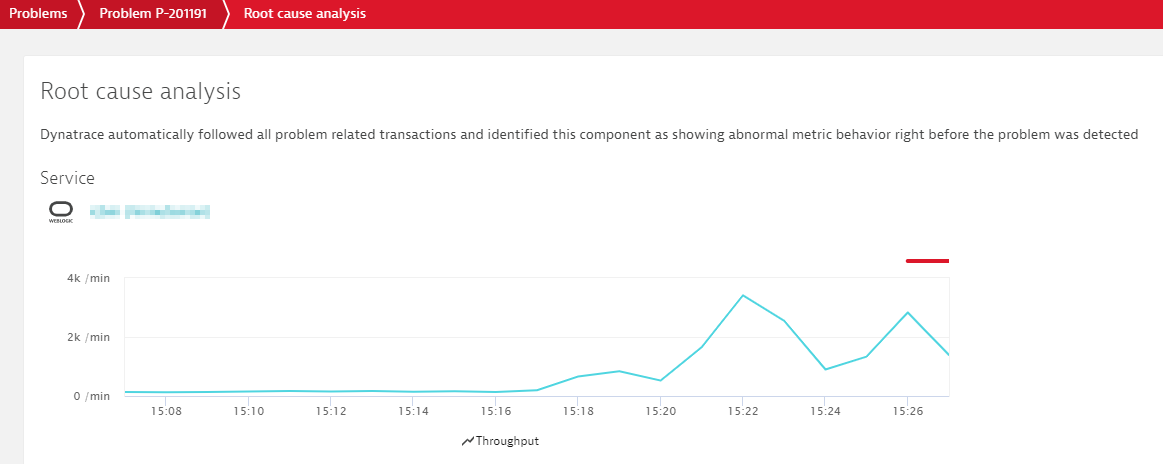
Davis baselines your traffic levels mainly to identify traffic drops, however it can also be set to create events when traffic is higher than expected. The example below shows that Davis has highlighted an increase in service throughput as being related to a detected problem.
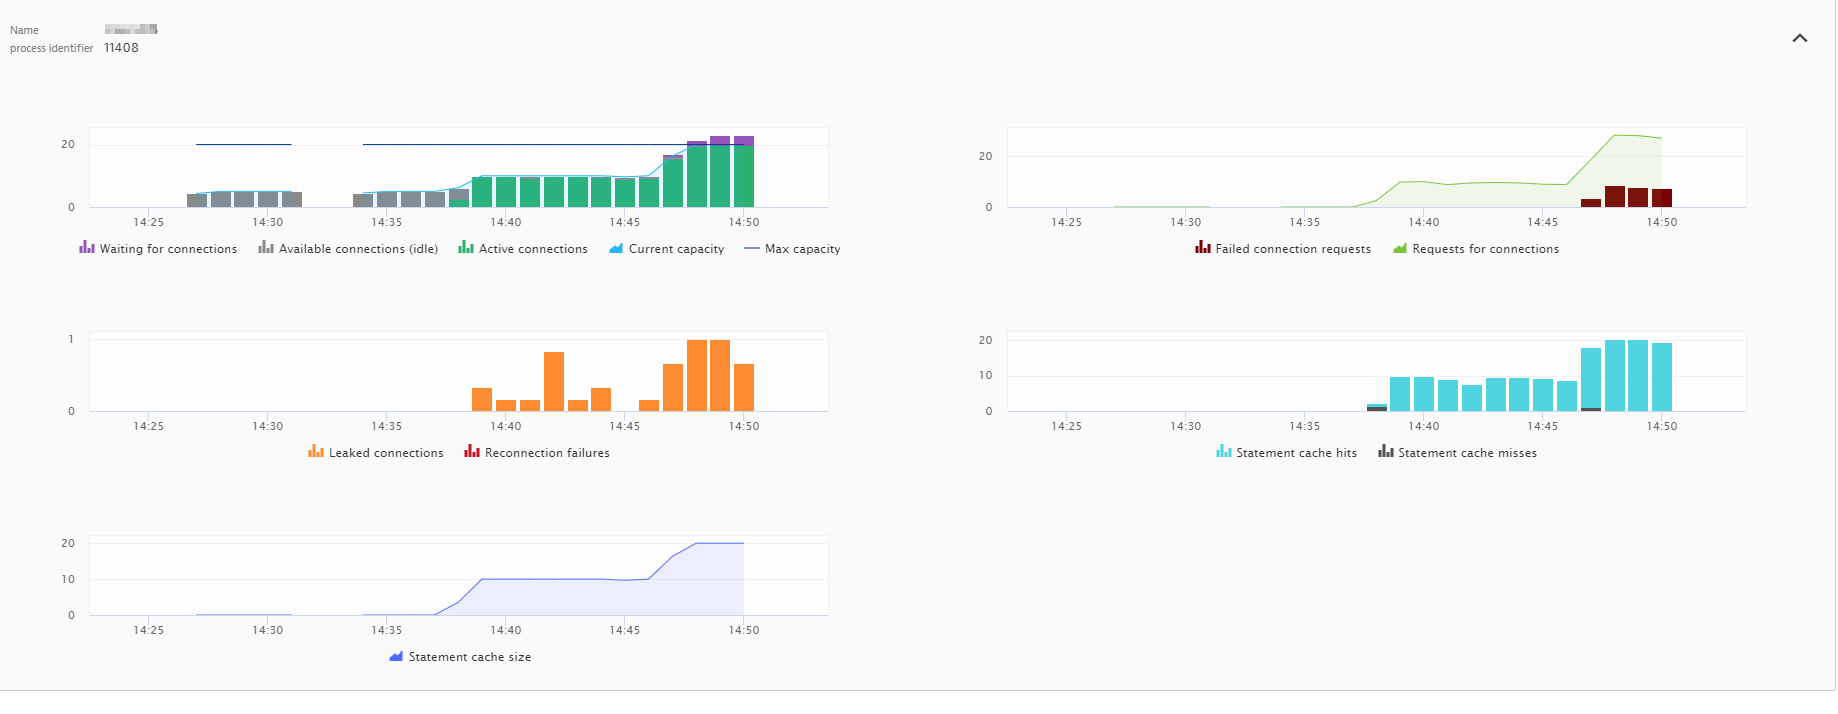
Drilling into the process itself we can see the connection pool hit its maximum capacity, which led to waiting threads and increased response times.
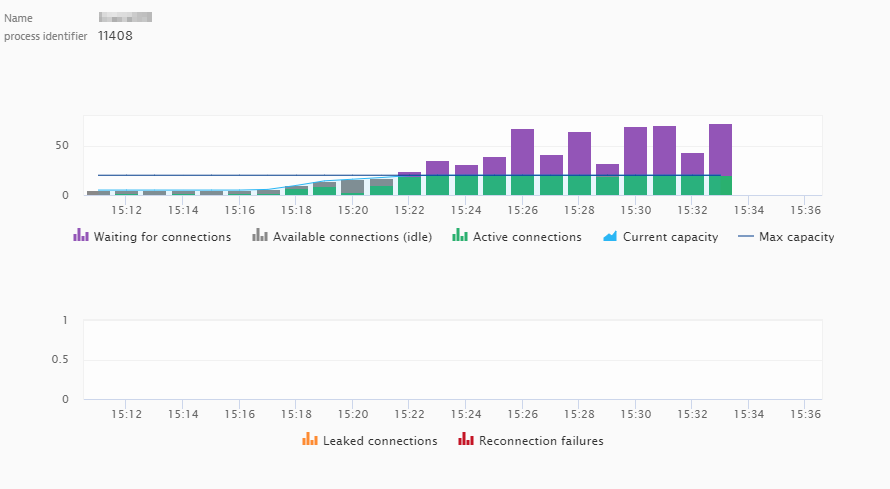
Improving the code itself to be more efficient and capable of handling more traffic is one option. However, this isn’t always possible. Another option is to increase the connection limits for the pool (Only do this if you’re sure that the servers and database can handle the additional load. Otherwise you may need to scale up your resources).
Being able to see your front-end applications, services, and infrastructure in context is a powerful advantage. Combining this with the insights provided by Davis AI removes the guesswork associated with identifying and resolving problems related to connection pools.
Have the Davis AI identify pool-related issues that impact end users
The Davis AI causation engine keeps an eye on all monitored metrics in your environment. Davis watches for changes and lets you know if one of your metrics may be the root cause of a detected problem. This means that you don’t need to dig through thousands of metrics looking for the relevant ones—Davis handles all this for you automatically.
You can also define your own events for alerting using either auto-adaptive metric baselines or static thresholds. Davis can even call out such custom events as the root causes of detected problems.
In the below image you can see a custom event that was configured to identify when all available database connections are exhausted. This event led to a slowdown as requests waited for connections to be released. All this was handled and reported automatically by Davis AI.
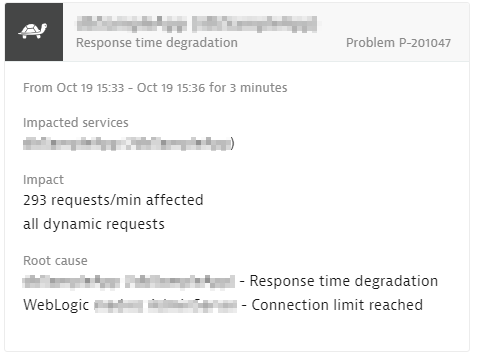
From here, you can decide how to resolve the problem and prevent such an issue from occurring again in the future. This is where the ability of Dynatrace to analyze your entire technology stack in context is most powerful.
How to get started
As this enhancement is available in an Early Adopter release, you need to opt into connection pool monitoring. To do this, go to Settings > Monitored technologies > Supported technologies. You can also enable or disable this setting at the individual host level.
Application server configurations
Some app servers don’t report these metrics by default. In such cases you need to make a configuration change so that Dynatrace can capture and report the metrics.
- IBM WebSphere Liberty: You need to enable the “monitor” feature.
- RedHat JBoss: You need to enable statistics for JBoss EAP 6 / Application Server 7 and later (RedHat account required).
What’s next
The release of these extensions is part of bigger level-up of database monitoring in Dynatrace. So that we can make Dynatrace database monitoring even better, please share your thoughts and ideas for improvement with us at Dynatrace Community.


Looking for answers?
Start a new discussion or ask for help in our Q&A forum.
Go to forum