Remove technologies java-monitoring spring
article thumbnail

AI-driven analysis of Spring Micrometer metrics in context, with typology at scale

Dynatrace

Every company has its own strategy as to which technologies to use. To remain flexible in observing all technologies used in their organization, some companies choose open-source solutions, which allow them to stay vendor-neutral. Micrometer is used for instrumenting both out-of-the-box and custom metrics from Spring Boot applications.

Metrics 213
article thumbnail

AI-driven analysis of Spring Micrometer metrics in context, with topology at scale

Dynatrace

Every company has its own strategy as to which technologies to use. To remain flexible in observing all technologies used in their organization, some companies choose open-source solutions, which allow them to stay vendor-neutral. Micrometer is used for instrumenting both out-of-the-box and custom metrics from Spring Boot applications.

Metrics 130
Insiders

Sign Up for our Newsletter

This site is protected by reCAPTCHA and the Google Privacy Policy and Terms of Service apply.

Trending Sources

article thumbnail

AI-driven analysis of Spring Micrometer metrics in context, with topology at scale

Dynatrace

Every company has its own strategy as to which technologies to use. To remain flexible in observing all technologies used in their organization, some companies choose open-source solutions, which allow them to stay vendor-neutral. Micrometer is used for instrumenting both out-of-the-box and custom metrics from Spring Boot applications.

Metrics 130
article thumbnail

Protect your organization against zero-day vulnerabilities

Dynatrace

Techniques such as statistics-based monitoring and behavior-based monitoring are also possible. Statistics-based monitoring is when organizations take statistics from exploits that vendors have detected and feed them into a system to learn and identify these attacks. Application logs are a good data source for this method.

Java 191
article thumbnail

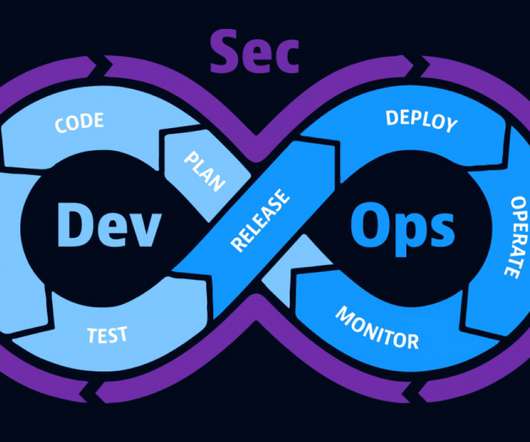
InfoSec 2022 guide: How DevSecOps practices drive organizational resilience

Dynatrace

Adopting cloud-native technologies and open source software makes applications more feature rich and scalable, but it also increases IT complexity. In recent years, the number of vulnerabilities has overtaken the ability to effectively monitor IT environments manually. However, these technologies can increase complexity.

article thumbnail

Dynatrace and Google unleash cloud-native observability for GKE Autopilot

Dynatrace

Create a Kubernetes secret with a Dynatrace token kubectl -n dynatrace create secret generic dynakube --from-literal="apiToken=xxyyzz" Apply a Dynakube with Application monitoring and a CSI Driver This simple example helps. In this case, Davis found that a Java Spring Micrometer metric Failed Deliveries is highly correlated with CPU spikes.

Google 225
article thumbnail

RSA 2022 guide: DevSecOps transformation with runtime vulnerability management

Dynatrace

In addition, as businesses of all kinds adopt cloud-native and open source technologies, their environments become more flexible. However, these technologies can add to the complexity. Because of their flexibility, dynamic, ephemeral environments are more difficult to monitor in real time than traditional on-premises infrastructure.

Strategy 229