Remove tags crux
article thumbnail

In Defence of DOM­Content­Loaded

CSS Wizardry

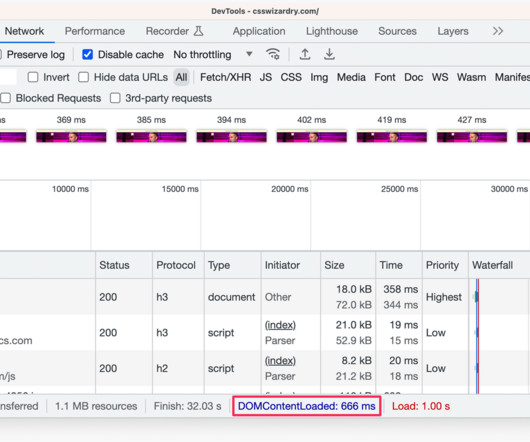
And luckily, while DOMContentLoaded is now considered a legacy metric, we can still get field data for it from two pretty decent sources… Chrome User Experience Report (CrUX) Things got a lot worse between March and April 2023 CrUX Dashboard is one of very few CrUX resources that surfaces the DOMContentLoaded event to us.

Metrics 326
article thumbnail

Debugging Interaction to Next Paint (INP)

Speed Curve

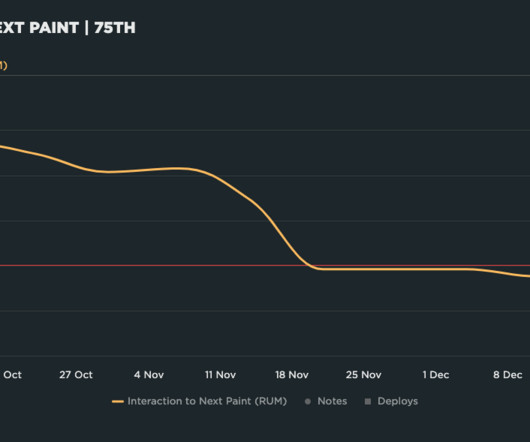
In this post I'm going to walk through: How I help people identify the causes of poor INP times Examples of some of the most common issues Approaches I've used to help sites improve their INP Identifying Interactions The Chrome UX Report (CrUX) can provide a high-level view of INP.

Insiders

Sign Up for our Newsletter

This site is protected by reCAPTCHA and the Google Privacy Policy and Terms of Service apply.

Trending Sources

article thumbnail

Improving The Performance Of An Online Store (Case Study)

Smashing Magazine

These were stored as one big svg tag in the HTML head of the page, with a symbol for each of the icons that was then used as a linked svg in the HTML’s body. CSS figures hugely in Google’s Chrome User Experience Report (CrUX) and also features heavily in the Google Page Speed Insights report and recommendations. Icon Loading.

article thumbnail

Front-End Performance Checklist 2021

Smashing Magazine

Getting Ready: Planning And Metrics Performance culture, Core Web Vitals, performance profiles, CrUX, Lighthouse, FID, TTI, CLS, devices. Note that new CrUX datasets are released on the second Tuesday of each month. you can get CrUX performance data for specific pages instead of just the aggregates. Table Of Contents.

article thumbnail

How We Improved SmashingMag Performance

Smashing Magazine

Now, analytics tools and performance monitoring tools will provide this data when needed, but we looked specifically into CrUX , Chrome User Experience Report. CrUX generates an overview of performance distributions over time, with traffic collected from Chrome users. Data from CrUX. Large preview ).

article thumbnail

The Performance Inequality Gap, 2024

Alex Russell

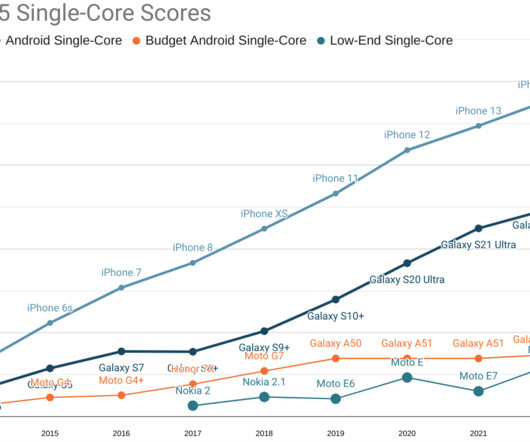
As inequality grows, averages and "generation" tags can become illusory and misleading. At a population level, these influences play out slowly as devices age out, but still have impressively positive impacts: Device impact on network performance is visible in Opensignal's iPhone dataset.

article thumbnail

Front-End Performance Checklist 2020 [PDF, Apple Pages, MS Word]

Smashing Magazine

To get a good first impression of how your competitors perform, you can use Chrome UX Report ( CrUX , a ready-made RUM data set, video introduction by Ilya Grigorik and detailed guide by Rick Viscomi) or Treo Sites , a RUM monitoring tool that is powered by Chrome UX Report. You can then mimic the 90th percentile’s experience for testing.