
In this article, we will take a glance at the fundamentals of SQL Server statistics and discover their interaction with the query processing steps with simple examples.
Getting Started with SQL Server statistics
SQL Server statistics are one of the key inputs for the query optimizer during generating a query plan. Statistics are used by the optimizer to estimate how many rows will return from a query so it calculates the cost of a query plan using this estimation. CPU, I/O, and memory requirements are made according to this estimate, so accurate and up-to-date statistics play an important role in the creation of more effective query plans. Besides this, the accuracy of statistics helps in proper resource planning for queries. After this short explanation, we can say that statistics play a key role in query performance without hesitation.
SQL Server automatically creates statistics when we create an index on a table or indexed view. At the same time, the query optimizer can decide to create statistics for the non-indexed individual columns during the execution process of the queries. However, this option can work if the Auto Create Statistics option of the database is enabled. Auto Create Statistics option can be seen under the options tab of the database properties.

What is a histogram?
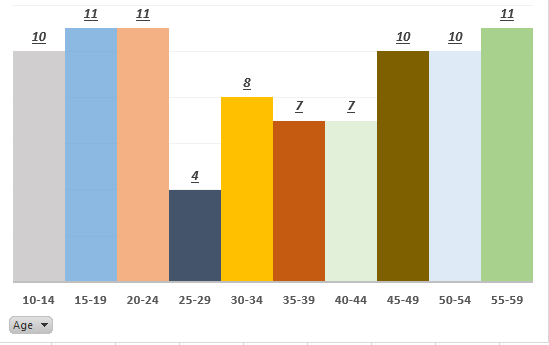
A histogram is the classification of the values in a data group. Histograms allow us to see the frequency distribution of a data set. For example, the following histogram data is created based on the age distribution of people who are visiting a museum per day. Histogram charts are generally used to virtualize histogram data.


SQL Server statistics stores the distribution of the column data in a histogram and stores unique values ratio in the density vector. These two meta-data are used by the query optimizer to calculate how many rows will return a query. Understanding SQL Server statistics concepts with the help of examples will be more beneficial than continuing with theoretical information to learn better about real-world issues.
Pre-requisites
In this article’s examples, we will use a short copy of the Product table of the Adventureworks database. We will use the following T-SQL script to create the NewProduction table and populate it with data from the Product table.
|
1 2 3 4 5 6 |
CREATE TABLE NewProduction (PID INT PRIMARY KEY IDENTITY(1,1), Name VARCHAR(50),ProductNumber VARCHAR(50),SafetyStockLevel INT ,ReorderPoint INT) INSERT INTO NewProduction ( Name,ProductNumber,SafetyStockLevel,ReorderPoint) SELECT TOP 100 Name,ProductNumber,SafetyStockLevel,ReorderPoint FROM Production.Product |
SQL Server statistics in action: Trivial query plan
As we stated, after creating an index SQL Server automatically creates statistics for this index. Moving from this point, we can expect that SQL Server creates statistics for the primary key of the NewProduction table. By default, when we create a primary key constraint SQL Server automatically creates a unique clustered index. In the SQL Server Management Studio (SSMS), we can see the SQL Server statistics under the Tables subfolder.

Tip: The DBCC SHOW_STATISTICS command can be used to obtain statistics meta-data details. The syntax for the command is as follows:
1DBCC SHOW_STATISTICS ('Object_Name', 'Statistic_Name')The following example query shows the header, density vector, and histogram data of statistics
1DBCC SHOW_STATISTICS ('Person.Person','IX_Person_LastName_FirstName_MiddleName')

However, after the insert operation the statistic data is still empty but statistics data will be updated when we execute a query that required the clustered index statistics data.

We will check the details of the statistics using the DBCC SHOW_STATISTICS command after executing the following query:
|
1 2 3 |
SELECT * FROM NewProduction WHERE PID > 24 GO DBCC SHOW_STATISTICS ('NewProduction','PK__NewProdu__C57755203D35D630') |

As we can see, the statistics header, density vector, and histogram data are created after the execution of the query.
On the other hand, SQL Server statistics can become outdated (stale) after the modification (insert, update, delete ) of the table because column values distribution will be changed. In this case, the query optimizer checks the modification counter value and if it exceeds a threshold value, the statistics will be triggered to update. After this operation, the optimizer generates a new query plan because it presumes a chance to generate a more effective query plan with the up to date statistics. The query optimizer decides to update statistics according to the following rules:
- The table row number has gone from 0 rows to more than 0 rows
- The table had 500 rows or less when the statistics were last sampled and has since had more than 500 modifications
- The table had more than 500 rows when the statistics were last updated and the number of row modifications is more than MIN ( 500 + (0.20 * n), SQRT(1,000 * n) ) formula result after the statistics were last sampled
Auto Update Statistics option can be found under the options tab of the database properties.

In this second scenario, we will insert 500.000 new rows into the table and then will execute the same query. In this case, we expect that the statistic will be updated.
|
1 2 3 4 |
INSERT INTO NewProduction ( Name,ProductNumber,SafetyStockLevel,ReorderPoint) SELECT Name,ProductNumber,SafetyStockLevel,ReorderPoint FROM Production.Product GO 1000 SELECT * FROM NewProduction WHERE PID > 24 |
However, the statistic is not updated automaticly because Rows and Rows Sampled columns still show the same values in the statistic header data. Welcome to the real world Auto Update Statistic option is enable but the statistic is not updated.
|
1 |
DBCC SHOW_STATISTICS ('NewProduction','PK__NewProdu__C57755203D35D630') |

The issue is hidden in the query execution plan. In the execution plan of this query, we can see that the Optimization Level attribute of the query is TRIVIAL.

The query optimizer creates a trivial plan when the query is fairly simple and there are no other different query plan candidates to process the executed query. In this circumstance, the query optimizer thinks query recompilation would be a waste of resources and time so it does not consider update the statistics. SQL Server does not recompile the trivial plans so the update statistics process is not triggered by the optimizer. The trace flag 8757 forces the optimizer to complete all optimization processes and when we enable this trace flag in the sample query the SQL Server statistics will be updated and used.
|
1 2 3 |
SELECT * FROM NewProduction WHERE PID> 24 OPTION (querytraceon 8757) DBCC SHOW_STATISTICS ('NewProduction','PK__NewProdu__C57755203D35D630') |

When we review the execution plan of the query, we will see that the Optimization Level attribute shows a FULL value. It means that all optimization steps were completed by the optimizer.

At the same time, we can find out which statistics are used during the execution of the query by the use of the OptimizerStatsUsage attribute.


- Database: shows the database name that the statistic belongs to
- LastUpdate: shows the date and time the statistics were last updated
- ModificationCount: shows how many rows were changed since the last update date
- SamplingPercent: shows the percentage of the rows that are used to generate histogram data
- Schema: shows the schema name that the statistic belongs to
- Statistics: show the name of the statistics
- Table: shows the table name that the statistic belongs to
As a result, analyzing the execution plan can help to obtain which SQL Server statistics are used during the execution of the query.
SQL Server Statistics in Action: Query Recompilation
SQL Server query optimizer can decide to create or update statistics for the individual column during the execution of a query to make more proper estimates. At the same time, after the statistic creation or update process, the optimizer recompiles the query. Let’s observe these two situations for the following query. Before executing the query, we will create an extended event that helps to capture recompile operations. SQL Server can recompile a query for the following reasons:
|
1 2 3 4 5 |
SELECT map_key , map_value from sys.dm_xe_map_values as dxmv where dxmv.name=N'statement_recompile_cause' |

The statistic creation operation is to get involved in the Schema changed category.
|
1 2 3 4 5 6 |
CREATE EVENT SESSION Capture_Recompile ON SERVER ADD EVENT sqlserver.sql_statement_recompile( ACTION(sqlserver.database_id,sqlserver.sql_text) ) ADD TARGET package0.event_file(SET filename=N'Capture_Recompile'); ALTER EVENT SESSION Capture_Recompile ON SERVER STATE = START; |
The created extended event will appear Extended Events sessions folder and we will click the Watch Live Data option and start the watch the captured events. As the second step, we will execute the following query but we will add a very simple subquery into it to avoid trivial query plans.
|
1 2 3 |
SELECT SafetyStockLevel, ProductNumber FROM NewProduction WHERE SafetyStockLevel =1000 AND 1=(SELECT 1) |
During the execution of the query, SQL Server has created a new statistic. This statistic name starts with _WA_Sys_.

On the other hand, the extended event has captured a recompilation of a query. The reason for the recompile operation is Schema change and the sql_text field value shows our example query.

Conclusion
In this article, we have learned the basics of SQL Server statistics. Statistics plays a very important role in the query optimization process and is used by the query optimizer to generate execution plans.

Most of his career has been focused on SQL Server Database Administration and Development. His current interests are in database administration and Business Intelligence. You can find him on LinkedIn.
View all posts by Esat Erkec
- SQL Performance Tuning tips for newbies - April 15, 2024
- SQL Unit Testing reference guide for beginners - August 11, 2023
- SQL Cheat Sheet for Newbies - February 21, 2023