
In this article, we will learn some basic tips for SQL Server performance tuning. Tuning the SQL Server performance will help to access data faster so the applications data interaction performances will enhance.
Note: To learn how important is SQL Performance tuning as a skill, please read Why SQL Performance Tuning is the Most Important Database Management Skill to Have article.
In today’s world, most organizations are generating a huge amount of data and they are storing them in the databases. SQL Server is one of the most preferred relational database solutions on the market and plays a role as a data server for mission-critical applications. When considered from this point of view, any delay or performance decrease occurs on the database server might cause huge problems. To overcome SQL Server’s performance issues, we need to have enough experience and knowledge, but in this article, the following tips will help you understand the common performance problems in a simple manner and also explains where they need to look for these issues for the SQL newbies. Now let’s start to learn 5 SQL Server performance tuning tips.
Analyze Wait Statistics
SQL Server performs tasks with the help of the threads and these threads need different resources to accomplish their tasks. Sometimes, the required resources are not available, so the thread begins to wait for this resource until it becomes available. The elapsed time until the source is available is called wait time.
At the same time, resource wait times are measured and stored by the SQL Server, and these measured values are called wait statistics or wait stats. Wait stats are the first step of the SQL Server performance tuning because it includes information that provides us to figure out where the bottleneck or issue can be. SQL Server offers a dynamic management view that returns information about the wait statistics. The following query returns the accumulated wait statistics since the SQL Server last started or wait stats cleared.
|
1 2 3 |
SELECT * FROM sys.dm_os_wait_stats ORDER BY wait_time_ms DESC |

We can use the SQL Server wait types dictionary to find the description of the wait types. This allows us to have clearer information about which issue is indicated by the wait_type column. However, the wait statistics solely will not be enough to diagnose the root of the problem therefore we need to use other DMV’s and tools to find out the crux of the problem. Such as the Performance Monitor (Perfmon) can help to identify the problem more clearly. Assume that, we see the PAGEIOLATCH_SH wait type has the biggest wait time. In this circumstance, at first, we can read the PAGEIOLATCH_SH description and suggested solutions.

At the same time, to obtain more knowledge about the wait types of details, we can use the following web pages:
After reading the description, we can understand that this wait type can be related to the followings problems:
- Insufficient disk performance
- Poorly designed queries
- SQL Server memory setting or amount of the memory
- Page compression option
Now we will take a glance at which tools can help to investigate the insufficient disk performance item. To identify the details of I/O problems, we can use Perfmon and the following counters will give detailed information about the disk subsystem performances:
|
Measured term |
Counter |
|
Total IOPS |
Disk Transfers/sec |
|
Throughput |
Disk Bytes/sec |
|
Read Latency |
Avg. Disk sec/Read |
|
Write Latency |
Avg. Disk sec/Write |

Also, we can use dm_io_virtual_file_stats dynamic view because it gives the I/O statistics of the database files. The following query will return the database file latency.
|
1 2 3 4 5 6 7 8 9 10 11 12 13 |
SELECT DB_NAME(vfs.database_id) AS database_name ,physical_name AS [Physical Name], size_on_disk_bytes / 1024 / 1024. AS [Size of Disk] , CAST(io_stall_read_ms/(1.0 + num_of_reads) AS NUMERIC(10,1)) AS [Average Read latency] , CAST(io_stall_write_ms/(1.0 + num_of_writes) AS NUMERIC(10,1)) AS [Average Write latency] , CAST((io_stall_read_ms + io_stall_write_ms) /(1.0 + num_of_reads + num_of_writes) AS NUMERIC(10,1)) AS [Average Total Latency], num_of_bytes_read / NULLIF(num_of_reads, 0) AS [Average Bytes Per Read], num_of_bytes_written / NULLIF(num_of_writes, 0) AS [Average Bytes Per Write] FROM sys.dm_io_virtual_file_stats(NULL, NULL) AS vfs JOIN sys.master_files AS mf ON vfs.database_id = mf.database_id AND vfs.file_id = mf.file_id ORDER BY [Average Total Latency] DESC |

Optimize TempDB
TempDB is a system database and used for various temporary operations by SQL Server. TempDB is a shared resource and it is used by all databases on the instance. Insufficient TempDB database performance can degrade the performance of the following operations:
- Creating local or global temporary tables
- Table variables
- Online indexing
- Snapshot Isolation Levels
- Cursors
- Multiple Active Record Sets (MARS)
TempDB performance is very important to the SQL Server performance tuning. In order to improve the performance of the TempDB, we can apply the following best practices.
- Create multiple tempdb files with the same size
- Locate the TempDB files on the separated place from the user database files
- Locate the TempDB to fastest disk subsystems
- Consider using Memory-Optimized TempDB Metadata (SQL Server 2019)
- Track TempDB growing
Check memory options of the SQL Server
SQL Server allocates memory to cache data and index pages. Also, it caches the compiled execution plans in the memory. SQL Server is designed to allocate maximum memory as possible and it does not release this memory. In this case, the operating system may start using the paging file due to insufficient memory and it causes slowing and long response times on the operating systems. Setting the maximum and minimum memory option for effective SQL Server performance tuning can help to avoid this type of problem. We can use the following straightforward formula if the SQL Server instance is running on a non-shared server.
For the first 16GB of RAM, allocate 4GB for the operating system, and then add 1GB of RAM for each 8GB of RAM. For example, if our server has 64GB physical memory, we need to reserve 10GB for the operating system and 54GB RAM for SQL Server. In order to set maximum and minimum memory setting, we can use SSMS.
-
Open SSMS and right-click in the SQL Server Instance and select the Properties menu

-
Navigate to Memory tab and change the set the Minimum server memory (in MB) and Maximum server memory (in MB)


SQL Server does not release the memory when the operating system experiences memory pressure so it will be useful to set the minimum memory setting less than the maximum memory setting.
Monitor Index Usage and Physical Statistics
SQL Server performance tuning and indexes are like two peas in a pod. Indexes are the database objects that help to speed up accessing data for this reason these objects play a key-role in the database tuning. So monitoring the index fragmentation and usage statistics extremely important to tune our query performance. Index Usage Statistics and Index Physical Statistics are the standard reports that we can obtain information about the indexes.
-
Right-click on the database which database we want to get information about the index statistics
-
Select the Reports -> Standart Reports in the context menu and select the Index Usage Statistics or Index Physical Statistics report


Install the latest updates on SQL Server
Like all other applications, the SQL Server development team adds new features and fixes the bugs to their products so it will be useful to keep up-to-date SQL Server deployment with the latest updates. However, we need to consider the below:
- Install the service packs or cumulative updates to the test environment before installing them on the production
- Read the documentation
- Consider the system reboot requirement after the installation of the update
Monitor the log file size
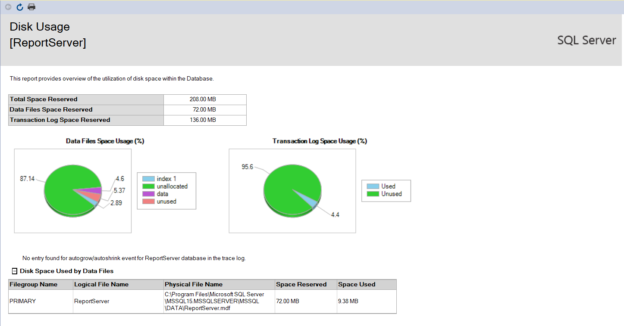
SQL Server records all changing logs into the log file before saving these changes permanently. Don’t take transaction log backups (full and bulk-logged recovery models) or unexpected database operations which are generating a huge amount of log can lead to growth log file size. The Disk Usage report can give detailed information about the data and log files used and unused sizes.
-
Right-click on the database for which we want to get information about the database files
-
Select the Reports -> Standart Reports in the context menu and select the Disk Usage report


Conclusion
In this article, we focused on some basic methods to understand the SQL Server performance tuning. Troubleshooting the performance issues can be very complicated and tedious but knowing the basic methods will always help to focus on the root problem and solve it.

Most of his career has been focused on SQL Server Database Administration and Development. His current interests are in database administration and Business Intelligence. You can find him on LinkedIn.
View all posts by Esat Erkec
- SQL Performance Tuning tips for newbies - April 15, 2024
- SQL Unit Testing reference guide for beginners - August 11, 2023
- SQL Cheat Sheet for Newbies - February 21, 2023