
You may have heard of the Top500 list. It ranks the world’s 500 most powerful supercomputers based on their performance as measured by the Linpack benchmark. Published twice per year (in June and November) since 1993, the Top500 list records the development of supercomputers over the past two to three decades. In addition to performance, the Top500 list also summarises the main characteristics of the supercomputers in the list. Therefore, it contains much richer information than a mere ranking of the supercomputers by performance. In this post, we’ll have a closer look at the Top500 list and relevant topics, including supercomputers, performance, and statistics on processors and co-processors.
Supercomputer
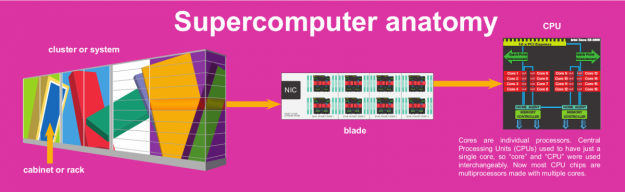
The Top500 list is all about supercomputers. It therefore makes sense to have a brief overview of supercomputers before going into the details of the Top500 list. As shown in the image below, a supercomputer usually consists of many cabinets (also called racks), which are each about the size of a fridge. Each cabinet contains a stack of blades (with each blade being about the size of a PC turned sideways). Each blade has several compute nodes mounted in it, with each compute node having one or more multicore processors. For example, PDC’s Beskow system has 11 cabinets, 515 blades, 2,060 compute nodes, and a total of 67,456 cores . Because of their extraordinary computational capability, supercomputers have been used in many fields including molecular modelling, quantum mechanics, physical simulations, and climate research. This is vividly reflected in the design on the Titan supercomputer, which is still among the world’s top 10 most powerful supercomputers (as of the November 2018 Top500 list).
#/media/File:Titan_supercomputer_at_the_Oak_Ridge_National_Laboratory.jpg)
FLOPS
The ranking of the supercomputers in the Top500 list is determined by their performance as measured in specific tests. FLOPS, or number of floating point operations per second, is a common measure of computer performance. However, the speed of a computer in FLOPS can vary depending on the number of bits used in the representation of the floating point numbers in the tests. The tests used to determine the Top500 list measure the computers’ performance when working with 64-bit floating point arithmetic. This is also commonly known as “double precision” on many computer systems. Over the years, the performance of the world’s fastest supercomputers have reached teraFLOPS (1012 FLOPS) in 1997 and petaFLOPS (1015 FLOPS) in 2008, and the next milestone is exaFLOPS (1018 FLOPS). A supercomputer that is capable of 1 exaFLOPS or higher would be called an exascale supercomputer, and, when they become available, they are expected to contribute significantly to the advancement of science and technology.
Performance development
Some particularly useful information that is available from the Top500 list website highlights the performance development of supercomputer systems. As shown in the figure below, the performance development roughly follows a straight line, indicating that there has been an exponential increase in the performance of supercomputers (since the vertical axis has a logarithmic scale). Note that the triangles correspond to the very top system each year, the squares correspond to the 500th supercomputer, and the circles denote the performance sum of all the systems in the list. Based on such exponential growth in supercomputing power, one can hope that the world’s fastest supercomputer will achieve exascale performance around 2021.
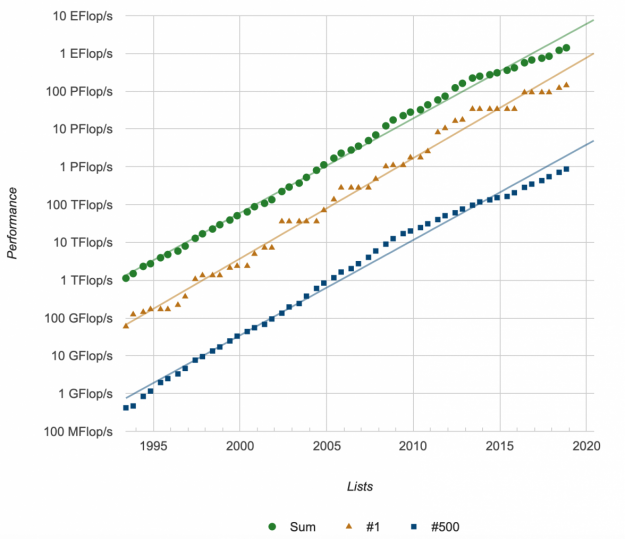
Exponential growth of supercomputing power
Source: https://www.top500.org/statistics/perfdevel/
An interesting observation is the somewhat “stepwise” development in the performance of the top machine (indicated by the triangles in the figure). This means that a top machine usually stays at the top for a certain amount of time before it is surpassed by a newer and more powerful one. For instance, the Tianhe-2A machine stayed at the top for a total of three years (from 2013 to 2015). It remains the 4th fastest machine as of November 2018.
The 500th machine in the list follows a smoother development of performance (as shown by the squares in the figure), and is roughly 100 times slower compared to the top machine. You might have noticed that there is a turning point in 2008 where the increase in performance of the 500th machine slowed down slightly. In the paper “The TOP500 List and Progress in High-Performance Computing”, the authors suggested that the faster development in the performance of supercomputers prior to 2008 can be attributed to the increase in both the size of supercomputers (in terms of the number of processors) and in the performance of processor cores. After 2008, the increase in supercomputer size slowed down while the performance development was maintained thanks to the increasing number of cores in the multicore processors, according to Figures 2 and 3 in the paper.
The Top500 list (Nov 2018)
At the time of writing, the latest Top500 list is from November 2018. As shown in the figure below, the performances in the Top500 list are listed as Rmax and Rpeak. Note that Rmax is the performance that was actually measured and it is the figure that is used as the ranking criterion in the Top500 list. Rpeak, on the other hand, is the theoretical peak performance of a particular system which is calculated based on the number and type of processors. On modern supercomputers, Rmax is typically around 70% of Rpeak. Taking Summit for example, its Rmax is 0.14 exaFLOPS while its Rpeak reaches 0.2 exaFLOPS.
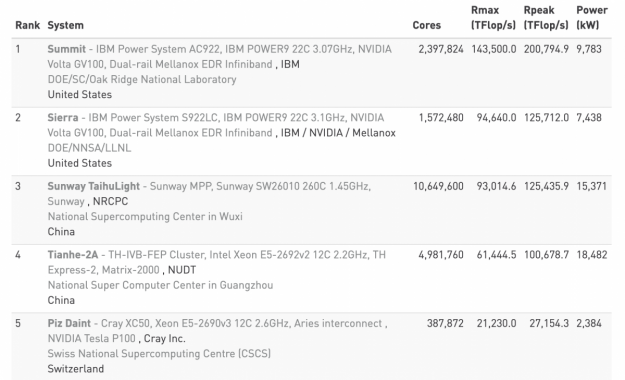
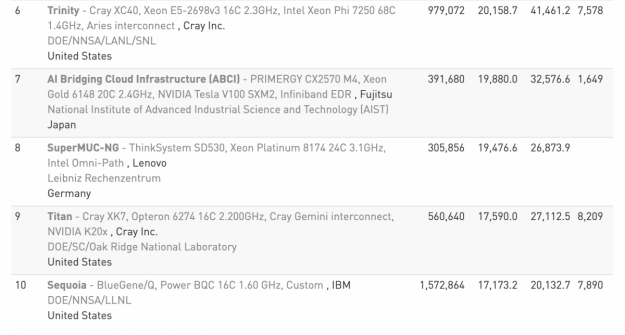 Top 10 supercomputers as of November 2018
Source: https://www.top500.org/lists/2018/11/
Among the current top 10 machines, five are in the United States, two in China, and the remaining three are in Switzerland, Japan and Germany respectively. Five of the top 10 machines use NVIDIA GPUs for acceleration. In particular, the top machine, Summit, is equipped with 27,648 NVIDIA Volta V100 cards. It is worth noting that Summit is also the world’s 3rd most energy-efficient machine, according to the Green500 list. Two other machines, Sierra and ABCI, are also among the top 10 in both the Top500 list and the Green500 list.
The Green500 list ranks the most energy-efficient supercomputers. It is significant because reducing energy consumption is one of the major challenges being faced in working towards exascale computing. The power constraint for a potential exascale supercomputer (that is, the maximum amount of power that such a system could use) is usually 20-30 megawatts, according to a recent article from the HiPEAC (High Performance and Embedded Architecture and Compilation) project. This means that the power efficiency of an exascale supercomputer has to reach 33 gigaFLOPS per watt, which is around twice as efficient as the Shoubu system B, which is currently the most energy-efficient system in the Green500 list (November 2018).
Statistics for (co-)processors
The Top500 list website also provides list statistics for different categories like processor generations, geographical regions, operating systems, and so on. Based on this information, we summarised the processor and accelerator/co-processor families in terms of the number of supercomputers and the sum of performances, as shown in Tables 1 and 2. It can be seen from the two tables that Intel Xeon processors (including Skylake, Broadwell, Haswell, and IvyBridge) and NVIDIA GPUs (including Volta, Pascal, Kepler, and Fermi) are dominant in the Top500 supercomputers as of November 2018. Such dominance is in both the number of supercomputers and the sum of performances. However, if we look at the most powerful machines (that is, the top 10), the processors and accelerators/co-processors have much more diverse origins. This leads to some uncertainty in what the world’s first exascale supercomputer will look like.
Table 1: Processor statistics as of November 2018.
Calculated from Top500 list statistics
| Processor family | System count | Performance sum (petaFLOPS) |
|---|---|---|
| Intel Xeon | 476 | 984.41 |
| IBM Power | 13 | 291.99 |
| Sunway/Shenwei | 1 | 93.02 |
| Fujitsu SPARC64 | 6 | 20.93 |
| AMD Opteron | 2 | 18.76 |
| Hygon Dhyana | 1 | 4.33 |
| Cavium ThunderX2 | 1 | 1.53 |
Table 2: Accelerator/Co-processor statistics as of November 2018.
Calculated from Top500 list statistics
| Accelerator/Co-processor family |
System count | Performance sum (petaFLOPS) |
|---|---|---|
| NVIDIA GPU | 128 | 507.86 |
| Matrix-2000 | 1 | 61.44 |
| Intel Xeon Phi | 8 | 13.76 |
| Deep Computing Processor | 1 | 4.33 |
| PEZY-SC series | 2 | 2.06 |
Summary
We have briefly introduced the Top500 list and discussed relevant topics. Some key points are summarised below.
- The Top500 list ranks supercomputers based on their performance, and is published twice a year (in June and November).
- The performance, Rmax, is measured by the Linpack benchmark with 64-bit floating point arithmetic.
- The next milestone in supercomputer performance is 1 exaFLOPS, or 1018 floating point operations per second.
- The development of performance roughly follows an exponential growth.
- As of November 2018, the top 10 supercomputers are in the United States, China, Switzerland, Japan and Germany.
- Processors and accelerators/co-processors in the most powerful supercomputers have diverse origins.